Abstract
Objective:
To estimate the cost-effectiveness (cost per additional life-year [LY] and quality-adjusted life-year [QALY] gained) of lenalidomide plus dexamethasone (LEN/DEX) compared with bortezomib for the treatment of relapsed-refractory multiple myeloma (rrMM) in Norway.
Methods:
A discrete-event simulation model was developed to predict patients’ disease course using patient data, best response, and efficacy levels obtained from LEN/DEX MM-009/-010 trials and the bortezomib (APEX) published clinical trial. Predictive equations for time-to-progression (TTP) and post-progression survival (PPS) were developed by identifying the best fitting parametric survival distributions and selecting the most significant predictors. Disease and adverse event management was obtained via survey from Norwegian experts. Costs, derived from official Norwegian pricing data bases, included drug, administration, monitoring, and adverse event management costs.
Results:
Complete or partial responders were 65% for LEN/DEX compared to 43% for bortezomib. Derived median TTP was 11.45 months for LEN/DEX compared to 5.15 months for bortezomib. LYs and QALYs were higher for LEN/DEX (4.06 and 2.95, respectively) than for bortezomib (3.11 and 2.19, respectively). The incremental costs per QALY and LY gained from LEN/DEX were NOK 247,978 and NOK 198,714, respectively, compared to bortezomib. Multiple sensitivity analyses indicated the findings were stable. The parameters with the greatest impact were 4-year time horizon (NOK 441,457/QALY) and higher bound confidence intervals for PPS (NOK 118,392).
Limitations:
The model analyzed two therapies not compared in head-to-head trials, and predicted results using an equation incorporating patient-level characteristics. It is a limited estimation of the costs and outcomes in a Norwegian setting.
Conclusions:
The simulation model showed that treatment with LEN/DEX leads to greater LYs and QALYs when compared to bortezomib in the treatment of rrMM patients. The incremental cost-effectiveness ratio indicated treatment with LEN/DEX to be cost-effective and was the basis of the reimbursement approval of LEN/DEX in Norway.
Introduction
Multiple myeloma (MM) is a hematological cancer primarily affecting the older population and typically follows a relapsing courseCitation1–3. Several therapies are effective in MM, but there are challenges in its management, such that initial treatment response rates are relatively high but no therapy is able to eradicate the diseaseCitation2. Consequently, most responses are transient. As myeloma advances, response rates decrease and response duration shortens. Most patients become refractory to current therapies and die of myeloma-progressionCitation4.
In Norway there are ∼300 new MM patients annually and about half are over 60-years-old at diagnosisCitation5. Management of newly diagnosed patients with high dose chemotherapy followed by hematopoietic stem-cell transplantation has provided a survival benefitCitation6 and has become the preferred treatment for patients under the age of 65 yearsCitation7,Citation8. Patients who have either progressed after transplantation or those ineligible for transplantation have few treatment options. Given the significant number of patients for whom high-dose therapy is not possible, improved treatment alternatives are needed.
There is clinical evidence that novel therapies such as lenalidomide (Celgene), an immune-modulating agent, and bortezomib (Johnson & Johnson), a proteasome inhibitor, have been found to improve survival in relapsed-refractory MM (rrMM) patients compared to those not receiving these therapiesCitation6. In contrast, the information about the cost-effectiveness of lenalidomide compared to another standard treatment, such as bortezomib, is very limitedCitation9. Both therapies have been approved in Europe for the management of rrMM. Dimopoulos et al.Citation10 analyzed the pooled data from two studies comparing lenalidomide (LEN) in combination with dexamethasone (DEX) to placebo plus DEXCitation11,Citation12. The median time-to-progression (TTP) was 13.4 months for LEN/DEX compared to 4.6 months for DEX alone at 48 months follow-up. Complete response (CR) and partial response (PR) occurred in 15% and 45.6% of patients, respectively. Richardson et al.Citation13 reported median TTP for bortezomib of 6.2 months at 22 months follow-up with 9% of patients reporting CR and 34% of patients achieving PR.
Prior to the adoption of new therapeutic options, many European countries, including Norway, demanded more clinical and safety evidence than provided in clinical trials. Economic analyses are increasingly required to estimate the costs and outcomes of therapies in order for these to be adequately financedCitation14. These analyses are undertaken with economic models using clinical trial information as inputs and local country treatment patterns in terms of resource use and related costs. The trial data are used to estimate the impact on the costs and outcomes for the specific setting using reasonable assumptions. These analyses are evaluated by national health authorities to support decisions on the financing of new therapiesCitation14.
This paper reports results from a comparison of the expected clinical outcome parameters and the cost-effectiveness of LEN/DEX vs bortezomib in rrMM patients from the Norwegian third-party-payer perspective. Only direct medical costs were considered since the patients in the Weber et al.Citation11 and Dimopoulos et al.Citation12 studies were above 65-years-old or older, and consequently the indirect cost of lost production was supposed to be minimal. The analysis was previously reported to and evaluated by the Norwegian Medicines Agency (NOMA).
As per the requirements of the Norwegian authorities, the outcome of interest in the analysis is the incremental cost-effectiveness ratio, often referred to as the cost for each additional life-year (LY) or quality-adjusted life-year (QALY) gained.
Methods
Model description
Although Markov models are typically used in pharmacoeconomic analyses (such as that used by Ross et al.Citation15), they do not provide the flexibility required for modeling patients with rrMM who have variations in time to response, duration of response, and survivalCitation16. Therefore, a discrete-event simulation (DES) model was developed in ARENA® simulation softwareCitation17. A DES model predicts a patient’s disease course following a treatment decision using all the characteristics (i.e., age, gender, number of prior treatments) obtained from patient data, thus automatically implementing observed correlations between parametersCitation16.
In this model a population of individuals was created by assigning each simulated individual with the specific characteristics of patients based on the actual patient records from the MM-009/-010 trialsCitation11,Citation12 (schematic in ). Patient-level data were available from these trials and their characteristics were similar to those patients enrolled in the bortezomib trial (), thereby providing a platform upon which to compare similar trial outcomes (according to the Norwegian authorities’ guidelines for pharmacoeconomic analysis, the alternative treatment must be relevant for the same patient group and therapeutic indication)Citation18.
Figure 1. Schematic representation of LEN/DEX model. ECOG, Eastern Cooperative Oncology Group; M-protein, monoclonal protein; Pts, patients; QALY, quality-adjusted life-year; Tmt, treatment.
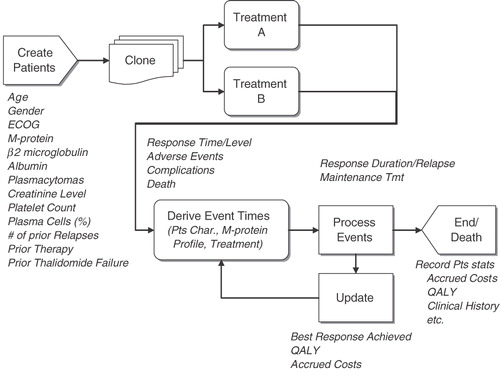
Table 1. Patient characteristics in phase III clinical trial in MM-009 and MM-010 and APEX.
The model generated 1000 simulated patients by random bootstrap sampling with replacement from these patients. As the number of patients simulated was higher than the number of real patients in the clinical trials, real patients may be used several times in the model. In the simulation, the selection is random to avoid any bias. This method is very important in the modeling of rrMM patients since patients’ MM clinical history and clinical characteristics affect the course of disease progression and its effective management.
Overall survival (OS) was calculated based upon the combination of an individual’s TTP and post-progression survival (PPS). TTP was estimated from the time of treatment initiation to the point at which a patient progressed. PPS began at the time of progression and ended with the patient’s death. Patients who died before progression were considered to have had progression-related deaths (i.e., time of progression and time of death are identical).
The model considered four best response levels reported from the clinical trials: complete; partial; stable; and progressive disease based on the International Uniform Response CriteriaCitation19 or European Group for Blood and Marrow Transplant criteriaCitation3. Best response obtained affected both the TTP and PPS.
The main outcomes were the median TTP, median OS, cost per QALY, and cost per LY. The future outcomes of QALYs, LYs, and costs were discounted 4% in accordance with Norwegian standardsCitation20. The model considered drug and disease management costs (direct costs) and outcomes for 2-years in the base case, reflective of the clinical trials’ time horizon. Longer time frames were examined in the sensitivity analysis.
Model inputs
The European summary of product characteristics (SmPCs) for LEN and bortezomib detailed their specific dosing regimens. Efficacy data for LEN/DEX were taken from patient-level data of the MM-009/-010 trials (similar to the data reported by Weber et al.Citation11 and Dimopoulos et al.Citation12), while the bortezomib efficacy was taken from published data of the APEX trialCitation21. Grade 3 and 4 adverse events (AE) rates from the trials were included. Adverse events were analyzed in 3-month successive intervals for LEN/DEX, allowing for the consumption of resources to be more time-sensitive. The APEX trial reported 10-month AE rates and these were separated into 3-month intervals to match the calculation of related resource use as with LEN/DEX. The AE rates represent the 3–6 month interval ().
Table 2. Adverse event and disease complication rates for months 3–6 for LEN/DEX and bortezomib and costs.
Since there have been no clinical studies directly comparing LEN/DEX to bortezomib, these therapies can only be meaningfully compared via an indirect method. The four criteria of TTP, response rates, tolerability, and drug administration were used for this modeled comparison. Details are presented below.
Time-to-progression
In the APEX study (bortezomib vs DEX treatment), TTP was prolonged by 2.7 months (6.2 months vs 3.5 months; p < 0.0001). Within the MM-009 and MM-010 patient-level data, TTP was prolonged substantially more, by a total of 6.5 months with LEN/DEX compared to DEX (11.1 months vs 4.6 months; p < 0.001). Not all patients had progressed in these analyses; thus a statistical equation was developed to predict TTP based on patients’ characteristics and best response. This equation was derived from the pooled MM-009/-010 patient dataCitation11,Citation12, and was only applied in the model to patients not observed to progress on LEN/DEX before the end of the trial. The TTP equation was developed in two steps using parametric survival analysis techniques; first the best-fitting parametric distribution (Weibull being the best fit of four different distributions) was identified based on the goodness of fit of each of the tested distributions and second, predictive variables were selected by dropping those with the weakest effect from the model until only significant predictors remained. Best response was included in the equation; therefore, differences in TTP due to different response profiles for LEN/DEX and bortezomib were inherently captured in the model. It was possible, however, that these treatments affected TTP beyond their impact on response—these differences were factored into the TTP equation by retaining a treatment for LEN/DEX vs DEX in the equation. Similarly, to capture differences in TPP between bortezomib and LEN/DEX beyond their impact on response, a new term was introduced in the equation for bortezomib vs DEX. The value of the term was estimated by adjusting the predicted TTP curve until its median point matched the published median for bortezomib, after adjusting all other predictors (including response) to those of APEX. This approach assumed a common shape for LEN/DEX and bortezomib, and that the equation derived from MM-009/-010 after adjustment for differences in patient characteristics was applicable to the bortezomib population. In particular, interactions between predictors and bortezomib could not be quantified or incorporated into the equation. Confidence intervals around the TTP were analyzed in sensitivity analyses.
Post-progression survival
The PPS statistical equation was developed in the same manner as the TTP. Using the patient-level MM-009/-010 trial data, the best-fitting parametric survival distribution was determined followed by a selection of significant predictors of PPS by dropping those with the weakest effect. The final PPS equation included best response as a predictor, but treatment assignment did not have an effect beyond response. Thus, unlike the TTP equation, the equation did not include an indicator for LEN/DEX vs DEX and no term was included for bortezomib. This effectively assumed that once patients progressed, and given their best response achieved, the initial treatment they received would not affect PPS. Confidence intervals around the PPS were analyzed in sensitivity analyses.
Resource use and cost estimates
The model used publicly available cost information derived from the Norwegian Medicines Agency, Legemiddelverket, in pharmacy selling priceCitation22. The cost was NOK 2749 for a 25 mg capsule of LEN and NOK 11,364 per vial of bortezomib. The model assumed that all patients received the 25 mg dose of LEN for 21 days of each 28-day cycle, although patients in the trials had dose reductions and treatment interruptions. As the effect of these reductions was implicitly captured in the clinical outcome results, the analysis considers LEN treatment costs based on the actual doses administered in the LEN trials. Bortezomib dosing was 1.3 mg/m2/dose, administered as a 3–5 second bolus intravenous injection twice-weekly for 2 weeks (days 1, 4, 8, and 11) followed by a 10-day rest period (days 12–21). The SmPC for bortezomib recommends up to eight 3-week cycles of treatment, whereas the APEX trial reported by Richardson et al.Citation13 includes an additional three 5-week cycles of therapy. As the SmPC for both treatment alternatives was used to inform this analysis, eight cycles was used in the model. Administration costs for bortezomib were derived by using the DRG code 410BCitation23.
The resources used in the management and treatment of rrMM were obtained via a structured questionnaire properly validated and completed by Norwegian and Swedish clinical experts. This survey provided the frequency and type of laboratory and disease monitoring, as well as the treatment and location of care for treatment-related AEs within the Norwegian context. Costs for these events were taken from official Norwegian price lists, physician fees, and the Norwegian DRG database (available from the authors upon request). provides the costs based upon the above resources for each AE or disease-related complication. The cost was applied to the proportion of patients experiencing the event regardless of their rrMM therapy.
Utility estimates
The utility values used in the model were based on a cost-utility study by van Agthoven et al.Citation24 which obtained MM patient values through the Dutch-Belgian Hemato-Oncology Cooperative Study Group.
The model assumed that the utility for progressive disease (0.64) was the same as for patients not responding to treatment. All levels of response had the same utility value (0.81 for responding patients).
Model assumptions
Since the model was built upon patient-level data, fewer assumptions were required than relying upon the published median responses. However, the model analyzed two therapies not directly compared. Data were taken from trials with similar designs and the patients enroled had similar characteristics, but there were undoubtedly differences in the trials that cannot be controlled for, and cross-over from DEX to LEN or bortezomib complicated the analysis.
Only grades 3 and 4 AEs were included in the model; it was assumed that these had the greatest cost impact. It was also assumed that costs for a specific AE did not differ depending on the MM therapy received. Patients with complete response, partial response, or stable disease were assumed to have the same utility values, which favored bortezomib since fewer complete and partial responders than LEN/DEX were reported. Finally, the model assumed that the clinical effectiveness estimates observed in the clinical trials would hold in routine practice.
Results
The model calculated the best response achieved () in close agreement with the trials’ publications. LEN/DEX provided better clinical outcomes than bortezomib in patients who had received at least one prior therapy. Sixty-five percent of LEN/DEX patients were complete or partial responders compared to 43% of bortezomib patients. The model simulation found that median TTP, an important factor in OS, was 11.45 months for patients on LEN/DEX and 5.15 months for patients on bortezomib. Furthermore, LYs and QALYs were also projected to be higher for LEN/DEX (4.06 and 2.95, respectively) than for bortezomib (3.11 and 2.19, respectively) (). Since median LYs had not been reached, OS may have eventually been longer ().
Figure 2. LEN/DEX modeled treatment effect.
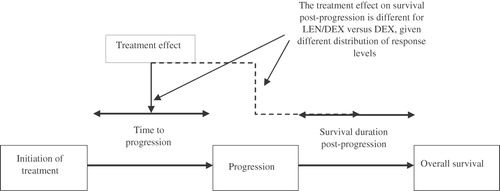
Table 3. Discrete-event simulation model results of LEN/DEX vs bortezomib in relapsed-refractory multiple myeloma patients.
Costs specific to the Norwegian healthcare setting, clinical practice management, and drug prices were applied to health outcomes and the incremental cost-effectiveness ratios (ICERs) were calculated. The total costs of LEN/DEX and related healthcare were NOK 689,207 compared to NOK 500,962 for bortezomib. The Norwegian-specific cost per LY gained was NOK 198,714 and the QALY ICER was NOK 247,078 for LEN/DEX compared to bortezomib.
The number-needed-to-treat was also calculated. This is the number of patients who must be treated in order to observe a specific result. In this analysis, the avoidance of disease progression was selected as the specific result. Similarly, the output favored LEN/DEX, as five patients needed to be treated whereas 11 patients had to be treated with bortezomib to observe one less patient progressing.
Sensitivity analyses were conducted to test which parameters were most sensitive in changing the ICER. also presents the results of the most influential sensitivity analysis. In general, the most sensitive parameters were the cost of LEN/DEX, the model time horizon, and the confidence intervals surrounding the PPS. Using the 95% confidence intervals for the TTP had little impact, but the PPS confidence intervals decreased and increased the ICER (NOK 118,392–412,993/QALY). A lower PPS foreshortened the difference between LEN/DEX and bortezomib leading to a higher ICER. The ICERs increase with a longer time horizon, reflecting the additional doses of LEN/DEX therapy among individuals who have not yet progressed.
In addition to these findings, analyses were conducted using different utility values by response rate and varying the costs of disease monitoring, and these had virtually no impact on the ICERs, remaining below the cost-effectiveness threshold.
Discussion
Cost-effectiveness analyses providing ICERs are advocated in health economic literatureCitation25, and widely simulated and adapted by decision-makers allocating the use of scarce healthcare resourcesCitation26–28. The results presented here indicate that LEN/DEX provides attractive value for money compared to bortezomib in the treatment of rrMM patients. LEN/DEX provides not only longer median TTP than bortezomib (11.45 months vs 5.15 months) and a higher complete response rate (16% vs 9%), but also additional QALYs resulting in NOK 247,078 per QALY. Despite the absence of a formal cost-effectiveness threshold in Norway, and the inherent difficulties in evaluating a patient’s life, the World BankCitation29 has proposed a gross domestic product per capita per year as a pragmatic limit to the value of extra life-years, suggesting NOK 350,000 as society’s maximum willingness to pay. A later publication from the Norwegian Ministry of Finance had also been interpreted as recommending a limit of at least NOK 425,000 in 2005Citation30.
The result from this analysis was therefore considered within the range used by the Norwegian authorities and accepted as evidence to support the financing of LEN for use in the treatment of MM patients who have received at least one prior therapy. Furthermore, all results from the sensitivity analysis fall below these proposed thresholds.
Besides the Norwegian authorities, the Swedish TLV also considered that lenalidomide plus dexamethasone treatment was cost effective relative to bortezomib in patients who have received at least one prior anti-myeloma therapyCitation31. Hornberger et al.Citation32 argued that, from a Swedish perspective, bortezomib was considered cost-effective compared to DEX and LEN/DEXCitation31. However, there were alternative methodological assumptions to project the OS estimates whose detail was not fully illustratedCitation33.
This analysis has limitations. The simulation model indirectly examined the findings from two separate trials by creating a single patient population, applying the observed response rates, and estimating TTP for those patients with incomplete data and creating a clone that is assigned to the comparator arm. Therefore, the model analyzed two therapies not compared in head-to-head trials and predicted results using an equation incorporating patient-level characteristics. It is an estimation whose objective is to assist health authorities implement difficult decisions concerning new therapies. The equations to estimate the TTP and PPS for patients not progressing during the trial were based upon patient characteristics from the MM-009/010 clinical trials and did not include APEX trial patient data. However, the equation for bortezomib TTP was adjusted through iterative testing to obtain the reported TTP from the trial publication. In addition, the patient characteristics from the three trials were relatively similar and trial response rates, which have a large impact on TTP, were reported from the respective trials. Cost-effectiveness analyses are country-specific and their results are not readily transferrable to other settings. As an analysis specific to the Norwegian healthcare setting, clinical practice management and drug prices used here are different from those in other countries. A US analysis, for example, compared total costs of care over 1-year for LEN/DEX vs bortezomib in relapsed myeloma and observed annual excess costs over US$20,000 for bortezomibCitation34. Costs associated with therapies, their administration, and the management of AEs all impact the cost-effectiveness results. As noted in methodological guidelines for economic evaluationsCitation14, other countries will observe different results due to variations in costs and clinical practice. The findings presented here are applicable only to the Norwegian setting.
Finally, the analysis assumed eight cycles of bortezomib treatment as per the SmPC, while the APEX trial protocol reported the use of an additional three cycles. Bortezomib efficacy inputs were taken from reported trial data. As a consequence, the results are based on a conservative estimate of bortezomib treatment costs. Adding an additional three cycles of bortezomib treatment would reduce the incremental cost-effectiveness ratio further in favor of LEN/DEX.
Transparency
Declaration of funding
Funding for this study was provided by Celgene International.
Declaration of financial/other relationships
JM discloses that he is vice-president of a consulting firm that has received grants from Celgene International. LN and AM disclose that they are employed by Celgene International.
Acknowledgments
The authors would like to thank Jack Ishak, Sean Stern, and Ruth Brown of United BIoSource Corporation for their contributions in the development of this paper. Editorial assistance was provided by Excerpta Medica, sponsored by Celgene Corporation.
References
- Mileshkin L, Prince HM. The adverse prognostic impact of advanced age in multiple myeloma. Leuk Lymphoma 2005;46:951-66
- Palumbo A, Anderson K. Multiple myeloma. N Engl J Med 2011;364:1046-60
- Bladé J, Samson D, Reece D, et al. Criteria for evaluating disease response and progression in patients with multiple myeloma treated by high-dose therapy and haemopoietic stem cell transplantation. Myeloma Subcommittee of the EMBT. European Group for Blood and Marrow Transplant. Br J Haematol 1998;102:1115-23
- Agarwal JR, Matsui W. Multiple myeloma: a paradigm for translation of the cancer stem cell hypothesis. Anticancer Agents Med Chem 2010;10:116-20
- Nordic Myeloma Study Group. Available at: http://www.nordic-myeloma.org/content/no/ommyelomatose/default.asp. Accessed 16 May 2011
- Kumar SK, Rajkumar SV, Dispenzieri A, et al. Improved survival in multiple myeloma and the impact of novel therapies. Blood 2008;111:2516-20
- Attal M, Harousseau JL, Stoppa AM, et al. A prospective randomized trial of autogolous bone marrow transplantation and chemotherapy in multiple myeloma. Intergroupe Français du Myélome. N Engl J Med 1996;335:91-7
- Barlogie B, Jagannath S, Epstein J, et al. Biology and therapy of multiple myeloma in 1996. Semin Hematol 1997;34(1 Suppl):67-72
- Messori A, Maratea D, Nozzoli C, et al. The role of bortezomib, thalidomide and lenalidomide in the management of multiple myeloma: an overview of clinical and economic information. Pharmacoeconomics 2011;29:269-85
- Dimopoulos MA, Chen C, Spencer A, et al. Long-term follow-up on overall survival from the MM-009 and MM-010 phase III trials of lenalidomide plus dexamethasone in patients with relapsed or refractory multiple myeloma. Leukemia 2009;23:2147-52
- Weber DM, Chen C, Niesvizky R, et al. Lenalidomide plus dexamethasone for relapsed multiple myeloma in North America. N Engl J Med 2007;357:2133-42
- Dimopoulos M, Spencer A, Attal M, et al. Lenalidomide plus dexamethasone for relapsed or refractory multiple myeloma. N Engl J Med 2007;357:2123-32
- Richardson PG, Sonneveld P, Schuster M, et al. Extended follow-up of phase 3 trial in relapsed multiple myeloma: final time-to-event results of the APEX trial. Blood 2007;110:3557-60
- Drummond M, Barbieri M, Cook J, et al. Transferability of economic evaluations across jurisdictions: ISPOR Good Research Practices Task Force report. Value Health 2009;12:409-18
- Ross JR, Saunders Y, Edmonds PM, et al. A systematic review of the role of bisphosphonates in metastatic disease. Health Technol Assess 2004;8:1-176
- Caro JJ. Pharmacoeconomic analyses using discrete event simulation. Pharmacoeconomics 2005;23:323-32
- Kelton WD, Sadowski RP, Sadowski DA. Simulation with ARENA. Boston: McGraw-Hill, 1998
- Norwegian Medicines Agency. Available at: http://www.legemiddelverket.no/templates/InterPage____25644.aspx?filterBy = CopyToGeneral#5.%20Choice%20of%20basis%20for%20comparison. Accessed 2nd August 2011
- Durie BG, Harousseau JL, Miguel JS, et al. International uniform response criteria for multiple myeloma. Leukemia 2006;20:1467-73
- Norwegian Medicines Agency. Available at: http://www.legemiddelverket.no/ [last accessed 16 May 2011]
- Richardson PG, Sonneveld P, Schuster MW, et al. Bortezomib or high-dose dexamethasone for relapsed multiple myeloma. N Engl J Med 2005;352:2487-98
- Norwegian Medicines Agency. Available at: http://www.legemiddelverket.no/templates/InterPage____82929.aspx. Accessed 12 May 2011
- Informasjonshefte Innsattsstyrt finansiering, Helse-og omsorgsdepartementet 2006
- van Agthoven M, Segeren CM, Buijt I, et al. A cost-utility analysis comparing intensive chemotherapy alone to intensive chemotherapy followed by myeloablative chemotherapy with autologous stem-cell rescue in newly diagnosed patients with stage II/III multiple myeloma; a prospective randomised phase III study. Eur J Cancer 2004;40:1159-69
- Birch S, Gafni A. Information created to avoid reality (ICER): things we should not look to for answers. Pharmacoeconomics 2006;24:1121-31
- Chabot I, Rocchi A. How do cost-effectiveness analyses inform reimbursement decisions for oncology medicines in Canada? The example of sunitinib for first-line treatment of metastatic renal cell carcinoma. Value Health 2010;13:837-45
- Ström O, Borgström F, Kleman M, et al. FRAX and its applications in health economics-cost-effectiveness and intervention thresholds using bazedoxifene in a Swedish setting as an example. Bone 2010;47:430-43
- Vossius C, Nilsen OB, Larsen JP. Health state values during the first year of drug treatment in early-stage Parkinson’s disease: a prospective, population-based, cohort study. Drugs Aging 2009;26:973-80
- Bringedal B, Iversen T, Kristiansen IS. Hvor mye bør samfunnet være villig til å betale for helseforbedringer? Verdien av liv og helse. HERO Skriftserie 2003: 6. Oslo: Universitetet i Oslo, 2003
- Veileder isamfunnsøkonomiske analyser. Oslo: Finansdepartementet, 2005. (odin.dep.no/filarkiv/266324/Veileder i samfunnsok analyse (4.10. 2006).)
- Tandvards och Lakemedelsformansverket. Dental and Pharmaceutical Benefts Agency, TLV, [online]. Available at: http://www.tlv.se/upload/beslut_2010/bes100701-revlimid.pdf. Accessed 21 Mar 2011
- Hornberger J, Rickert J, Dhawan R, et al. The cost-effectiveness of bortezomib in relapsed/refractory multiple myeloma: Swedish perspective. Eur J Haematol 2010;85:484-591
- Ishak J, Rodrigues F. Cost effectiveness of treatments for relapsed/refractory multiple myeloma: response to a methodology. Eur J Haematol 2011;87:95 (in response to Hornberger J, Rickert J, Dhawan R, Liwing J, Aschan J, Löthgren M. The cost effectiveness of bortezomib in relapsed/refractory multiple myeloma: Swedish perspective. Eur J Haematol 2010;85:484-91)
- Durie BG, Borello I, Binder G, et al. Treatment cost comparison in relapsed multiple myeloma. Haematologica 2011;96(1 Suppl):poster P-379