
Abstract
Objective:
The aim of this study was to assess cost-effectiveness of the different Disease Modifying Drugs (DMD) used as first-line treatments (interferons IM IFNβ-1a, SC IFNβ-1a, SC IFNβ-1b, and glatiramer acetate, GA) in Remitting-Relapsing Multiple Sclerosis (RRMS) in Spain.
Methods:
A Markov model was developed to simulate the progression of a cohort of patients with RRMS, during a period of 10 years. Seven health states, defined by the Expanded Disability Status Scale (EDSS), were considered in the model. Patients with an EDSS score less than 6.0 were assumed to be treated with one of the DMD. In addition, all patients were assumed to receive symptomatic treatment. The monthly transition probabilities of the model were obtained from the literature. The analysis was performed from the societal perspective, in which both direct and indirect (losses in productivity) healthcare costs (€, 2010) were included. A discount rate of 3% was applied to both costs and efficacy results.
Results:
GA was the less costly strategy (€322,510), followed by IM IFNβ-1a (€329,595), SC IFNβ-1b (€ 333,925), and SC IFNβ-1a (€348,208). IM IFNβ-1a has shown the best efficacy results, with 4.176 quality-adjusted life years (QALY), followed by SC IFNβ-1a (4.158 QALY), SC IFNβ-1b (4.157 QALY), and GA (4.117 QALY). Incremental costs per QALY gained with IM IFNβ-1a were €−1,005,194/QALY, €−223,397/QALY, and €117,914/QALY in comparison to SC IFNβ-1a, SC IFNβ-1b, and GA, respectively.
Conclusions:
First-line treatment with GA is the less costly strategy for the treatment of patients with RRMS. Treatment with IM IFNβ-1a is a dominant strategy (lower cost and higher QALY) compared with SC IFNβ-1a and SC IFNβ-1b. However, IM IFNβ-1a is not a cost-effective strategy vs GA, because incremental cost per QALY gained with IM IFNβ-1a exceeds the €30,000 per QALY threshold commonly used in Spain.
Limitations:
The highly-restrictive inclusion criteria of clinical trials limits generalization of the results on efficacy to all patients with multiple sclerosis. Availability of data for head-to-head comparisons is associated with the use of information from clinical trials.
Introduction
Multiple sclerosis (MS) is an autoimmune neurological disease. It is fundamentally characterized by degenerative inflammation and demyelination of the central nervous system (CNS). The most common form of MS is relapsing-remitting multiple sclerosis, which represents ∼65% of patients with MSCitation1. MS is the chronic neurological disease with the greatest prevalence among young adults; indeed, 70% of patients develop MS between the ages of 15 and 45Citation2,Citation3. MS is highly prevalent in Spain, affecting 50–70 of every 100,000 inhabitantsCitation4–6.
There is currently no effective cure for MS. However, treatments with Disease Modifying Drugs (DMD) slows disease progression and prevents new relapses in MS patients. Actually, in Spain, the treatments used as a first-line of RRME therapy are glatiramer acetate and the interferons beta-1a and beta-1b; the second-line treatment is natalizumab monoclonal antibodyCitation7. Fingolimod is a novel MS-immunosuppressant-treatment recently approved by the Food and Drug Administration and the European Medicines Agency; but at the moment of this analysis not commercialized in Spain.
The introduction of DMDs in the therapeutic arsenal for MS has meant an increase in the management costs of this diseaseCitation8,Citation9. Various studies have shown that the economic impact of the disease is fundamentally related to the progression of the disability, the appearance of relapsesCitation10, and the cost of the treatmentCitation8,Citation9.
In order to determine the efficiency of the different DMDs for MS (i.e., the relationship between the incremental cost associated with these medications for disease management and the benefits provided by DMDs to MS patients), several modeling studies have been developedCitation11–17.
Many publications focused their analyses on the comparison between the best supportive care strategy vs the administration of any of the DMDs available. Most of them conclude that the DMDs are not cost-effective compared with the best supportive careCitation12,Citation17.
The management of RRME in Spain implies the use of any of the DMD, as established in the consensus document prepared by the Spanish Neurological SocietyCitation7. In the actual economical context, it is important to assess the cost-effectiveness relationship among the DMD, and provide reliable information that support clinicians and healthcare stakeholders decisions.
The objective of this study was to assess cost-effectiveness of the different therapies used as first-line treatments (interferons beta-1a, beta-1b, and glatiramer acetate) for patients with relapsing-remitting multiple sclerosis (RRMS) in Spain.
Methods
Model description
In order to calculate the incremental cost-effectiveness ratio of first-line treatments among patients diagnosed with RRMS in Spain, a Markov model was developed using Microsoft Excel® based on previously developed modelsCitation11,Citation13. Markov models are characterized by representation of the clinical progression of patients by transitions through different health states. The present model considers seven health states () that are defined by the Expanded Disability Status Scale (EDSS)Citation18:
EDSS 0.0–2.5: no limitations or small mobility limitations;
EDSS 3.0–5.5: moderate mobility limitations;
EDSS 6.0–7.5: requiring some help to walk or a wheelchair;
EDSS 8.0–9.5: incapable of getting out of bed;
Death (natural causes or EDSS 10);
Relapse EDSS 0.0–2.5: a relapse with a change in disability within EDSS 0.0–2.5; and
Relapse EDSS 3.0–5.5: a relapse with a change in disability within EDSS 3.0–5.5.
Figure 1. Schematic description of Markov model.
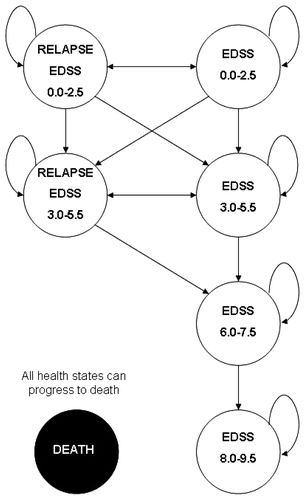
Similar to other modelsCitation11,Citation13,Citation16,Citation19, the duration of each Markov cycle is set at 1 month. In this way, the patients may, in each month, either remain in the same health state, progress to the next state, or die. Natural death is considered in all heath states excepts for EDSS 8.0–9.5. Transition probability from EDSS 8.0–9.5 to death is considered death due to MS, given that data confirm that 90% of patients with MS are disabled before dyingCitation20.
All parameters (transition probabilities and cost) were fitted to 1-month cycles.
Treatments
The model assumes that patients with an EDSS score between 0.0 and 5.5 are treated with one of the DMDs recommended as a first-line treatment for RRMS by the Spanish Neurology Society (Sociedad Española de Neurología)Citation7:
Intramuscular interferon β-1a (IM IFNβ-1a; Avonex®, Biogen Idec Ltd, Switzerland);
Subcutaneous interferon β-1a 44 mcg (SC IFNβ-1a 44 mcg; Rebif 44®, Merck Serono Europe Ltd, Switzerland);
Subcutaneous interferon β-1b (SC IFNβ-1b; Betaferon®, Bayer Schering Pharma AG, Germany and Extavia®, Novartis Europharm Ltd, Switzerland); and
Subcutaneous Glatiramer Acetate (SC GA; Copaxone®, Teva Pharmaceutical Ltd).
In addition to treatment with a DMD, the model assumes that all patients receive symptomatic treatment for MS. In our model, changes in DMD treatment were not considered, so when a patient discontinues only symptomatic treatment is allowed.
Population
The model simulates a hypothetical cohort of 22,255 patients, equivalent to an estimated number of RRMS patients in Spain in 2010Citation21.
With the intention of representing current clinical practices for RRMS patients, patients with varying degrees of disability in terms of EDSS were includedCitation22. specifies the distribution of the patients with respect to their EDSS scores.
Table 1. Summary of model inputs.
Perspective, time horizon, and discount rate
The analysis was performed from the societal perspective, whereby both direct and indirect health costs were included (pharmacological, MS management, and Loss of productivity costs).
The model assumes a time horizon equals the maximum follow-up period in the clinical trial, in order to minimize the bias of using short-term data to estimate long-term efficacy. The time horizon was set to 10 years, follow the period of Ford et al.Citation23 study.
Therefore, an annual discount rate of 3% was applied to adjust clinical and economical resultsCitation24.
Transition probabilities
Transition probabilities for symptomatic treatment were obtained from the literatureCitation11. These transitions represent the progression over time of patients with MS ()Citation3,Citation25–28, and apply to those patients who are not treated with DMDs. In addition, death probability due to natural causes was estimated from the National Statistics Institute (2008 data)Citation29. This death probability was applied for all health states, except for EDSS 8.0–9.5. The death transition probability for patients in EDSS 8.0–9.5 was calculated to be the probability of death by natural causes plus the probability of dying of MS based on Prosser et al.Citation19.
It was assumed that DMDs reduce the transition probabilities to health states with higher EDSS score (greater disability) and the probability of a relapse, i.e., a transition to a health state with a relapse (Relapse EDSS 0.0–2.5 or Relapse EDSS 3.0–5.5). Based on this assumption, to calculate transition probabilities for patients treated with a DMD, symptomatic treatment transition probabilities were used as baseline and adjusted by treatment’s effects on relapses relative risks and disease progression.
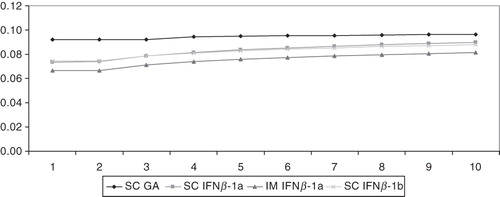
Data used for estimating the effectiveness of each of the treatments was obtained from the following clinical trials: for SC GACitation23,Citation30, for IM IFNβ-1aCitation31, for SC IFNβ-1aCitation32,Citation33, and for SC IFNβ-1bCitation34,Citation35. To avoid the bias derived of the different follow-up period in the clinical trial data, DMDs effectiveness was fitted with log-linear regression curves ().
Figure 2. Relapse rate estimation.
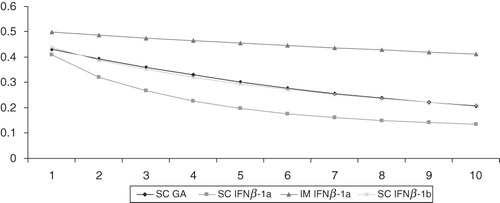
Figure 3. Disease progression estimation for EDSS 0.0–2.5 to EDSS 3.0–5.5.
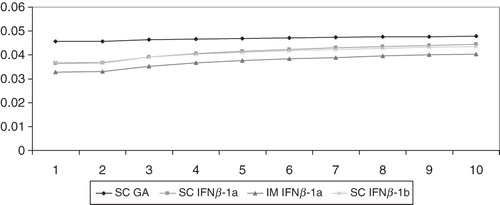
Figure 4. Disease progression estimation for EDSS 3.0–5.5 to EDSS 6.0–7.5.
Neutralizing antibodies
The administration of interferons may cause the development of neutralizing antibodies (NAbs). The development of NAbs to β-interferons abrogates biological activity in the short-term, and leads to a loss of clinical benefit of patients with MECitation36.
The current model assumes that the presence of NAbs modifies the probability of developing a relapse among patients who receive β-interferon as a DMD. Therefore, the probabilities of suffering a relapse were adjusted using NAbs development incidence dataCitation36. This fitting was only applied after the second year of treatment with β-interferon. NAbs incidence data are specified in .
Utilities
Quality-adjusted life years (QALYs) were calculated by multiplying the life years gained (LYG) by a utility value corresponding to each health state (QALY = LYG * Utility).
The utilities () were obtained from an observational study performed in SpainCitation8 using a sample of 1626 patients with MS who responded to the EQ-5D questionnaireCitation37–39.
Resource use and cost estimation
The model included DMD treatment costs, symptomatic treatment costs, management costs of each health state, and loss of productivity-related costs. All costs were obtained from the literature, were confirmed by an expert panel, and were updated to €2010 through the annual data of the Consumer Price Index (CPI)Citation40 when necessary.
A five expert panel lead by Dr Arroyo validated the inputs.
Pharmacological cost
DMDs pharmacological costs were expressed as ex-factory prices, and dosages used were those recommended in the summary product characteristicsCitation41–45.
specifies DMDs pharmacological cost per month.
Table 2. Costs (monthly cost, €, 2010).
Costs associated with the management of MS
Medical costs related to MS were obtained from the literatureCitation8. To estimate the symptomatic treatment cost of MS, an expert panel was consulted; the panel provided information about symptom frequency (spasticity, pain, seizures, depression, and anxiety) and their clinical management.
The cost of the treatments for these symptoms was calculated from the ex-factory prices as a function of dosage recommended in each of the respective summary product characteristicsCitation46. The MS management costs were disaggregated into medical costs and symptomatic treatment costs, per month.
Loss of productivity costs
Costs derived from loss of productivity were calculated according to the cost of lost working days due to MS. To estimate the loss of productivity costs, the percentage of sick leave among MS patientsCitation8 and the mean cost of one working day (€21.10/day based on 2010 Spanish cross-professional minimum wageCitation47) were used. It was assumed that treatment with DMDs reduce the percentage of sick leave (53.7% for SC GA, 20.8% for IM IFNβ-1a, and SC IFNβ-1a and 8.2% for SC IFNβ-1b)Citation48. The monthly costs due to loss of productivity are specified in .
Cost-effectiveness and cost-utility analysis
The life years gained (LYG), the quality-adjusted life years (QALY), the average number of years without a relapse, and the mean percentage of patients with an EDSS score greater than 6.0 during the time horizon considered were used as benefit measures.
The efficiency of comparing the treatments in RRMS was established through the Incremental Cost-Effectiveness Ratio (ICER) and the Incremental Cost-Utility Ratio (ICUR). For each comparison, the reference treatment was the most effective of the treatments compared.
For an appropriate interpretation of these ratios, this study used the commonly accepted efficiency threshold in Spain (€30,000 per QALY)Citation49.
Sensitivity analysis
To evaluate the consistency of the model results, univariate sensitivity analyses were performed. The values modified in the analyses were:
Discount rate was set to 0% and 5%;
The incidence of NAbs appearance, using data from RossmanCitation50;
The monthly cost due to loss of productivity. Assuming a common reduction of 40% in sick leave for all of the DMDs, a monthly cost for productivity loss was set at €141.11 for all of the patients who received treatment with a DMD; and
Time horizon considered was set to 2, 4, 6, and 8 years.
Results
Reference scenario
With a time horizon of 10 years, the total costs of multiple sclerosis per patient were €329,595.43, €348,208.20, €333,925.43, and €322,509.96 for IM IFNβ-1a, SC IFNβ-1a, SC IFNβ-1b, and SC GA, respectively (). The cost per patient for DMDs was, €47,531.94 (14.4%) for IM IFNβ-1a, €65,474.67 (18.8%) for SC IFNβ-1a, €48,751.47 (14.6%) for SC IFNβ-1b, and €42,453,89 (13.2%) for SC GA.
Table 3. Results.
The modeling of the disease shows that there are differences in the results (as measured by LYG and QALYs) obtained with the four DMDs. The health benefit that supports these strategies ranges between a minimum of 8.579,81 LYG/patient (SC GA) and a maximum of 8.580,77 LYG/patient (IM IFNβ-1a) or, respectively, 4.116,90 to 4.176,99 QALYs/patient over a time horizon of 10 years. These differences are also reflected in the survival percentages of patients with a score on the EDSS scale between 0.0–5.5. The percentages were 42.52%, 40.77%, 40.92%, and 38.28% for IM IFNβ-1a, SC IFNβ-1a, SC IFNβ-1b, and SC GA, respectively.
The average time free from relapses (in years) per patient was 9.792,81, 9.614,62, 9.879,43, and 9.795,77 for SC GA, IM IFNβ-1a, SC IFNβ-1a, and SC IFNβ-1b, respectively.
The incremental costs per quality adjusted life year (QALY) gained for IM IFNβ-1a in comparison to the other therapies were €−1,005,194/QALY compared with SC IFNβ-1a, €−223,397/QALY compared with SC IFNβ-1b, and €117,914/QALY compared with SC GA. ICURs comparing SC IFN-1a with SC IFNβ-1b or SC GA were €16,504,952/QALY and €618,146/QALY, respectively. ICUR of SC IFNβ-1b compared with SC GA was €280,422/QALY.
Deterministic sensitivity analysis
The change in the incidence of NAbs appearance according to RossmanCitation50 in the baseline case yielded average years without a relapse of 9.6159, 9.8955, 9.7848, and 9.7928 for IM IFNβ-1a, SC IFNβ-1a, SC IFNβ-1b, and SC GA, respectively.
When a monthly cost due to productivity loss of €141.11 was applied for all the DMDs, the total costs of the disease per patient in the baseline case were €326,294.04, €344,863.09, €328,422.06, and €324,805.73 for IM IFNβ-1a, SC IFNβ-1a, SC IFNβ-1b, and SC GA, respectively.
The ICURs obtained by varying the time horizon and discount rates of the analysis are shown in .
Table 4. Sensitivity analysis results.
Discussion
In this study, a cost-effectiveness analysis was performed to assess the efficiency of first-line treatments for RRMS available in Spain. The results of the analysis show that IM IFNβ-1a is a dominant strategy compared with SC IFNβ-1a or SC IFNβ-1b. However, the treatment with IM IFNβ-1a is not a cost-effective strategy vs SC GA, with an acceptability threshold of €30,000/QALYCitation49. The differences in effectiveness between both therapies do not set off the incremental drug acquisition costs of IM IFNβ-1a compared with SC GA. However, differences in effectiveness among all DMDs are small compared with the higher differences in costs. This fact is also supported by the sensitivity analyses performed in the model.
The model estimates that treatment with SC GA compared with IM IFNβ-1a renders a ratio of €28,497 per relapse-free year. This result shows that treatment with SC GA can be considered in terms of relapse-free years as a cost effective strategy compared with IM IFNβ-1a, considering a threshold of €30,000 per relapse-free year.
Previous studies11,12,13,15,16,51 have suggested that the use of DMDs involves an additional economic investment in disease management that produces the benefits of a reduced incidence of relapses and a delay in the progression of the disease, thus achieving an improvement for patients.
Comparisons with other economic evaluations are difficult due to differences in terms of the methodology and design. The models of Goldberg et al.Citation51 in the US and Nuitjen et al.Citation15 in Germany employ as a main result the number of relapses avoided instead of the cost per QALY gained; however, SC GA was the lowest global cost for managing MS strategy in both studies.
The present Markov model has been previously used to evaluate the efficiency of SC GA in comparison to symptomatic treatment. In the US, Bell et al.Citation11 estimated that the incremental cost-effectiveness ratio of SC GA in comparison to symptomatic treatment was $258,465/QALY (US dollars, valued in 2005), which was considered cost-effective using a threshold of $50,000/QALY gainedCitation52. Another study performed in the USCitation13 concluded that therapy with SC GA was also the less costly comparing with the other DMDs, but not a dominant strategy (in terms of 2007 costs saved) in comparison to symptomatic treatment for MS. In both studies, SC GA was the least costly option compared to the other treatments assessed in the study, natalizumabCitation13 and interferons (IM IFNβ-1a SC IFNβ-1a, SC IFNβ-1b)Citation11.
In a cost-utility study performed in Spain considering a time horizon of 54 yearsCitation53, treatment with SC GA turned out to be the dominant strategy when compared individually with each of the three interferons (IM IFNβ-1a SC IFNβ-1a, SC IFNβ-1b) evaluated or jointly with a combination of the three (in 2001 values).
The current model has some limitations that should be considered when interpreting the results. The inclusion of long-term prospective treatment information in a model is the option preferred by decision-makers for the processes of adopting new therapeutic strategies. Naturalistic design studies with prospective determination of the consumption of medical resources would be idealCitation54 for obtaining data with an economic focus; however, when this type of data is not available, as in this case, it is necessary to base models on data from clinical trials, with the limitations that impliesCitation55 for the external validity of the results. The highly-restrictive inclusion criteria of clinical trials limits generalization of the results on efficacy to all patients with multiple sclerosis.
There is also a limitation in the availability of data for head-to-head comparisons associated with the use of information from clinical trials. Since the comparative studies published to dateCitation56,Citation57 do not contain enough information to complete the model, it was necessary to use several sources.
In the model it was assumed that the individuals were always working. This assumption was made because data available about working activity in RRME patients were not split by EDSS levels. However, this issue was tested in a sensitivity analysis.
The use of data from different sources requires the adoption of certain assumptions, and the quality of the results is conditional on the consistency of the studies of origin. In the present model, the influence of the assumptions and of the heterogeneity of these sources was limited by the performance of a sensitivity analysis. Our simulation was also not able to include the individual characteristics of the patients, a common characteristic of all cohort models, and, for this reason, the model results represent an average patient.
Despite the above-mentioned limitations, the model assumptions may be considered reasonable, even conservative, and the results of the sensitivity analysis attest to the robustness of the results.
Conclusions
First-line treatment with GA is the less costly strategy for the treatment of patients with RRMS. Treatment with IM IFNβ-1a is a dominant strategy (lower cost and higher QALY) compared with SC IFNβ-1a and SC IFNβ-1b. IM IFNβ-1a is not a cost-effective strategy vs GA, because incremental cost per QALY gained with IM IFNβ-1a is much above the €30,000 per QALY threshold commonly used in Spain.
Transparency
Declaration of funding
This study was funded by Teva Pharmaceutical.
Declaration of financial/other interest
ES and MAC have disclosed that they are employees of Pharmacoeconomics & Outcomes Research Iberia, Madrid, Spain, an independent contract health economic organization that has received research funding from Teva Pharmaceutical. RS has disclosed that he is employed by Teva Pharmaceutical. RA has disclosed that he serves as a consultant to and has received honoraria from Teva Pharmaceutical, as well as other pharmaceutical companies that market drugs for the treatment of patients with multiple sclerosis and other medical conditions.
References
- Noseworthy JH, Lucchinetti C, Rodriguez M, et al. Multiple sclerosis. N Engl J Med 2000;343:938-52
- Confavreux C, Aimard G, Devic M. Course and prognosis of multiple sclerosis assessed by the computerized data processing of 349 patients. Brain 1980;103:281-300
- Weinshenker BG, Bass B, Rice GP, et al. The natural history of multiple sclerosis: a geographically based study. I. Clinical course and disability. Brain 1989;11:133-46
- Modrego PJ, Pina MA. Trends in prevalence and incidence of multiple sclerosis in Bajo Aragón, Spain. J Neurol Sci 2003;216:89-93
- Aladro Y, Alemany MJ, Pérez-Vieitez MC, et al. Prevalence and incidence of multiple sclerosis in Las Palmas, Canary Islands, Spain. Neuroepidemiology 2005;24:70-5
- Ares B, Prieto JM, Lema M, et al. Prevalence of multiple sclerosis in Santiago de Compostela (Galicia, Spain). Mult Scler 2007;13:262-4
- García Merino A, Fernández O, Montalbán X, et al. [Spanish Neurology Society consensus document on the use of drugs in multiple sclerosis: escalating therapy]. Neurologia 2010;25:378-90
- Kobelt G, Berg J, Lindgren P, et al. Costs and quality of life of multiple sclerosis in Spain. Eur J Health Econ: HEPAC: Health Econ Prev Care 2006;7:S65-S74
- Kobelt G, Berg J, Lindgren P, et al. Costs and quality of life of patients with multiple sclerosis in Europe. J Neurol Neurosurg Psychiatry 2006;77:918-26
- Casado V, Martinez-Yelamos S, Martinez-Yelamos A, et al. ¿Cuánto cuesta un brote de esclerosis múltiple en Cataluña. Neurologia 2006;21:341-7
- Bell C, Graham J, Earnshaw S, et al. Cost-effectiveness of four immunomodulatory therapies for relapsing-remitting multiple sclerosis: a Markov model based on long-term clinical data. J Manag Care Pharm 2007;13:245-61.
- Kobelt G, Berg J, Lindgren P, et al. Modeling the cost-effectiveness of a new treatment for MS (natalizumab) compared with current standard practice in Sweden. Mult Scler 2008;14:679-90
- Earnshaw SR, Graham J, Oleen-Burkey M, et al. Cost effectiveness of glatiramer acetate and natalizumab in relapsing-remitting multiple sclerosis. Appl Health Econ Health Policy 2009;7:91-108
- Guo S, Bozkaya D, Ward A, et al. Treating relapsing multiple sclerosis with subcutaneous versus intramuscular interferon-beta-1a: modelling the clinical and economic implications. Pharmacoeconomics 2009;27:39-53
- Nuijten M, Mittendorf T. A health-economic evaluation of disease-modifying drugs for the treatment of relapsing-remitting multiple sclerosis from the German societal perspective. Clin Ther 2010;32:717-28
- Janković SM, Kostić M, Radosavljević M, et al. Cost-effectiveness of four immunomodulatory therapies for relapsing-remitting multiple sclerosis: a Markov model based on data a Balkan country in socioeconomic transition. Vojnosanit Pregl 2009;66:556-62
- Noyes K, Bajorska A, Chappel A, et al. Cost-effectiveness of disease-modifying therapy for multiple sclerosis: a population-based study. Neurology 2011 26;77:355-63
- Kurtzke JF. Rating neurologic impairment in multiple sclerosis: an expanded disability status scale (EDSS). Neurology 1983;33:1444-52
- Prosser LA, Kuntz KM, Bar-Or A, et al. Cost-effectiveness of interferon beta-1a, interferon beta-1b, and glatiramer acetate in newly diagnosed non-primary progressive multiple sclerosis. Value Health 2004;7:554-68
- Phadke JG. Survival pattern and cause of death in patients with multiple sclerosis: results from an epidemiological survey in northeast Scotland. J Neurol Neurosurg Psychiatry 1987;50:523-31
- Instituto Nacional de Estadística. Revisión del Padrón municipal 2010. Datos a nivel nacional. INE 2011. http://www.ine.es/jaxi/tabla.do. Accessed at 7/2/2011
- Kobelt G, Lindgren P, Smala A, et al. Costs and quality of life in multiple sclerosis: a cross-sectional observational study in Germany. Stockholm School of Economics Working Paper Series in Economics and Finance. Final Version - August 12, 2000
- Ford CC, Johnson KP, Lisak RP, et al. Copaxone Study Group. A prospective open-label study of glatiramer acetate: over a decade of continuous use in multiple sclerosis patients. Mult Scler 2006;12:309-20
- López Bastida J, Oliva J, Antoñanzas F, et al. Propuesta de guía para la evaluación económica aplicada a las tecnologías sanitarias. Madrid: Plan Nacional para el SNS del MSC. Servicio de Evaluación del Servicio Canario de la Salud; 2008. Informes de Evaluación de Tecnologías Sanitarias: SESCS N° 2006/22. http://aunets.isciii.es/ficherosproductos/132/MemoriaFinal.pdf. Accessed at 18/10/2010
- Weinshenker BG, Ebers GC. The natural history of multiple sclerosis. Can J Neurol Sci 1987;14:255-61
- Weinshenker BG, Bass B, Rice GP, et al. The natural history of multiple sclerosis: a geographically based study. 2. Predictive value of the early clinical course. Brain 1989;112:1419-28
- Goodkin DE, Hertsgaard D, Rudick RA. Exacerbation rates and adherence to disease type in a prospectively followed-up population with multiple sclerosis. Implications for clinical trials. Arch Neurol 1989;46:1107-12
- Runmarker B, Andersen O. Prognostic factors in a multiple sclerosis incidence cohort with twenty-five years of follow-up. Brain 1993;116:117-34
- Instituto Nacional de Estadística. Defunciones según la Causa de Muerte 2008. Resultados nacionales. INE 2010. http://www.ine.es/jaxi/tabla.do?path=/t15/p417/a2008/l0/&file=01001.px&type=pcaxis&L=0. Accessed at 7/2/2011
- Johnson KP, Brooks BR, Cohen JA, et al. Extended use of glatiramer acetate (Copaxone) is well tolerated and maintains its clinical effect on multiple sclerosis relapse rate and degree of disability. Copolymer 1 Multiple Sclerosis Study Group. Neurology 1998;50:701-8
- Clanet M, Kappos L, Hartung HP, et al. Interferon beta-1a in relapsing multiple sclerosis: four-year extension of the European IFNbeta-1a Dose-Comparison Study. Mult Scler 2004;10:139-44
- PRISMS Study Group. Randomised double-blind placebo-controlled study of interferon beta-1a in relapsing/remitting multiple sclerosis. PRISMS (Prevention of Relapses and Disability by Interferon beta-1a Subcutaneously in Multiple Sclerosis) Study Group. Lancet 1998;352:1498-504
- PRISMS (Prevention of Relapses and Disability by Interferon β-1a subcutaneously in Multiple Sclerosis) Study Group. PRISMS-4: long-term efficacy of interferon-β-1a in relapsing MS. Neurology 2001;56:1628-36
- The IFNB Multiple Sclerosis Study Group. Interferon beta-1b is effective in relapsing-remitting multiple sclerosis. I. Clinical results of a multicenter, randomized, double-blind, placebo-controlled trial. Neurology 1993;43:655-61
- IFNB Multiple Sclerosis Study Group and the University of British Columbia MS/MRI analysis Group. Interferon beta-1b in the treatment of multiple sclerosis: final outcome of the randomized controlled trial. Neurology 1995;45:1277-85
- Bertolotto A. Implications of neutralising antibodies on therapeutic efficacy. J Neurol Sci 2009;277:S29-32
- EuroQol - a new facility for the measurement of health-related quality of life. Health Policy 1990;16:199–208
- Badia X, Roset M, Monserrat S, et al. La versión española del EuroQol: descripción y aplicaciones. Med Clin (Barc) 1999;112(1Suppl):79-85
- Badía X, Montserrat S, Roset M, et al. Feasibility, validity and test-retest reliability of scaling methods for health states: the visual analogue scale and the time trade-off. Qual Life Res 1999;8:303-10
- Instituto Nacional de Estadística. Índice de precios al consumo 2009. Base 2006. Resultados nacionales INE 2010. http://www.ine.es/jaxi/menu.do?type=pcaxis&path=/t25/p138&file=inebase&L=0. Accessed at 7/2/2011
- European Medicines Agency (EMEA). European public assessment report (EPAR) for Avonex. Summary of product Characteristics (last updated 22/09/2011). Available at: http://www.ema.europa.eu/docs/en_GB/document_library/EPAR_-_Product_Information/human/000102/WC500029425.pdf. Accessed 30/12/2011
- European Medicines Agency (EMEA). European public assessment report (EPAR) for Betaferon. Summary of product Characteristics (last updated 18/10/2011). Available at: http://www.ema.europa.eu/docs/en_GB/document_library/EPAR_-_Product_Information/human/000081/WC500053225.pdf. Accessed 30/12/2011
- European Medicines Agency (EMEA). European public assessment report (EPAR) for Extavia. Summary of product Characteristics (last updated 22/06/2011). Available at: http://www.ema.europa.eu/docs/en_GB/document_library/EPAR_-_Product_Information/human/000933/WC500034701.pdf. Accessed 30/12/2011
- European Medicines Agency (EMEA). European public assessment report (EPAR) for Rebif. Summary of product Characteristics (last updated 22/06/2011). Available at: http://www.ema.europa.eu/docs/en_GB/document_library/EPAR_-_Product_Information/human/000933/WC500034701.pdf. Accessed 30/12/2011
- Ministerio de Sanidad y Política Social. Agencia Española de medicamentos y productos sanitarios. ficha técnica Copaxone. Summary of product Characteristics (last updated September 2009). Available at: https://sinaem4.agemed.es/consaem/especialidad.do?metodo=verFichaWordPdf&codigo=65983&formato=pdf&formulario=FICHAS&file=ficha.pdf. Accessed 30/12/2011
- Consejo General de Colegios de Farmacéuticos. Catálogo de especialidades farmacéuticas. Consejo Plus 2009. Madrid: Consejo General de Colegios de Farmacéuticos; 2007. http://www.portalfarma.com. Accessed at 7/2/2011
- Instituto Nacional de Estadística. Condiciones de trabajo y relaciones laborales Salario mínimo interprofesional. Serie 1990–2010. INE 2011. http://www.ine.es/jaxi/tabla.do?type=pcaxis&path=/t22/a063/a1998/l0/&file=m30026.px. Accessed at 7/2/2011
- Lage MJ, Castelli-Haley J, Oleen-Burkey MA. Effect of immunomodulatory therapy and other factors on employment loss time in multiple sclerosis. Work 2006;27:143-51
- Sacristán JA, Oliva J, Del Llano J, et al. ¿Qué es una tecnología sanitaria eficiente en España? Gac San 2002;16:334-43
- Rossman HS. Neutralizing antibodies to multiple sclerosis treatments. J Manag Care Pharm 2004;10(Suppl):S12-19. http://www.amcp.org/data/jmcp/June04Supplement1.pdf. Accessed March 5, 2007
- Goldberg LD, Edwards NC, Fincher C, et al. Comparing the cost-effectiveness of disease-modifying drugs for the first-line treatment of relapsing-remitting multiple sclerosis. J Manag Care Pharm 2009;15:543-55
- Gold M, Siegel JE, Russell LB, et al. Cost-effectiveness in health and medicine. New York: Oxford University Press; 1996
- Rubio-Terrés C, Arístegui Ruiz I, Medina Redondo F, et al. Análisis coste-utilidad del tratamiento de la esclerosis multiple remitente-recidivante con acetate de glatiramero o interferón beta en España. Farm Hosp 2003;27:159-65
- Garrison LP, Jr., Neumann PJ, Erickson P, et al. Using real-world data for coverage and payment decisions: the ISPOR Real-World Data Task Force report. Value Health 2007;10:326-35
- Goeree R, Burke N, O’Reilly D, et al. Transferability of economic evaluations: approaches and factors to consider when using results from one geographic area for another. Curr Med Res Opin 2007;23:671-82
- Panitch H, Goodin D, Francis G, et al; EVIDENCE (Evidence of Interferon Dose-response: European North American Comparative Efficacy) Study Group and the University of British Columbia MS/MRI Research Group. Benefits of high-dose, high-frequency interferon beta-1a in relapsing-remitting multiple sclerosis are sustained at 16 months: final comparative results of the EVIDENCE trial. J Neurol Sci 2005;239:67-74
- Mikol DD, Barkhof F, Chang P, et al. REGARD study group. Comparison of subcutaneous interferon beta-1a with glatiramer acetate in patients with relapsing multiple sclerosis (REbif vs. Glatiramer Acetate in Relapsing MS Disease [REGARD] study): a multicentre, randomised, parallel, open-label trial. Lancet Neurol 2008;7:903-14