Abstract
Background:
Using a United Kingdom (UK)-based National Health Services perspective for 2011 this study first estimated the cost-effectiveness and budget impact implications for lopinavir/ritonavir (LPV/r) vs atazanavir plus ritonavir (ATV+RTV) treatment of antiretroviral therapy (ART)-naïve patients and secondly examined the long-term health-related quality-of-life (HRQoL) and economic implications for LPV/r vs ATV+RTV treatment of ART-experienced patients.
Methods:
A previously published Markov model that integrates epidemiological data of human immunodeficiency virus (HIV) with predictors of coronary heart disease (CHD) was modified under a clearly specified set of assumptions to reflect viral load (VL) suppression profiles and other differences for these two regimens, applying results from the CASTLE study in ART-naïve patients and using data from BMS-045 in ART-experienced patients. ART costs were referenced to current (2011) pricing guidelines in the UK. Medical care costs reflected UK treatment patterns and relevant drug pricing. Costs and outcomes were discounted at 3.5% per year. Costs are expressed in British pounds (£) and life expectancy in quality-adjusted life years (QALYs).
Results:
In the ART-naïve subjects, the model predicted a marginal improved life expectancy of 0.031 QALYs (11 days) for the ATV+RTV regimen as a result of predicted CHD outcomes based on lower increases in cholesterol levels compared with the LPV/r regimen. The model demonstrated cost savings with the LPV/r regimen. The total lifetime cost savings was £4070 per patient for the LPV/r regimen. LPV/r saved £2133 and £3409 per patient at 5 and 10 years, respectively. Referenced to LPV/r, the incremental cost-effectiveness ratio (ICER) for ATV+RTV was £149,270/QALY. For ART-experienced patients VL suppression differences favored LPV/r, while CHD risk associated with elevated total cholesterol marginally favored ATV+RTV, resulting in a net improvement in life expectancy of 0.31 QALYs (106 days) for LPV/r. Five-year costs were £5538 per patient greater for ATV+RTV, with a discounted lifetime saving of £1445 per LPV/r patient. LPV/r was modestly dominant economically, producing better outcomes and cost savings.
Limitations:
The limitations of this study include uncertainty related to how well the model’s assumptions capture current practice, as well as the validity of the model parameters used. This study was limited to using aggregated data in the public domain from the two clinical trials. Thus, some of the model parameters may reflect limitations due to trial design and data aggregation bias. This study has attempted to illuminate the effect of these limitations by presenting the results of the comprehensive sensitivity analysis.
Conclusions:
Based on 2011 costs of HIV in the UK and the published efficacy data from the CASTLE and BMS-045 studies, ATV+RTV-based regimens are not expected to be a cost-effective use of resources for ART-naïve patients similar to patients in the CASTLE study, nor for ART-experienced patients based on the only published comparison of ATV+RTV and LPV/r.
Introduction
There have been considerable improvements in the prognoses of human immunodeficiency virus (HIV)-infected individuals with the increase in the number of potent combination antiretroviral therapies (cARTs). However, it is becoming increasingly complex to select first-line as well as second-line ART regimens. Consideration must be given to numerous factors such as efficacy, potential adverse events, viral resistance and drug acquisition costs, with this last aspect having a particular importance in recent years. As healthcare systems are ever more constrained by limited resources, they have unavoidably become more cost conscious.
Use of these newest therapies may prevent or delay the onset of later disease stages, delivering the cost savings of fewer acquired immune deficiency syndrome (AIDS)-related events. As patients live longer periods before reaching an advanced disease state or needing more intensive treatment regimens, they benefit from increased quality-adjusted life-years (QALYs) and may postpone the use of more costly new or more complex therapy regimens. The efficacy and safety of the newest ART regimens have been demonstrated in randomized controlled trials as well as long-term follow-up studiesCitation1,Citation2; nevertheless, multiple factors must be individually considered for each patient. Accounting for patient preferences, tolerability of potential adverse events, co-morbid conditions and risk factors (including ART-naïve vs ART-experienced status) can improve patient adherence to recommended dosage and administration schedules. These patient-specific factors are of vital importance when choosing an ART regimen, given the consequences of non-compliance and potential subsequent development of antiretroviral drug resistance.
An additional aspect of ART selection has been suggested by recent reports of changes in blood lipids—especially total cholesterol [TC] and total triglycerides [TG]—among recipients within head-to-head clinical studiesCitation3,Citation4. A potential influence of ART on an increased risk for coronary heart disease (CHD) independent of lipids is still under investigation; however, risk associated with lipid changes can be conventionally assessed using the Framingham equationCitation5.
The multinational CASTLE studyCitation3 compared the efficacy of two boosted protease inhibitor (bPI) regimens in ART-naïve patients; the ART regimens consisted of co-formulated lopinavir-ritonavir (LPV/r) vs atazanavir with separately formulated ritonavir (ATV+RTV). RTV provides pharmacokinetic enhancement (‘boosting’) for these therapiesCitation2. In each ART regimen, the bPI was administered in combination with fixed-dose tenofovir disoproxil fumarate/emtricitabine (TDF/FTC). At week 48, similar results were observed in terms of proportion of patients reaching an undetectable viral load (< 50 copies/mL) as well as mean increases from baseline in CD4+ T-cell count. This is a notable finding since these markers of HIV disease can predict outcomes which affect costs of treatment and, thus, burden to health systems. However, CASTLE study results also showed that TC levels were significantly elevated (≥ 240 mg/dL) in 18% and 7% (p < 0.0001) of patients receiving LPV/r and ATV+RTV, respectively, at 48 weeks.
Switching to a second-line PI-based regimen is recommended for patients who fail a first-line non-nucleoside reverse transcriptase inhibitor (NNRTI)-based regimen. The BMS-045 study compared ATV+RTV to LPV/r regimens in ART-experienced patientsCitation4. The primary end-point was defined as the mean change in HIV ribonucleic acid (RNA) levels from baseline to week 48. By this unusual end-point, results demonstrated non-inferiority between the LPV/r and ATV+RTV arms. However, using a more typical end-point, i.e., the percentage of subjects with HIV RNA levels < 50 copies/mL at week 48, LPV/r provided a greater proportion of patients with viral loads (VL) < 50 copies/mL. For ATV+RTV vs LPV/r, a difference of −8.0% (95% confidence interval [CI], −20.4 to 4.4) was estimated for HIV RNA < 50 copies/mL in intention-to-treat (ITT) study. In this study, TC levels at 48 weeks were elevated above guideline levels in 23% of patients receiving LPV/r compared to 7% of patients on ATV+RTV (p < 0.0001).
The long-term economic impacts of combined VL response and differences in TC, as observed in the CASTLECitation3 and BMS-045Citation4 studies comparing LPV/r to ATV+RTV, are not obvious. Considering the long-term multiple effects of HIV disease, ART benefits and ART-related risks, the objectives of this report were 2-fold. Using UK-specific data, we first estimated the cost-effectiveness and budget-impact implications of LPV/r vs ATV+RTV for treatment of ART-naïve patients applying results of the CASTLE study and secondly examined the long-term health-related quality-of-life (HRQoL) and economic implications for LPV/r vs ATV+RTV treatment of ART-experienced patients using data from study BMS-045.
Methods
Model outline
We modified a previously published Markov model of HIV diseaseCitation6–8 () to integrate epidemiological data of HIV with predicted CHD riskCitation5 under a clearly specified set of assumptions to reflect VL suppression profiles and TC differences for LPV/r and ATV+RTV regimens. The aim of this modified Markov model was to incorporate UK-based National Health Services costs for 2011, account for CHD events and produce survival and cost estimates for ART-naïve and ART-experienced patients, separately. Baseline and 48-week profiles of TC and CD4+ T-cell distributions were populated from either the CASTLE study population for ART-naïve estimates or the BMS-045 study population for ART-experienced estimates. CHD events were based on the Framingham equation for risk estimates associated with TC levels as observed at 48 weeksCitation5.
Figure 1. Markov model structure with health states defined by CD4+ T-cell count, viral load categories, AIDS event, or deathCitation7.
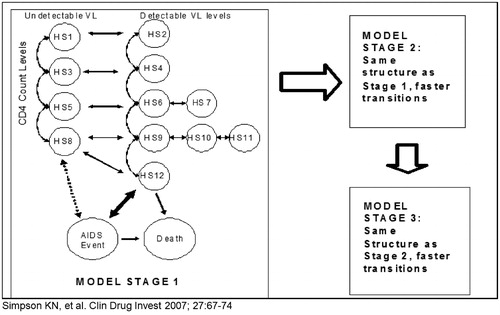
Both models—i.e., one each for ART-naïve and for ART-experienced patients—reflect current treatment practice and were supplemented with two health states specifying the myocardial infarction events predicted and the deaths expected from CHD based on the Framingham CHD risk equationCitation5. The model does not predict all CHD events, but rather assigns a quarterly risk score that is based solely on the differences expected for the two regimens. Thus, the CHD estimation is not absolute, but marginal and based on differences in the total cholesterol values reported for the regimens at the end of the clinical trial. Each model uses the patient distribution by CD4+ T-cell count, VL (undetectable: suppression < 400 copies/mL and < 50 copies/mL) and TC levels at baseline and 48 weeks for each regimen based on the applicable published study data from the CASTLE or BMS-045 study ().
Table 1. Model cohorts at 48 weeks per respective literature results.
Each Markov model captures the treatment-modified disease progression of HIV or AIDS patients on ART using three linked Markov processes that accommodate transitions through stages of treatment. All HIV-infected patients who enter the model are assumed to eventually fail a specific ART, requiring them to switch to a new regimen. Patients move from one stage of the model to another as they fail the respective regimen, with up to three possible effective regimens populating the model. There is an assumption that some patients will die before they experience all three regimens and the cause of death can be from either an AIDS event or a CHD event. Based on their clinical, virological and immunological parameters at baseline, at Stage 1, patients enter the model in one of the 12 health states ().
Table 2. Health states populating model with their associated QALY weights and corresponding AIDS event costs for the United Kingdom (UK; 2011 totals per quarter).
For the first four model cycles (first year), progression through the 12 health states or into one of the two death states involves 48-week results of the regimen-specific clinical trials ()Citation3,Citation4. Then, patients progress at the same rate for each of the two regimens. This progression process is effected by a model stage-specific transition matrix. After the initial 48 weeks in Stage 1, the transition matrix for changes in CD4+ T-cell counts and VL was estimated from epidemiological data of ART-naïve patientsCitation9–11, and assigned utility weights from the literatureCitation12–14, thus capturing the mean rate of disease progression and the resulting quality-of-life for ART-naïve patients.
Patients who fail their first treatment (entering a health state with a CD4+ T-cell count < 350 cells/mL and detectable VL after 48 weeks) begin a second ART regimen (subsequent therapy) and enter Stage 2 of the model. Thus, patients move to each subsequent stage of the model based upon their health state with respective CD4+ T-cell counts and VL. Patients enter Stage 3 (salvage therapy) as they need a third ART regimen. The transition matrices for the model stages 2 and 3 were derived from epidemiological data of ART-experienced patients. Patients can move out of a specific health state once every 3 months—or per each ‘cycle’—or remain within that state. The model is cycled until patients reach the death state. This progression captures current practice because the model allows patients to switch to a new ART within 3 months of developing a detectable viral load. Only for salvage patients does the model assume that viral load cannot be suppressed by switching to a new regimen.
Level of analysis
Although it may be of interest to account separately for the costs to patients, the model accounts only for the direct costs of HIV management that specifically fall on the UK healthcare payer, who will be making decisions about when to fund ART as well as which particular drugs will be available. Therefore, we utilized the cost perspective of the UK medical care system—the National Health Service—and 2011 cost values.
Cost estimates
All model costs were referenced to UK prices and inflated to reflect those for 2011 (). UK healthcare cost data were based on CD4+ T-cell group-specific resource utilization rates recorded for 5766 patients from 2004–2006, obtained from the National Prospective Monitoring System–HIV Health-economic Collaboration (NPMS-HHC) cohort. These data, describing utilization and cost of HIV services by the CD4+ T-cell count strata used in the model, were extracted from HIV clinics across the UKCitation15 and inflated to 2011 values using a 2% annual inflation rate. Drug-acquisition costs in the UK were sourced from the Monthly Index of Medical Specialties (MIMS) 2011. In addition to the costs of ATV+RTV and LPV/r treatments, those for HIV and CHD eventsCitation12 were taken into account within the model.
Table 3. Model drug and treatment switching cost in 2011.
HRQoL estimates
A health state-specific HRQoL weight is assigned to each survival period. The QALY weights used were from previously published data that were based on the analysis of data from a set of 21,000 responses to the EQ-5D™ instrument from patients in antiretroviral studiesCitation7. The estimation of utility weights used Dolan’sCitation12 transformation. A CHD event was assumed to decrease a patient’s HRQoL by 40%, as reported by Castiel et al.Citation13. The risk parameters used to predict long-term quality-adjusted survival and lifetime cost estimates for the base model are provided in .
Modeling and outcomes
We assessed incremental cost-effectiveness ratios (ICERs) to perform a comparative cost-effectiveness analysis (CEA) between LPV/r and ATV+RTV for treating HIV-infected subjects in the UK. For the purpose of calculating incremental cost-effectiveness we discounted both QALYs and costs at 3.5% per annum. The reported cost savings or other cost values were not discounted. Additionally, with healthcare payers needing short-term cost projections for budget planning purposes, we also estimated the expected economic impacts for the UK on an annual basis and present them as costs at 5 and 10 years after initiating the ART. The model was programmed in Microsoft Excel® software. The effects of variations in the assumptions used in the model and in cost parameters were assessed in a sensitivity analysis.
Results
The ART-naïve model predicted an improved life expectancy of 0.031 QALYs (11 days) for the group who initiated cART using an ATV+RTV-based regimen, and predicted lifetime cost savings for the group starting ART therapy on an LPV/r-based regimen. The ICER for ATV+RTV was £149,270/QALY, reflecting the very small marginal increase in QALYs offered by that regimen (). Further, the total lifetime cost was £4070 per patient less for the LPV/r regimen and included savings for the LPV/r regimen of £2133 and £3409 per patient at 5 and 10 years, respectively. To be cost-effective at a £20,000 ICER threshold, the price of ATV+RTV in the UK would have to decrease by 13.8%, and a £30,000 cost-effectiveness threshold for the UK would require a price decrease of 12.7% for the ATV+RTV regimen. The price discounts required for ATV+RTV to achieve an acceptable threshold would be proportionally greater for purchasers who receive discounts on LPV/r.
Table 4. ATV+RTV regimen incremental cost-effectiveness ratios and LPV/r regimen savings estimates for the UK, 2011.
In the ART-experienced model, the VL suppression favored LPV/r, with a net improvement in life expectancy (0.31 QALYs, 106 days) for LPV/r. Furthermore, the costs per patient for ATV+RTV were £5538 and £7623 greater at 5 and 10 years, respectively, with a discounted lifetime saving of £1445 per patient for LPV/r. Thus, LPV/r was modestly dominant, producing better outcomes and cost savings. If the UK ATV price were to be decreased by 53%, LPV/r would still be cost-effective at the UK ICER threshold of £30,000.
Sensitivity analyses were conducted to identify the most important factors affecting the model outcomes other than ATV and LPV/r prices (). We tested the effects of varying (1) the cost of the RTV needed for boosting ATV, cost of statins to manage TC elevation, and the increased cost of HIV treatments resulting from disease progression; (2) the effect of baseline risk of CHD due to smoking and elevated systolic blood pressure; and (3) the effects of drug-acquisition costs for the second and third ART regimens into which patients progress subsequent to failure of the initial regimens. The most influential factor on the result for either the ART-naïve or -experienced model was the cohort’s baseline risk of CHD. Assuming a ‘worst-case scenario’ that all patients would be smokers, and have an elevated systolic blood pressure controlled by medication to a mean of 140 mmHg at baseline, the average survival increased by 31 days for ART-naïve patients on the ATV+RTV regimen. However, the 5 - and 10-year cost savings with LPV/r were still substantial, and the estimated ICER for the ATV+RTV regimen remained substantially above the £30,000 threshold, which is the generally accepted cut-off for an ICER that indicates good value for medical innovations in the UK. The LPV/r regimen remained modestly dominant—i.e., it was cost saving and produced better lifetime outcomes—even when we increase the CHD risk assumptions as listed above for the ART-experienced population.
Table 5. Sensitivity analysis assumption changes and resulting ICERs.
Discussion
There are a number of limitations to this study. First, our decision analyses used the Markov model approach populated by data from either the CASTLE study population for ART-naïve estimates or the BMS-045 study population for ART-experienced estimatesCitation3,Citation4. This approach is limited by how well the structure of our Markov model predicts the future for this cohort of patients. The model progression rates are, by necessity, based on data from previous cohorts of patients, who may have worse outcomes compared to future patients when new drugs become available. For example, survival and HRQoL for HIV patients may increase as a result of improved ART. The model may also under-estimate future costs, since new and improved drugs may be more expensive than those available today. However, the model applies these same assumptions to both treatment groups, so the errors are expected to be of equal magnitude.
A second limitation is related to the model parameters used to estimate efficacy of the two regimens. Our estimates apply the 48-week ITT VL suppression rates, CD4+ T-cell count increase, and rates of patients with elevated TC reported in the CASTLE or BMS-045 studiesCitation3,Citation4. These three clinical parameters drive the outcomes predicted after the first year of the model. However, outcomes will be affected by many more variables in real-practice settings. It would have been preferable to use the 96-week data from the CASTLE studyCitation16. However, this was not possible because these data are inappropriate for such an estimation model for the following reasons. The 96-week ITT CASTLE data analysis includes as regimen failures LPV/r patients who discontinued the LPV/r regimen by 48 weeks because the trial protocol would not allow them to switch from the old capsule formulation of LPV/r to the new improved tablet formulation. A total of 18 LPV/r patients withdrew consent to the study, as compared to five patients on the ATV+RTV arm. These trial design issues are counted as failures in the ITT analysis of VL suppression below 50 copies/mL, and as a result the ITT 96-week analysis reports a p-value below 0.05; this p-value would be greater than 0.06 if failures were to exclude protocol-based withdrawals for both regimens. This issue is important in an economic model because protocol failure cases are more closely related to the trial protocol than to actual regimen failure expected in practice. As a cost-effectiveness model should strive to represent real-practice conditions, we were limited to using the 48-week CASTLE data in this model.
The model assumes that patients who discontinue the clinical trial will switch to another ART regimen and, further, that this second regimen is somewhat less effective at suppressing VL than the initial ART used. This is the case for most patient cohorts; however, while the model constructed for this study allows us to accurately reflect much of current practice, we do not know what will happen in future populations. Thus, the model is not able to capture issues such as any differences in responsiveness to future drugs, such as new, more powerful nucleoside reverse transcriptase inhibitors (NRTIs) or in the effectiveness of future regimens due to PI cross-resistance.
The model may slightly over-estimate CHD events associated with elevated TC since its estimates are based on risk patterns of the Framingham equationCitation5. Reports from the D:A:D studyCitation17 have indicated that risk of CHD in patients with HIV disease may be slightly lower than expected from the Framingham population. However, this over-estimation of CHD risk is likely to bias our estimates against the LPV/r regimen. The model does not incorporate TG elevation because recent results from the D:A:D cohortCitation18 report that these lipid markers have an insignificant effect on CHD risk. Although the use and costs of cholesterol-lowering agents were applied to the LPV/r subjects based on lipid profiles, their impact on reducing CVD risk was not modeled, therefore the CVD risk as defined by the prediction model may have over-estimated the number of predicted CVD events. The development of lipoatrophy or increase in abdominal fat is not included in the model because good predictors of risk associated with these conditions are not clearly quantifiable at the present time.
OthersCitation19 have compared the economic impacts of LPV/r and ATV+RTV in ART-naïve patients and found estimates that differ greatly from the ones identified by our model. An economic study utilizing the 96-week CASTLE data to compare the economics of LPV/r and ATV+RTV concluded that the ATV+RTV regimen is superior. A limitation to this study, however, is that the model incorporates the ITT analysis results, which include the very large number of patients on LPV/r who discontinued owing to various study protocol issues, and were defined as ‘treatment failure’ for the model. This ‘failure’ rate was applied as a measure of differences in effect to all future years for the LPV/r arm. We consider this to be a problematic approach to use in a model, particularly as published data from large cohorts clearly indicate that failure rates decrease over time for all ART regimensCitation11. Additional limitations to the previously published model include the following. First, the model only allows two sequential treatment regimens, which does not reflect current practice for ART-naïve patientsCitation1,Citation2. As a result, the model predicts a mean survival of 18.52 and 18.51 years for the two populations. This could vastly under-estimate the predicted survival from other models, which is ∼ 24.2 yearsCitation20. Since the average age of patients in CASTLE was 37 years, the mean age of death would be 55 years, which runs counter to the current view of the HIV epidemic as a chronic condition with close-to-normal life expectancy. Secondly, patients who for any reason failed were assumed to be switched to either (60%) efavirenz+emtricitabine+tenofovir or (40%) darunavir+RTV+abacavir+lamivudine. There were no other regimens and no salvage opportunities included; patients were simply assumed to stay on these regimens until death. In addition, there is no discussion of the effects on CD4+ T-cell and VL assumed for these second regimens in the model. We believe that this is not an accurate reflection of practice patterns. Third, the model assumes that adherence rates were 71% for LPV/r and 82% for ATV+RTV. These numbers were based on older reports from the literature (2002 and 2007) despite the fact that 100% adherence in the CASTLE trial was reported for 84% of LPV/r regimen patient vs 82% of ATV+RTV-regimen patients in the 96-week trial reportCitation16. An assumption that the non-adherent patients had a 10% greater chance of viral failure, over and above the erroneous 19% differential embedded in the transition probabilities, may have constituted double counting. Finally, an HRQoL estimate from study data of patients with refractory irritable bowel syndrome from 1996, 2000 and 2001 was applied in this model to calculate a decrement due to diarrhea of ∼ 0.178; this is 6-fold higher than a more reliable decrement of 0.030 points, which was reported in an analysis of HIV patients with diarrhea from the ACTG 5142 trialCitation21. We believe that these noted considerations contributed to the different conclusions made from the model developed in this study.
This present study adds to the existing UK cost-effectiveness literature. In ART-naïve patients, Beck et al.Citation22,Citation23 determined that ART containing two NRTIs and an NNRTI confers a cost saving over two NRTIs plus a boosted PI regimen with respect to both drug cost and use of hospital services. This study compares classes of drugs, not individual drugs. Hence, the conclusions could be reversed in individual drugs comparison; i.e., an individual PI may be more cost-effective compared to an individual NNRTI. Individual drug regimen comparisons should be the basis of informed decision-making when wanting to compare specific regimens and not broad between-class comparisons.
Regarding PI-based therapies, for experienced patients, previous work by our groupCitation24 concluded that LPV/r was highly cost-effective relative to ATV+RTV in a four-country model, including the UK: the 5- and 10-year cost savings were £2311 and £3000, respectively, at a lifetime benefit of 4.6 quality-adjusted life months. The lifetime cost per QALY was £4679.
A second study in experienced patients published by Moeremans et al.Citation25 found that boosted darunavir (DRV+RTV) was more cost-effective than control PIs. The control PIs group received a mix of different PIs, and outcomes were thus averaged to be compared to DRV+RTV. As mentioned above, this study is not an individual drug comparison and hence has a limited interest in drug selection process.
Only in experienced, PI-resistant patients has DRV+RTV been found to be more cost-effective than LPV/r. Using an adapted Markov model in an ART-experienced patient population who demonstrated PI resistance, Moeremans et al.Citation26 calculated the predicted gain in QALY with DRV+RTV-based therapy to be 0.550 in the UK compared with LPV/r-based treatment. The estimated base-case ICER for the UK was €14,778 (£12,612)/QALY gained.
Finally, although monotherapy is currently off-license in the UK, Gazzard et al.Citation27 concluded that DRV+RTV monotherapy was economically advantageous to triple therapy (DRV+RTV plus two NRTIs) in ART-experienced patients while maintaining HIV RNA suppression < 50 copies/mL over 96 weeks. The mean per-patient savings with DRV+RTV monotherapy was 52% (£4126 vs £8642) compared with triple therapy. Pre-trial costs of NNRTI- and PI-based ART were £6906 and £8348, respectively. The 96-week horizon of this cost analysis is short in comparison to other analyses that project lifetime costs and may not be appropriately informative for chronic conditions such as HIV. The long-term resistance implications of DRV+RTV monotherapy are unknown and costs would potentially be impacted.
Thus, among the PIs, DRV+RTV is more cost-effective than LPV/r in experienced, PI-resistant patients. In the case of ART-naïve and in ART-experienced patients, this present study adds to the evidence that LPV/r confers a cost-effectiveness advantage over ATV+RTV, with DRV+RTV reserved for later lines of therapy. Ideally we would like to design a head-to-head clinical trial to compare outcomes for patients, as we have done in this modeling study. However, such a trial would be expensive to perform and could be expected to have severe difficulties in achieving enrollment. Furthermore, it would require a very large sample size to compensate for a large expected drop-out of patients. Indeed, it is doubtful that the final results would be relevant for informing clinical decisions, because HIV therapy changes rapidly, and clinicians and patients are eager to switch to new therapies that hold a promise of improvement. Thus, our only choice for examining the potential long-term combined effects of treatment cost and effect differences may rest with modeling studies, such as this one. However, these results are best used to inform debate, not for dictating practice.
Conclusions
Based on the only published randomized clinical trials comparing ATV+RTV and LPV/r in appropriate populations, the model estimates show that an ATV+RTV-based regimen is not a cost-effective use of resources among ART-naïve patients nor in ART-experienced patients. LPV/r treatment offers short-term, long-term, and lifetime budgetary savings while producing similar/improved HIV effectiveness outcomes compared to ATV+RTV. The clinical risks projected from the reported differences in lipid profiles have less impact on outcomes and costs than the primary management issues related to HIV progression.
Thus, among PIs, in the case of ART-naïve and in ART-experienced, this present study adds to the evidence that LPV/r confers a cost-effectiveness advantage over ATV+RTV. DRV+RTV is more cost-effective than LPV/r in PI-resistant experienced patients. Therefore, from a cost-effectiveness point of view, LPV/r should be preferred to ATV+RTV as first-line PI and DRV+RTV should be reserved for PI-resistant patients. It is important for the reader to note that comprehensive, long-term, country-specific economic estimates should be considered when choosing an ART treatment option. This study provides prescribers and payers with a thorough and up-to-date cost effectiveness review of antiretroviral therapy for the UK.
Transparency
Declaration of funding
This study was funded by Abbott Laboratories.
Declaration of financial/other relationships
Dr Simpson has disclosed that she was a consultant to Abbott; Dr Beck was a consultant on the UK costs. Drs Baran, Dietz, and Van de Steen have all disclosed that they are Abbott employees. Mr Collomb has disclosed that he was an Abbott employee at the time this study was completed.
References
- Gilleece Y, Chadwick DR, Breuer J, et al. For the BHIVA Guidelines Subcommittee. British HIV Association guidelines for antiretroviral treatment of HIV-2-positive individuals 2010. HIV Med 2010;11:611-9
- Gazzard BG; on behalf of the BHIVA Treatment Guideline Writing Group. British HIV Association guidelines for the treatment of HIV-1-infected adults with antiretroviral therapy 2008. HIV Med 2008;9:563-608
- Molina JM, Andrade-Villanueva J, Echevarria J, et al. Once-daily atazanavir/ritonavir versus twice-daily lopinavir/ritonavir, each in combination with tenofovir and emtricitabine, for management of antiretroviral-naïve HIV-1-infected patients: 48 week efficacy and safety results of the CASTLE study. Lancet 2008;372:646-55
- Johnson M, Grinsztejn B, Rodriguez C, et al. Atazanavir plus ritonavir or saquinavir, and lopinavir/ritonavir in patients experiencing multiple virological failures. AIDS 2005;19:685-94
- Anderson KM, Wilson PWF, Odell PM, et al. An updated coronary risk profile. A statement for health professions. Circulation 1991;83:356-62
- Simpson KN, Luo MP, Chumney EG, et al. Cost effectiveness of using lopinavir/ritonavir vs. nelfinavir as the first highly active antiretroviral regimen for HIV infection. HIV Clin Trials 2004;5:294-304
- Simpson KN, Luo M, Chumney ECG, et al. Cost-effectiveness of lopinavir/ritonavir compared to atazanavir in antiretroviral-naïve patients: modeling the combined effects of HIV and heart disease. Clin Drug Investig 2007;27:67-74
- Simpson KN, Roberts G, Hicks CB, et al. Cost-effectiveness of tipranavir in treatment-experienced HIV patients in the United States. HIV Clin Trials 2008;9:22-237
- Ghani AC, de Wolf F, Ferguson NM, et al. Surrogate markers for disease progression in treated HIV infection. J Acquir Immune Defic Syndr 2001;28:226-31
- Ghani AC, Henley WE, Donnelly CA, et al. Comparison of the effectiveness of non-nucleoside reverse transcriptase inhibitor-containing and protease inhibitor-containing regimens using observational databases. AIDS 2001;15:1133-42
- Mocroft A, Ruiz L, Reiss P, et al. Virological rebound after suppression on highly active antiretroviral therapy. AIDS 2003;17:1741-51
- Dolan P. Modeling valuations for EuroQoL health states. Med Care 1997;35:1095-108
- Castiel D, Herve C, Gaillard M, et al. Cost-utility analysis of early thrombolytic therapy. PharmacoEconomics 1992;1:438-42
- Mrus JM, Yi MS, Freedberg KA, et al. Utilities derived from visual analog scale scores in patients with HIV/AIDS. Med Decis Making 2003;23:414-21
- Beck EJ, Mandalia S, Lo G, et al; Gazzard B for the NPMS-HHC Steering Group. Use and cost of HIV ServiceProvision in UK NPMS -HHC Sites: aggregate analyses January 1996 to December 2006. NPMS-HHC Coordinating and Analytic Centre, St. Stephen’s Centre, Chelsea and Westminster Hospital Trust, London, UK, 2008
- Molina J-M, Andrade-Villanueva J, Echevarria J, et al.; CASTLE Study Team. Once-daily atazanavir/ritonavir compared with twice-daily lopinavir/ritonavir, each in combination with tenofovir and emtricitabine, for management of antiretroviral-naïve HIV-1-infected patients: 96-week efficacy and safety results of the CASTLE study. J Acquir Immune Defic Syndr 2010;53:323-32
- Friis-Moller. Exposure to PIs and NNRTI and risk of myocardial infarction: results of the D:A:D Study. Presented at the 13th Conference on Retroviruses and Opportunistic Infections (CROI). Denver, CO: 5–8 February 2006; Session 35, Oral Abstract 144
- Worm SW, Kamara DA, Reiss P, et al. Elevated triglycerides and risk of myocardial infarction in HIV-positive persons. AIDS 2011;25:1497-504
- Broder MS, Chang EY, Bentley TGK, et al. Cost effectiveness of atazanavir-ritonavir versus lopinavir-ritonavir in treatment-naïve human immunodeficiency virus-infected patients in the United States. J Med Econ 2011;14:167-78
- Schackman BR, Gebo KA, Walensky RP, et al. The lifetime cost of current human immunodeficiency virus care in the United States. Medical Care 2006;44:990-7
- Simpson KN, Dietz B, Baran R, et al. Economic modeling of the combined effects of HIV-disease, cholesterol and lipoatrophy based on ACTG 5142 trial data. Cost Eff Resour Alloc 2011;9:5
- Beck EJ, Mandalia S, Lo G, et al; NPMS-HHC Steering Group. Cost-effectiveness of early treatment with first-line NNRTI-based HAART regimens in the UK, 1996-2006. PLoS One 2011;6:e20200
- Beck EJ, Mandalia S, Youle M, et al. Treatment outcome and cost-effectiveness of different highly active antiretroviral therapy regimens in the UK (1996--2002). Int J STD AIDS 2008;19:297-304
- Simpson KN, Jones WJ, Rajagopalan R, et al. Cost effectiveness of lopinavir/ritonavir tablets compared with atazanavir plus ritonavir in antiretroviral-experienced patients in the UK, France, Italy and Spain. Clin Drug Investig 2007;27:807-17
- Moeremans K, Annemans L, Lothgren M, et al. Cost effectiveness of darunavir/ritonavir 600/100mg bid in protease Inhibitor-experienced, HIV-1-infected adults in Belgium, Italy, Sweden and the UK. Pharmacoeconomics 2010;28(1 Suppl):107-28
- Moeremans K, Hemmett L, Hjelmgren J, et al. Cost effectiveness of darunavir/ritonavir 600/100 mg bid in treatment-experienced, lopinavir-naive, protease inhibitor-resistant, HIV-infected adults in Belgium, Italy, Sweden and the UK. Pharmacoeconomics 2010;28(1 Suppl):147-67
- Gazzard B, Hill A, Anceau A. Cost-efficacy analysis of the MONET trial using UK antiretroviral drug prices. Appl Health Econ Health Policy 2011;9:217-23
Appendix
A previously published Markov model was updated to reflect current treatment guidelines and supplemented with two health states specifying the myocardial infarction events predicted and the deaths expected from heart disease based on the Framingham CHD risk equation. This three stage model uses the patient distribution by CD4+ T-cell count, viral load (VL, undetectable equals suppression below 400 copies/ml), and total cholesterol (TC) levels at baseline and 48 weeks for each regimen based on published clinical trial data.
The Markov model used to capture the treatment-modified disease progression of HIV/AIDS patients on HAART therapy consists of three linked Markov processes based upon the assumption that all HIV/AIDS patients eventually fail a specific HAART therapy and are required to switch to a new therapy. Patients are assumed to move from one stage of the model to another as they fail therapy. The maximum number of effective regimens in the model is three, but some patients are assumed to die before they experience all three regimens. Cause of death can be from either and AIDS event or a CHD event. Based on their clinical, virologic, and immunologic parameters at baseline, patients enter the model as antiretroviral-naive patients in one of the 12 health states in Stage 1. Progression through the 12 health states and into the death states is based on 48-week results of the clinical trials for the two regimens for the first four model cycles. After this time patients progress at the same rate for each of the two regimens. This progression is effected by a transition matrix which is specific for each model stage. Transition parameters for ART-naïve and experienced patients are provided in the tables below.
Viral Suppression, or Death by Health State for ARV-naïve Patients Over a Three Month Model Cycle.
Viral Suppression, or Death by Health State for ARV-Experienced Patients Over a Three Month Model Cycle.
Patients who fail an ART treatment (defined as entering a health state with a CD4+ T-cell count below 350 cells/ml and a detectable viral load after 48 weeks) enter Stage 2 (subsequent HAART therapy) to capture a switch to a second HAART regimen. Patients enter Stage 3 (salvage therapy) of the Markov process to reflect a switch to a third HAART regimen following subsequent treatment. Thus, patients move to each subsequent stage of the model based upon their health state and respective CD4 cell counts and viral load. The transitions that capture the changes in CD4+ T-cell counts and viral load after 48 weeks in Stage 1 were estimated from the records of ARV-naïve patients in several epidemiological data sources, thus it captures the mean rate of disease progression for ART-naïve patients. The transition matrices used in the model stages 2 and 3 were derived from epidemiological data from HAART-experienced patients.
Patients can move out of a specific health state after each 3-month time period or “cycle” within a health state. The model considers lifetime treatment history and models the patients’ disease progression until 90% of patients in each treatment arm are in the death state.
The costs of ARV therapies in Stage 2 and Stage 3 are based on typical treatment patterns, rather than specific drug therapies or combinations. Costs and outcomes are discounted for the calculation of the incremental cost effectiveness and cost utility ratios. The perspective of the analysis is that of the health care system and does not include indirect costs in the model cost estimates.
In the model, a health state-specific quality of life weight is assigned to each survival period based on HIV-patient responses to the visual analog scale in the EQ5D quality of life instrument. This recorded value was transformed to utility weights using the regression equation developed by Dolan. The values used to predict long-term quality-adjusted survival were derived from the pooled analysis of 21,000 responses to the EQ5D instrument by patients in antiretroviral clinical trials who also had a measured CD4+ T-cell count and a viral load measure within 14 days of the recorded EQ5D response. Thus, the utility weights are specific for each CD4+ T-cell count and viral load-defined health state.
Information in this document is copy-righted and may not be used without written permission by the first author.