Abstract
Background:
A recent open-label, parallel group trial showed that liraglutide is superior to sitagliptin for reduction of HbA1c, and is well tolerated with minimum risk of hypoglycemia. Although these findings support the use of liraglutide as an effective GLP-1 agent to add to metformin, the value of liraglutide needs to be quantified in the framework of a cost-effectiveness (CE) analysis in a US setting.
Objective:
This current study sets out to assess the long-term cost-effectiveness outcomes of liraglutide vs sitagliptin based on treatment effects data from the 1860-LIRA-DPP-4 52-week trial.
Methods:
The IMS CORE Diabetes Model (CDM), a non-product-specific, validated computer simulation model that projects the long-term outcomes related to interventions for type 2 diabetes, is used for simulation of these interventions. In the model, patients were treated initially on one of the three treatment options: liraglutide 1.2 mg daily, 1.8 mg daily, or sitagliptin 100 mg daily, each used as add-on therapy to metformin for 5 years. After 5 years all patients switched to basal insulin treatment for the remainder of the simulation (35-year time horizon overall). Incremental cost-effectiveness ratios (ICERs) were generated for liraglutide 1.2 mg compared with sitagliptin and liraglutide 1.8 mg compared with sitagliptin. Transition probabilities, health state utility values, and complication costs were obtained from published sources. All outcomes were discounted at 3% per annum, and the analysis was conducted from the perspective of a third-party payer in the US. Sensitivity analyses were performed to test robustness of the base case scenario.
Results:
For liraglutide 1.8 mg vs sitagliptin, the ICER was $37,234 per QALY gained, while for liraglutide 1.2 mg vs sitagliptin, the ICER was $25,742 per QALY gained. In all sensitivity analyses, including setting the change in HbA1c to the lower limits of the 95% confidence intervals, the ICERs remained below US$ 50,000/QALY, a commonly accepted threshold in the US, except for the shortest time horizon of 10 years.
Conclusions:
The availability of liraglutide 1.2 mg and 1.8 mg with improved efficacy profiles over sitagliptin could improve patient care, with the incremental cost effectiveness ratio below $50,000 per QALY gained as add-on to metformin.
Introduction
Diabetes incidence continues to increase and remains an urgent healthcare issue in the US. It is estimated that, in 2011, 25.8 million children and adults (8.3% of the US population) had diabetesCitation1. The most current cost estimates from the American Diabetes Association (ADA 2011) and the Centers for Disease Control and Prevention (CDC) place the total costs for diagnosed diabetes at $174 billion, which includes $58 billion for indirect costs such as lost productivity and premature mortalityCitation1,Citation2.
Of the pharmacologic options available for patients with type 2 diabetes, metformin (MET) and sulfonylureas (SU) are commonly used in early treatment. In addition, before transitioning to intensive insulin therapy, thiazolidinediones (TZDs) have been available as first- or second-line treatments, either as monotherapy or in combination with other medications. However, the safety issues now associated with a once-promising TZD, rosiglitazone, has led to a substantial decline in its utilization. In response to the growing demand for more efficacious, early treatment options with fewer adverse events, incretin therapies such as glucagon-like peptide-1 (GLP-1) receptor agonists (exenatide and liraglutide) and dipeptidyl peptidase-4 (DPP-4) inhibitors (linagliptin, saxagliptin, and sitagliptin) were recently added to the diabetes treatment armamentarium.
Exenatide, the first of the GLP-1 agonists, received US FDA approval in 2005 and was followed by the next GLP-1 agonist, liraglutide, in 2010Citation3. Sitagliptin, the first of the DPP-4 inhibitors, was approved for US marketing in 2006Citation4 followed by saxagliptin (2009)Citation5, and most recently linagliptin (2011)Citation6. Generally, GLP-1 agonists and DPP-4 inhibitors improve glycemic control, enhance β-cell responsiveness, improve dyslipidemia, and reduce the overall risk of hypoglycemia when compared with more traditional type 2 diabetes treatments including insulin and SUs. GLP-1 agonists have also been shown to reduce body weight in the majority of patients, a key factor when accounting for the direct link between type 2 diabetes, cardiovascular disease, and body weightCitation7–9.
Country-specific and professional guidelines have been adaptable to the addition of these classes of pharmacological agents. As such, the latest published diabetes treatment algorithm places TZDs or GLP-1 s as tier 2, subsequent to lifestyle + MET, followed by insulin + SUs as a tier 1 recommendation. The key factor in the listing of the GLP-1 agonists as a possible tier 2 intervention is that they have the advantage of weight loss which DPP-4 inhibitors do not. Rather, DPP-4 inhibitors are listed as being “weight neutral” in the algorithmCitation10.
The 1860-LIRA-DPP-4 trial was of a randomized, parallel-group, and open-label design, and reported the efficacy and safety of once-daily liraglutide 1.8 mg, liraglutide 1.2 mg, and sitagliptin 100 mg over 52 weeks. One of the findings of 52-week follow-up data was that the proportion of patients reaching glycosylated hemoglobin (HbA1c) levels less than 7.0% without weight gain or documented hypoglycemia was significantly higher in patients receiving liraglutide 1.8 mg (49.9%), compared to patients receiving liraglutide 1.2 mg (38.9%) and sitagliptin 100 mg (18.6%)Citation11. The findings of the 1860-LIRA-DPP-4 trial support the suggestion that liraglutide has a more favorable impact on glycemic control without weight gain or documented hypoglycemia compared to DPP-4 inhibitors.
As a result of the increased economic toll of diabetes and the contemporary availability of GLP-1 agonists and DPP-4 inhibitors, there is a need to predict the long-term clinical benefits and subsequent cost implications of GLP-1 agonists and DPP-4 inhibitors. This current study sets out to assess the long-term cost-effectiveness of liraglutide vs sitagliptin based on 52-week treatment effects data from the 1860-LIRA-DPP-4 trial and a published and validated mathematical model of diabetes and its complications. A mathematical simulation approach is one way to use the available clinical data in order to estimate the potential long-term clinical and economic consequences (outcomes) of modern therapies and facilitate decision-making today. This approach is critically important to inform the decision-making of patients, practitioners, and reimbursement authorities for optimal care where patients may take treatment over a lifetime but are seldom tracked in long-term clinical studies.
Patients and methods
To meet the study objectives, we used the IMS CORE Diabetes Model (CDM), a non-product-specific computer simulation model that projects the long-term clinical and cost outcomes related to interventions for both type 1 diabetes and type 2 diabetes cohorts. The descriptions of the IMS CDM, including its structure and validation, have been documented previouslyCitation12,Citation13. It has been widely applied to conduct cost-effectiveness or cost utility analyses in various country settings and, most importantly, health technology authorities such as the National Institute for Health and Clinical Excellence (NICE) in the UK have reviewed and accepted the economic analyses performed using the IMS CDM.
In the IMS CDM, a series of 17 interdependent Markov sub-models simulate the clinical progression of diabetes complications over time, including major micro- and macrovascular complications such as cardiovascular, renal, diabetic foot and neuropathy, and eye disease. The model also incorporates long-term HbA1c progression, treatment algorithms (e.g., subsequent lines of therapy), and also capture treatment-specific clinical features beyond their effects on traditional diabetes and cardiovascular risk factors. Additional events include hypoglycemia, ketoacidosis, lactic acidosis, and non-specific mortality. Data that inform transition probabilities and appropriate risk adjustments are derived from various sources including the Framingham Heart Study, the UK Prospective Diabetes Study (UKPDSCitation14,Citation15), and the Diabetes Control and Complications TrialCitation16.
Health state utility values for disease and treatment-related outcomes are incorporated for the calculation of quality-adjusted life-years (QALYs) in the IMS CDMCitation16. Additionally, the IMS CDM captures the impact of disutility attributable to body mass index (BMI) values in the overweight range (> 25 kg/m2), based on data from the CODE-2 studyCitation17. Models that inform long-term glycohemoglobin (HbA1c) and systolic blood pressure (SBP) progression are derived from the UKPDS Outcomes Model, and data from the Framingham Heart Study are used to model long-term lipid and triglyceride progressionCitation14,Citation18.
Cohort, clinical, and treatment effect inputs
All patient baseline characteristics, shown in , for the simulation cohort, were derived from the 1860-LIRA-DPP-4 trial. Average age was 55.3 years, with males constituting a little more than half of the population. Mean BMI was 32.8 kg/m2 and mean HbA1c level was 8.4%. The patients’ average duration of diagnosed diabetes was 6.0 years.
Table 1. Patients’ baseline characteristics.
Treatment effects applied in the model () included absolute change from baseline in HbA1c, SBP, total cholesterol (T-Chol), low-density lipids (LDL), high-density lipids (HDL), triglycerides (TRIG), and weight/body mass index (BMI), as well as rates of major and minor hypoglycemic events. Two treatment and comparator pairs of regimens were analyzed: liraglutide 1.2 mg vs sitagliptin and liraglutide 1.8 mg vs sitagliptin. In the simulations, it was assumed that patients remained on their initial assignment for 5 years and that in year 6 of the simulation they switched to a basal insulin treatment, discontinuing initially assigned liraglutide or sitagliptin therapy, but continuing with concomitant metformin therapy.
Table 2. Treatment effects relative to baseline.
Following the treatment effects applied in year 1 of the long-term simulation, physiological parameters were assumed to progress in line with data from the UKPDS Outcomes Model for HbA1c and SBP and the Framingham Heart Study for lipids and triglycerides. It was assumed that BMI did not increase or decrease over the course of the simulation.
Analysis perspective and costs
The US payer perspective was assumed for this analysis; direct medical costs related to drugs, self-monitoring blood glucose (SMBG), needles, treatment/management, and associated complications were included. Costs attributable to treatment and management of diabetes-related complications were derived from published sources; these costs were inflated to 2011 US dollars using the Medical Care Consumer IndexCitation19. Drug acquisition costs were based on wholesale acquisition costs (WAC) obtained from Medi-Span®. provides assumptions used for calculating annual costs for liraglutide and sitagliptin, as well as injection needles for liraglutide and SMBG for treatment with basal insulin after year 5 of the simulation. The cost of SMBG, including lancets and strips, was applied for patients once they switched to insulin therapy, and assuming the utilization of three strips per dayCitation20. A 3% annual discount rate for costs and health outcomes was used in the base case analysis, and the base case simulations were performed over a 35-year time horizon.
Table 3. Drug prices (WAC).
Cost-effectiveness analysis
Non-parametric bootstrapping was used to calculate the mean and standard deviation of costs, life expectancy, and QALYs. This approach generates mean costs and clinical outcomes over 1000 bootstrap samples, with each bootstrap sample containing 1000 randomly generated patientsCitation21.
Sensitivity analyses
Robustness of the base case analysis was tested by several one-way sensitivity analyses, varying key base case inputs. Most importantly, additional simulations were performed with HbA1c end-of-study values for liraglutide at the upper and lower limits of the 95% confidence interval. In addition, time horizons were varied from 35 years to 10, 20, and 30 years, and the discount rate for cost and outcomes was modified from 3% to 0 or 6%. Finally, a sensitivity analysis was performed where patient baseline characteristics and treatment effects for liraglutide and sitagliptin were sampled from distributions with replacement, reflecting the intra-patient variability in parameters such as baseline and end-of-study HbA1c. This probabilistic sensitivity analysis (PSA) also incorporated sampling from the standard errors of the regression coefficients from the UKPDS Risk Engines for stroke and MI, and the costs of diabetes complications in the PSA were varied within a range of 20% from the mean values.
Results
Liraglutide 1.8 mg and 1.2 mg vs sitagliptin: Life expectancy, quality-adjusted life expectancy, and cost-effectiveness
Projections of costs and outcomes made over a 35-year time horizon indicated that liraglutide was associated with improvements in life expectancy and quality-adjusted life expectancy compared to sitagliptin. On an undiscounted basis, the improvements in life expectancy were projected to be 0.619 years for liraglutide 1.8 mg and 0.291 years for liraglutide 1.2 mg compared to sitagliptin (18.273 ± 0.304 (1.8 mg) and 17.945 ± 0.293 (1.2 mg) vs 17.654 ± 0.279 for sitagliptin). The improvements in discounted life expectancy were projected to be 0.348 years for liraglutide 1.8 mg and 0.163 years for liraglutide 1.2 mg compared to sitagliptin (13.189 ± 0.183 and 13.003 ±0.174 years vs 12.840 ± 0.169 years; ). When health-related quality-of-life was incorporated in the analysis, in the form of health state utilities and event disutilities, the improvements in quality-adjusted life expectancy for liraglutide 1.8 mg and liraglutide 1.2 mg vs sitagliptin were projected to be 0.356 and 0.201 quality-adjusted life years, respectively (QALYs; 8.979 ± 0.122 and 8.825 ± 0.117 QALYs vs 8.624 ±0.115 QALYs).
Table 4. Base case cost-effectiveness results.
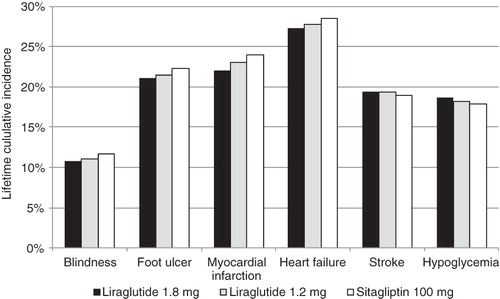
Over the 35-year time horizon, the cumulative incidences of blindness, end-stage renal disease, foot ulcers, and coronary heart disease and heart failure events were projected to be lower in patients initially assigned to liraglutide 1.8 mg or liraglutide 1.2 mg compared to those initially assigned to sitagliptin (). However, the cumulative incidence of stroke was projected to be higher in patients initially assigned to liraglutide, which may be a consequence of increased life expectancy due to fewer coronary heart disease events and their associated mortality.
Figure 1. 35-year cumulative incidence of diabetes complications.
The use of liraglutide was associated with increases in lifetime direct medical costs of $13,241 per patient for the 1.8 mg dosage and $5182 per patient for the 1.2 mg dosage from a third-party payer perspective vs sitagliptin ($89,502 ± 1179 and $81,444 ± 1079 per patient vs $76,262 ± 1061 per patient). Increased lifetime treatment costs of $13,702 per patient for liraglutide 1.8 mg and $5533 per patient for liraglutide 1.2 mg, including concomitant anti-hyperglycemic medications, needles, and glucose test strips, were partly offset by reduced lifetime complications costs vs sitagliptin of $909 per patient for liraglutide 1.8 mg and $545 per patient for liraglutide 1.2 mg. In the base case cost-effectiveness analysis, the ICER for liraglutide 1.8 mg vs sitagliptin was $37,234 per QALY gained, and the ICER for liraglutide 1.2 mg vs sitagliptin was $25,742 per QALY gained. At both dosages, liraglutide could be considered cost-effective compared to sitagliptin, assuming a willingness-to-pay threshold of $50,000 per QALY gained in the US setting from the perspective of a third-party payer.
Sensitivity analyses
A series of sensitivity analyses indicated that liraglutide would be cost-effective at both 1.8 mg and 1.2 mg dosages compared to sitagliptin over a range of plausible input parameters ( and ). In both cases, cost-effectiveness results were most sensitive to the time horizon of the simulations; when a 10-year time horizon was used the ICER was $114,209 per QALY gained for liraglutide 1.8 mg and $66,766 per QALY gained for liraglutide 1.2 mg (vs $37,234 and $25,742 per QALY gained in each respective base case analysis). Within the first decade of the simulation, the cumulative incidence of most diabetes complications, including end-stage renal disease and heart failure, was less than 10% in all treatment arms (data not shown). Changes to other input parameters, including the use of the upper and lower limits of the 95% confidence intervals for change in HbA1c from baseline for liraglutide, and changes to discount rates, had no material impact on cost-effectiveness conclusions; ICERs for liraglutide 1.8 mg ranged from $26,858 per QALY gained to $51,623 per QALY gained, and ICERs for liraglutide 1.2 mg ranged from $19,060 per QALY gained to $34,839 per QALY gained. When disutility attributable to patient BMI above 25 kg/m2 was excluded from the analysis, the ICER increased to $42,084 per QALY gained for liraglutide 1.8 mg (vs $37,234 in the base case), and increased to $33,199 per QALY gained for liraglutide 1.2 mg (vs $25,742 in the base case).
Table 5. Sensitivity analysis: Liraglutide 1.8 mg vs Sitagliptin.
Table 6. Sensitivity analysis: Liraglutide 1.2 mg vs Sitagliptin.
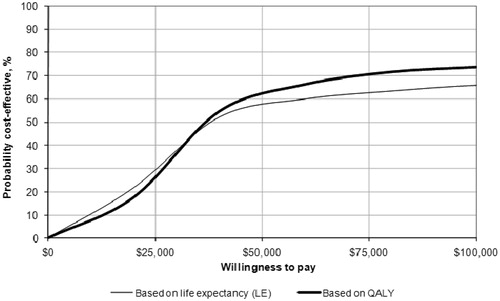
When probabilistic sensitivity analysis was conducted, incorporating both uncertainty and variability around the input parameters, the ICER for liraglutide 1.8 mg vs sitagliptin was $42,883 per QALY gained (vs $37,234 in the base case), and the ICER for liraglutide 1.2 mg vs sitagliptin was $35,386 per QALY gained (vs $25,742 in the base case). Cost-effectiveness acceptability curves indicated that at a willingness-to-pay threshold of $50,000 per QALY gained, liraglutide 1.8 mg had a 57.9% likelihood of being considered cost-effective and liraglutide 1.2 mg had a 60.5% likelihood of being considered cost-effective compared to sitagliptin ( and ).
Figure 2. Cost-effectiveness acceptability curve for liraglutide 1.8 mg vs sitagliptin.
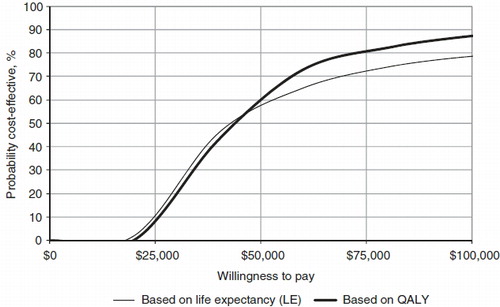
Figure 3. Cost-effectiveness acceptability curve for liraglutide 1.2 mg vs sitagliptin.
Discussion
The 1860-LIRA-DPP-4 trial has established the superior efficacy of liraglutide 1.8 mg and liraglutide 1.2 mg over sitagliptin. While the findings of randomized clinical trials such as 1860-LIRA-DPP-4 represent a high level of evidence and are essential for the demonstration of safety and efficacy of competing agents, they generally cannot provide information regarding long-term clinical and economic outcomes, due to both financial and logistical constraints and the need for up-to-date medical information. In this analysis, disease modeling, using a published and validated diabetes model has provided some insight for decision-makers as to the possible long-term clinical events, and the resultant economic outcomes, subsequent to initiation of either liraglutide or sitagliptin therapies in a cohort of patients representative of a US diabetes patient population. The present economic analysis has indicated that liraglutide may be cost-effective compared to sitagliptin for the treatment of type 2 diabetes mellitus in patients who have failed metformin monotherapy from a US third-party payer perspective.
Conclusions should not be drawn from modeling analyses without adequate exploration of the uncertainty inherent to the decision problem. Extensive sensitivity analyses were performed in the present study to assess the impact of changing key inputs on cost-effectiveness results; both a series of one-way sensitivity analycses and a probabilistic sensitivity analysis were performed. One-way sensitivity analyses indicated that cost-effectiveness results were most sensitive to the time horizon used for the analysis: Ten-year projections resulted in ICERs greater than $50,000 per QALY gained. However, this time horizon would certainly fail to capture the long-term treatment-related differences in lifetime complications between the liraglutide and sitagliptin treatment arms of the model. Survival curves for the sensitivity analyses where a 10-year time horizon was used indicated that ∼80% of the simulated patients were still alive after 10 years (data not shown), suggesting that a number of late complications may not have developed. This study examined two treatment options utilized early in the type 2 diabetes treatment algorithm, as add-on to metformin, where the use of a 10-year time horizon could be considered inappropriate. The UKPDS and DCCT trials have indicated that the benefit of early glycemic control on diabetes complications may persist longer-term, including the period after which patients initially assigned to conventional therapy were offered intensive therapyCitation22,Citation23. Following the application of end-of-study HbA1c values from the 1860-LIRA-DPP-4 trial in the IMS CDM, representing the short-term treatment effects of each intervention, the implementation of equation 11 from the UKPDS Outcomes Model resulted in differences in HbA1c that persisted long-term (data not shown).
In all other sensitivity analyses, the ICERs remained below $50,000 per QALY gained, and, when the changes in HbA1c from baseline were set to the upper limits of the 95% confidence intervals for liraglutide 1.8 mg and 1.2 mg, the ICERs significantly improved. One consideration is warranted when interpreting the base case and sensitivity results; although the simulation assumes that both cohorts switch to an insulin treatment after year 5, those whose HbA1c levels are relatively well-controlled may stay longer on the initial treatment and transition to an insulin treatment later than those whose HbA1c levels are not well-controlled. In that regard, there might be a differential between the two cohorts in their transition time to an insulin treatment. It is also noteworthy that, given that the elimination of the impact of disutility attributable to BMI values in the overweight range (>25 kg/m2) from the analysis raised the ICERs, there should be overweight sub-groups where liraglutide is even more cost-effective compared to sitagliptin.
While the one-way sensitivity analyses were useful for identifying the contribution of an individual parameter or set of related input parameters to the cost-effectiveness results, they did not capture all of the uncertainty relevant to the decision problem. Hence, a probabilistic approach was also taken. The cost-effectiveness results that incorporated all available parameter uncertainty indicated that liraglutide would remain cost-effective vs sitagliptin, albeit with ICERs that were up to 30% higher than the base case due to the non-linear relationship between HbA1c and life expectancy in diabetes patientsCitation24, restricting the time available for the treatment effects for liraglutide to exert their influence on complications that largely impact costs and health-related quality-of-life but not life expectancy. One limitation of the probabilistic sensitivity analysis was the lack of covariance between input parameters; parameters were sampled independently for each bootstrap iteration. The IMS CDM derives data from a range of clinical trials and epidemiological studies, relying on event rates reported in publications, mean relative risks that describe the impact of a physiological parameter or medical intervention on an event rate, and multivariate regression formulae that incorporate several related input parameters to predict the 5 - or 10-year risk of a cardiovascular event. The application of covariance matrices where data are available may improve the probabilistic sensitivity analysis.
The findings of the present study, that liraglutide 1.8 mg and liraglutide 1.2 mg could be considered cost-effective compared to sitagliptin, should be compared with the findings of recent cost-effectiveness analyses performed in the US setting. A recent studyCitation25 indicated that the ICER for liraglutide 1.8 mg compared with exenatide was $40,202 per QALY gained, based on the Liraglutide Effect and Action in Diabetes 6 (LEAD 6) trial.
The 1860-LIRA-DPP-4 52-week trial comparing liraglutide vs sitagliptin included a patient satisfaction questionnaire, the Diabetes Treatment Satisfaction Questionnaire, which has been used extensively in clinical trials and in routine clinical monitoring. Treatment satisfaction was significantly higher with liraglutide 1.8 mg than with sitagliptin between weeks 0 and 52, suggesting that superior efficacy of liraglutide on several parameters outweighed the difference between an injectable and an oral therapyCitation11. For selecting optimal care, it has been increasingly recognized that patient preference plays an important role. When a set of attributes of a product is preferred by patients when compared to another product, it is more likely that patients will adhere better to the preferred product, thereby affecting long-term clinical outcomes. It is the collection of attributes that patients consider when opting for a preferred treatment rather than a single attribute. A recent study reporting the results of a time trade-off surveyCitation26 indicated that 96% of respondents preferred liraglutide to exenatide when presented with a selection of attributes including efficacy, nausea, hypoglycemia, and dosing schedule. In this exercise, their preference was largely based on superior efficacy and less nausea rather than dosing schedule alone.
Although these results may suggest that the greater clinical benefits of liraglutide might outweigh any potential injection barriers to the patient, potential patient barriers to the use of injectable medications were not captured in the present analysis and patient preference and satisfaction, as evidenced by these results, are not incorporated in our cost-effectiveness analysis. As such, it would be important to include any qualitative evidence for a comprehensive appraisal that cannot be completely encapsulated in the form of a cost-effectiveness ratio.
Study limitations
Several potential limitations to this study may be important to consider: (1) the simplified treatment algorithm assuming the switch to insulin after year 5 of the simulation for all treatments, which takes a conservative perspective to estimating costs and outcomes for liraglutide and most likely biases health outcomes in favor of sitagliptin; (2) the cost of regimens were estimated based on the wholesale acquisition costs, not on the average cost per patient. (3) Dose reductions for insulin were not captured, and it was assumed for patients taking insulin after year 5 of the simulation that the cost of SMBG could be based on the maximum allowed frequency for insulin users; these costs were not adjusted for the likely deviation from the defined daily dose that may occur in clinical practice. Given the fixed period of time (5 years) on initial liraglutide or sitagliptin treatment, such assumptions are unlikely to have significant impact on the ICERs. However, if a difference in the time on treatments were assumed, likely due to failure of glycemic control at different time points for liraglutide and sitagliptin, differences in cost assumptions related to subsequent insulin therapy could be important for overall cost-effectiveness conclusions. (4) Although safety and efficacy data were applied from a 52-week trial, the model’s epidemiological data were derived from time periods when DPP-4 inhibitors and GLP-1 analogs were unavailable. A final limitation of the modeling analysis was that long-term safety data for GLP-1 agonists and DPP-4 inhibitors were not available and were thus not applied in the modeling analysis; the only treatment-related adverse event captured in the simulation was hypoglycemia. Although patients in the simulation were assumed to switch to insulin therapy after 5 years of initial liraglutide or sitagliptin therapy, data relating to non-hypoglycemia-related adverse events such as thyroid malignancy or pancreatitis were unavailable for the 5 years of liraglutide or sitagliptin therapy. The 1860-LIRA-DPP-4 52-week trial did not report any statistically significant difference in non-hypoglycemia-related adverse events between liraglutide and sitagliptin, however one patient randomized to liraglutide had an event of ‘non-acute’ pancreatitis and was withdrawn from the trial; the event was judged as mild and possibly related to the trial drug by the investigatorCitation11. However, ongoing long-term safety studies like the Liraglutide Effect and Action in Diabetes: Evaluation of Cardiovascular Outcomes Results trial will provide additional evidence within this areaCitation27,Citation28.
Conclusions
Despite these limitations, there is sufficient evidence that liraglutide 1.2 mg and 1.8 mg, with improved efficacy profiles over sitagliptin, could improve patient care while being cost-effective treatments in type 2 diabetes patients in the US setting.
Transparency
Declaration of funding
This study was financially supported by Novo Nordisk Inc, Princeton, New Jersey, USA.
Declaration of financial/other interests
WCL, YS, and JLP have disclosed that they are employees of IMS Consulting group, a company hired to conduct this study. IMS Consulting Group was responsible for all data analysis and for assisting with the preparation of abstracts and posters related to the study. JL has disclosed that he is an employee of Novo Nordisk.
Related Research Data
References
- Diabetes Statistics. American Diabetes Association 2012. Available at http://www.diabetes.org/diabetes-basics/diabetes-statistics. [Accessed 15 December 2011]
- National Diabetes Fact Sheet. Centers for Disease Control and Prevention 2012. http://www.cdc.gov/diabetes/pubs/pdf/ndfs_2011.pdf [cited 2011 Dec 15];
- Byetta Press Release. US Food and Drug Administration 2012. [cited 2011 Dec 15];
- Januvia Press Release. US Food and Drug Administration 2012. Available at http://www.fda.gov/NewsEvents/Newsroom/PressAnnouncements/2006/ucm108770.htm. [Accessed 15 December 2011]
- Onglyza Press Release. US Food and Drug Administration 2012. Available at http://www.fda.gov/newsevents/newsroom/pressannouncements/ucm174780.htm. [Accessed 15 December 2011]
- Linagliptin Press-Release. Boehringer Ingelheim 2012. Available at http://www.boehringer-ingelheim.com/news/news_releases/press_releases/2011/03_may_2011_diabetes.html. [Accessed 15 December 2011]
- Campbell RK. Clarifying the role of incretin-based therapies in the treatment of type 2 diabetes mellitus. Clin Ther 2011;33:511-27
- Davidson JA. Incorporating incretin-based therapies into clinical practice: differences between glucagon-like Peptide 1 receptor agonists and dipeptidyl peptidase 4 inhibitors. Mayo Clin Proc 2010;85(12 Suppl):S27-S37
- Verspohl EJ. Novel therapeutics for type 2 diabetes: incretin hormone mimetics (glucagon-like peptide-1 receptor agonists) and dipeptidyl peptidase-4 inhibitors. Pharmacol Ther 2009;124:113-38
- Nathan DM, Buse JB, Davidson MB, et al. Medical management of hyperglycemia in type 2 diabetes: a consensus algorithm for the initiation and adjustment of therapy: a consensus statement of the American Diabetes Association and the European Association for the Study of Diabetes. Diabetes Care 2009;32:193-203
- Pratley R, Nauck M, Bailey T, et al. One year of liraglutide treatment offers sustained and more effective glycaemic control and weight reduction compared with sitagliptin, both in combination with metformin, in patients with type 2 diabetes: a randomised, parallel-group, open-label trial. Int J Clin Pract 2011;65:397-407
- Clarke PM, Gray AM, Briggs A, et al. A model to estimate the lifetime health outcomes of patients with type 2 diabetes: the United Kingdom Prospective Diabetes Study (UKPDS) Outcomes Model (UKPDS no. 68). Diabetologia 2004;47:1747-59
- Palmer AJ, Roze S, Valentine WJ, et al. Validation of the CORE Diabetes Model against epidemiological and clinical studies. Curr Med Res Opin 2004;20(1 Suppl):S27-S40
- Palmer AJ, Roze S, Valentine WJ, et al. The CORE Diabetes Model: projecting long-term clinical outcomes, costs and cost-effectiveness of interventions in diabetes mellitus (types 1 and 2) to support clinical and reimbursement decision-making. Curr Med Res Opin 2004;20(1 Suppl):S5-26
- UK Prospective Diabetes Study (UKPDS) Group. Intensive blood-glucose control with sulphonylureas or insulin compared with conventional treatment and risk of complications in patients with type 2 diabetes (UKPDS 33). Lancet 1998;352:837-53
- The Diabetes Control and Complications Trial Research Group. The effect of intensive treatment of diabetes on the development and progression of long-term complications in insulin-dependent diabetes mellitus. N Engl J Med 1993;329:977-86
- Bagust A, Beale S. Modelling EuroQol health-related utility values for diabetic complications from CODE-2 data. Health Econ 2005;14:217-30
- D’Agostino RB, Russell MW, Huse DM, et al. Primary and subsequent coronary risk appraisal: new results from the Framingham study. Am Heart J 2000;139:272-81
- Consumer Price Index. United States Department of Labor Bureau of Labor Statistics 2012 February 2A. Available at http://www.bls.gov/cpi/home.htm. [Accessed 4 December 2011]
- Lee WC, Conner C, Hammer M. Cost-effectiveness of liraglutide versus rosiglitazone, both in combination with glimepiride in treatment of type 2 diabetes in the US. Curr Med Res Opin 2011;27:897-906
- Briggs AH, Wonderling DE, Mooney CZ. Pulling cost-effectiveness analysis up by its bootstraps: a non-parametric approach to confidence interval estimation. Health Econ 1997;6:327-40
- Nathan DM, Cleary PA, Backlund JY, et al. Intensive diabetes treatment and cardiovascular disease in patients with type 1 diabetes. N Engl J Med 2005;353:2643-53
- Holman RR, Paul SK, Bethel MA, et al. 10-year follow-up of intensive glucose control in type 2 diabetes. N Engl J Med 2008;359:1577-89
- Currie CJ, Peters JR, Tynan A, et al. Survival as a function of HbA(1c) in people with type 2 diabetes: a retrospective cohort study. Lancet 2010;375:481-9
- Lee WC, Conner C, Hammer M. Results of a model analysis of the cost-effectiveness of liraglutide versus exenatide added to metformin, glimepiride, or both for the treatment of type 2 diabetes in the United States. Clin Ther 2010;32:1756-67
- Polster M, Zanutto E, McDonald S, et al. A comparison of preferences for two GLP-1 products–liraglutide and exenatide–for the treatment of type 2 diabetes. J Med Econ 2010;13:655-61
- Bergenstal RM, Daniels G, Mann J, et al. Liraglutide effect and action in diabetes: evaluation of cardiovascular outcome results (LEADER) trial: rationale and study design. Diabetes 2011;60(1 Suppl):A612-3
- Drucker DJ, Sherman SI, Bergenstal RM, et al. The safety of incretin-based therapies–review of the scientific evidence. J Clin Endocrinol Metab 2011;96:2027-31