Abstract
Objective:
Treatment patterns for the MS disease-modifying therapies (DMT) have changed over time. The objective of this study was to examine and describe treatment patterns in MS over a 10-year period.
Methods:
MS patients who filled a DMT prescription between January 1, 2001 and December 31, 2010 were identified from Clinformatics for DataMart affiliated with OptumInsight. Two cohorts were identified: those with a DMT prescription in 2003 and those with a DMT prescription in 2008. Treatment patterns were examined 2 years before and after the anchor prescriptions for each cohort.
Results:
Comparing treatment patterns prior to the two anchor prescriptions, interferon-beta (IFNβ)-1a IM (Avonex) and IFNβ-1b (Betaseron) gained the most users in 2001–2003, while IFNβ-1a IM and IFNβ-1a SC (Rebif) gained the most users from 2006–2008. In the 2 years following the two anchor prescriptions, treatment patterns changed. From 2003–2005, 21.2% of IFNβ-1a SC users and more than 15.0% of IFNβ-1a IM and IFNβ-1b users changed to another interferon or glatiramer acetate (GA; Copaxone), while 12.5% of GA users changed to an interferon, most often IFNβ-1a SC. From 2008–2010 the largest proportion of changes from each of the interferons and natalizumab (NZ; Tysabri) were to GA, while those switching from GA were most often changed to IFNβ-1a SC. Those with a 2008 anchor prescription for NZ were most often changed (57%) to GA.
Limitations:
In retrospective database analyses the presence of a claim for a filled prescription does not indicate that the drug was consumed, and reasons for changes in therapy are not available. The study design looking forward and backward from the anchor prescriptions may have contributed to differences in the proportion of patients seen with no observable change in DMT. Claims-based data are also constrained by coverage limitations that determine the data available and limit the generalizability of results to managed care patients.
Conclusions:
Changes in treatment patterns in the first half of the observation period were reflective of the addition of IFNβ-1a SC to the market in 2002. Following the 2003 and 2008 anchor prescriptions there were differences in treatment patterns, with more IFNβ-1a IM users being changed to IFNβ-1a SC after the 2003 anchor DMT, and more of each of the interferons and NZ being changed to GA following the 2008 anchor DMT. With the introduction of oral therapies for MS, treatment patterns will again be impacted.
Introduction
Multiple sclerosis (MS) is a central nervous system disorder with acute focal inflammatory demyelination and axonal lossCitation1. Relapsing remitting MS (RRMS) is the most common form of the disease and is characterized by disease exacerbations (new or worsening symptoms) and periods of remission. Approximately 400,000 individuals in the US have MS, with diagnosis typically occurring between 20–50 years of ageCitation2. MS occurs most frequently in females, and in CaucasiansCitation2.
Currently there is no cure for MS and treatment consists primarily of the use of disease-modifying therapies (DMTs) for reduction of relapses and slowing of disease progression in conjunction with symptomatic treatment and supportive careCitation3. The first DMT approved by the FDA for RRMS was interferon beta-1b for subcutaneous injection (IFNβ-1b; Betaseron, Bayer Healthcare Pharmaceuticals, Inc., Montville, NJ) in 1993 followed by intramuscular interferon beta-1a (IFNβ-1a IM; Avonex, Biogen Idec, Inc., Cambridge, MA) and glatiramer acetate injection (GA; Copaxone, Teva Pharmaceuticals USA, Inc., North Wales, PA) in 1996 and subcutaneous interferon-beta 1a (IFNβ-1a SC; Rebif, EMD Serono, Inc., Rockland, MA) in 2002. Natalizumab injection (NZ; Tysabri, Elan Pharmaceuticals, Inc., South San Francisco, CA) was first approved for treating relapsing forms of MS in 2004, removed from the market in 2005 due to a safety issue, and returned to the market in 2006. In 2009, a second IFNβ-1b (Extavia, Novartis AG, Novartis Pharmaceutical Corporation, East Hanover, NJ) was approved as a new brand. Fingolimod (FG; Gilenya, Novartis Pharmaceutical Corporation, East Hanover, NJ), the first oral therapy for MS, was approved for use in September 2010, and teriflunomide (TF; Aubagio, Genzyme Corporation, Cambridge, MA), a second oral therapy, was approved for use in September 2012. Neither oral agent was present in the data used for this treatment patterns analysis.
The National MS Society Consensus Statement recommends that treatment with an IFN or GA should be initiated as soon as possible following a diagnosis of RRMSCitation4. NZ is generally recommended for patients with an inadequate response or who are unable to tolerate other MS therapiesCitation3. There are currently no US clinical guidelines for the use of DMTs in MS. How patients are moved from one DMT to another and the changes in treatment patterns over time have not been well described since 2005. Reasons for changing or stopping DMTs most commonly include inadequate response to treatment, side-effects, and lack of tolerabilityCitation5–8.
Earlier studies that assessed DMT treatment patterns in MS include Reynolds et al.Citation9, who examined discontinuation or switches of DMT and healthcare resource utilization and related costs in an analysis of administrative claims data for new drug initiators from 1996–2005. The authors reported that patients who had used MS drugs previously were 2.5-times more likely to change treatments than patients with no prior use of MS drugs. In a second report from the same data designed to look at DMT adherence, Reynolds et al.Citation10 included 6134 MS patients initiating one of the IFNs or GA. Over time the proportion of patients who changed therapy increased and there were differences in the proportion of changes by DMT.
Using a more contemporary commercial managed care population from 2001–2007, Margolis et al.Citation11 reported on a retrospective cohort study of newly diagnosed MS patients. The most common index prescriptions in their analysis were for GA, IFNβ-1a IM, and IFNβ-1a SC, and of those who initiated an index prescription, 78.7% remained on their index therapy for the remainder of follow-up, while 21.3% switched to another DMT. No information was provided on therapy changes.
In an analysis of data from the National Ambulatory Medical Care Survey (NAMCS) examining outpatient prescribing patterns, Avasarala et al.Citation12 reported on MS treatment prescriptions from 1998–2003. This study did not examine changes in treatment, but rather looked at trends in MS treatment prescribing. Over the observation period there did not appear to be a significant change in the proportion of prescriptions for the commercially available MS drugs; however, the authors reported that the use of IFNβ-1a IM declined from 27% in 1998 to 11% in 2000, while use of GA and IFNβ-1b increased.
Two studiesCitation13,Citation14 examined treatment patterns in the North American Research Committee on Multiple Sclerosis (NARCOMS) registry database. Vollmer et al.Citation13 focused on differences between matched cohorts of veterans receiving care in the Veterans Health Administration (VHA) and non-veterans with MS in 2001. Lo et al.Citation14 conducted an analysis of NARCOMS data from November 2003 to February 2004 examining MS treatment patterns in veterans and non-veterans. Although neither study examined therapy changes or reasons for stopping therapy, they did examine prevalent treatment patterns for the various cohorts at a given point in time.
While the published literature on DMT treatment patterns includes several studies with large sample sizes prior to 2007, it does not reflect the changes in treatment patterns that have occurred in recent years. Specifically, NZ was reintroduced to the US market in 2006, and the impact of this new therapy on treatment patterns has not been described in the literature. The objective of this study is to describe and compare treatment patterns in MS over 10 years looking at 2 years either side of anchor prescriptions for DMT in 2003 and 2008.
Methods
Data source
The retrospective administrative patient claims data used in this study included medical claims, pharmacy claims, and patient eligibility information from United Health Group (UHG) as well as data from non-UHG plans. The individuals covered by these health plans, ∼32 million annual lives in 2010, are geographically diverse across the US, with greatest representation in the South and Midwest US census regions. The plans provide fully insured coverage for professional (e.g., physician), facility (e.g., hospital), and outpatient prescription medication services. Outpatient pharmacy claims provide National Drug Codes (NDC) for dispensed medications, quantity dispensed, drug strength, days supply, provider specialty code, and health plan and patient costs.
No identifiable protected health information was extracted or accessed during the course of the study. Pursuant to the Health Insurance Portability and Accountability Act, the use of de-identified data does not require Institutional Review Board approval or waiver of authorizationCitation15.
Patient identification
The study population was selected from commercial and Medicare health plan members with evidence of MS (a diagnostic code ICD-9 340. and a treatment with a marketed MS therapy) during the identification period of January 1, 2001 to December 31, 2010. Eligible patients had at least one filled prescription for a DMT (IFNβ-1a IM, IFNβ-1a SC, IFNβ-1b, GA, or NZ) and at least 24 months of insurance eligibility following the first MS treatment identified during the study period. Eligibility did not require patients to be newly diagnosed.
Patient demographic characteristics
Age and gender for the health plan enrollees with MS were captured from enrollment data. describes patient demographic characteristics for the overall study population.
Table 1. Patient demographic characteristics.
Treatment patterns cohorts
Two cohorts were identified to contrast treatment patterns for DMTs. The first cohort included patients who filled at least one DMT prescription in 2003 and their first DMT prescription was defined as the 2003 anchor prescription. The second cohort included patients who filled at least one DMT prescription in 2008; the first DMT prescription in 2008 was defined as the 2008 anchor prescription. For each cohort, the treatment patterns were examined in two time periods (see ):
Figure 1. Study period.
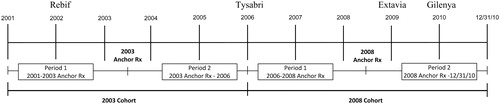
2003 Cohort:
Period 1: From 1/1/2001 to the patient’s 2003 anchor prescription.
Period 2: From the 2003 anchor prescription to 12/31/2005.
2008 Cohort:
Period 1: From 1/1/2006 to the patient’s 2008 anchor prescription.
Period 2: From the 2008 anchor prescription to 12/31/2010.
Analysis
DMT treatment changes before and after the 2003 and 2008 anchor prescriptions were analyzed descriptively. Combination therapy with DMTs in MS was observed less than 1% of the time. Therefore, when patients filled a new DMT prescription prior to completion of the anchor prescription it was treated as a therapy change and not as combination therapy.
Results
Sample characteristics
There were 8323 patients with an anchor DMT prescription in 2003; 18,910 patients had an anchor DMT prescription in 2008.
2003 Cohort
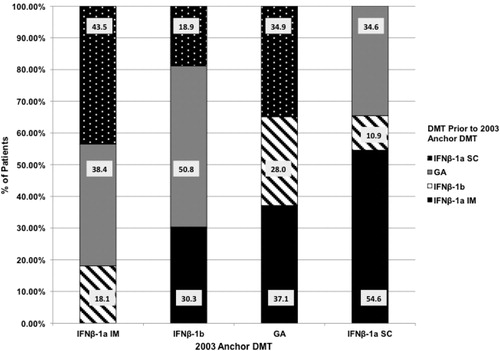
Of the 8323 patients with an anchor DMT prescription in 2003, 62.9% had no observable change in therapy between January 1, 2001, and the anchor DMT prescription in 2003. Of the 3088 patients who did experience a change in therapy in Period 1, shows the proportions of patients using another DMT in the 2001–2003 time frame before initiating therapy with a specific 2003 anchor DMT prescription.
Figure 2. DMT use prior to initiation of 2003 anchor prescription.
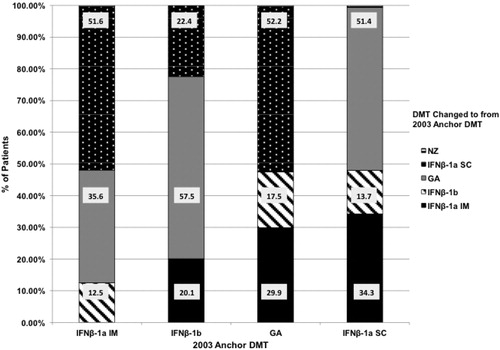
In Period 2, looking forward from the 2003 anchor prescription, 34.2% of the patients did not experience an observable change in DMT in the 2003–2005 time frame. presents the proportions of patients changing to each DMT in the 2003–2005 time frame from each 2003 anchor DMT prescription.
Figure 3. Changes in DMT following the 2003 anchor prescription.
IFNβ-1a IM
In Period 1, looking back from 2003 to January 2001, 12.1% of the 8323 patients changed to IFNβ-1a IM. Of these patients, 43.5% were previously on IFNβ-1a SC, 38.4% on GA, and 18.1% on IFNβ-1b. From 2003–2005 (Period 2), 16.9% with a 2003 anchor prescription for IFNβ-1a IM changed to a different DMT: 51.6% of patients changed to IFNβ-1a SC, 35.6% to GA, and 12.5% to IFNβ-1b.
IFNβ-1a SC
From 2001–2003 (Period 1), 7.8% of the 8323 patients changed to IFNβ-1a SC as their 2003 anchor prescription. Of these patients, 54.6% were previously on IFNβ-1a IM, 34.6% on GA, and 10.9% from IFNβ-1b. In Period 2, from 2003–2005, 21.2% of patients with a 2003 anchor prescription for IFNβ-1a SC changed to a different DMT. Of these patients, 51.4% changed to GA, 34.3% to IFNβ-1a IM, and 13.7% to IFNβ-1b.
IFNβ-1b
Of the 8323 patients, 9.4% changed to IFNβ-1b as their 2003 anchor DMT prescription during Period 1 (2001–2003). Of these patients, 50.8% were previously on GA, 30.3% on IFNβ-1a IM, and 18.9% on IFNβ-1a SC. Looking forward from 2003 (Period 2), 15.2% of patients with a 2003 anchor prescription for IFNβ-1b changed to a different DMT. Of these patients, 57.5% changed to GA, 22.4% changed to IFNβ-1a SC, and 20.1% changed to IFNβ-1a IM.
GA
During Period 1, from 2001–2003, 7.8% of the 8323 patients changed to GA as their 2003 anchor prescription: 37.1% were previously on IFNβ-1a IM, 34.9% on IFNβ-1a SC, and 28.0% on IFNβ-1b. In Period 2, 2003–2005, 12.5% of patients with a 2003 anchor prescription for GA changed to a different DMT. Of these patients, 52.2% changed to IFNβ-1a SC, 29.9% to IFNβ-1a IM, and 17.5% to IFNβ-1b.
2008 Cohort
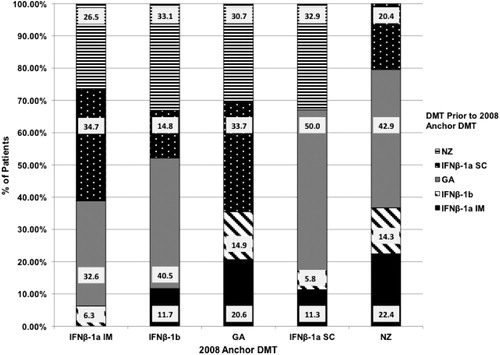
Of the 18,910 patients with an anchor DMT prescription in 2008, 46.7% had no observable change in therapy between January 1, 2006, and the anchor DMT prescription in 2008. Of the 10,079 patients who did experience a change in therapy in Period 1, shows the proportions of patients using another DMT in the 2006–2008 time frame before initiating therapy with a specific 2008 anchor DMT prescription.
Figure 4. DMT use prior to initiation of 2008 anchor prescription.
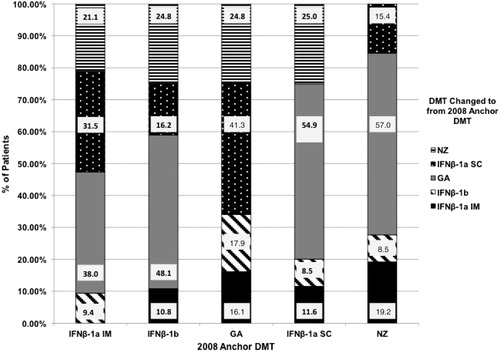
In Period 2, looking forward from the 2008 anchor prescription, 35.0% of the patients did not experience an observable change in DMT in the 2008–2010 time frame. presents the proportions of patients changing to each DMT in the 2008–2010 time frame from each 2008 anchor DMT prescription.
Figure 5. Changes in DMT following the 2008 anchor prescription.
IFNβ-1a IM
In Period 1, looking back from 2008 to January 1, 2006, 14.0% of the 10,079 patients changed to IFNβ-1a IM. Of these patients, 34.7% were previously on IFNβ-1a SC, 32.6% on GA, 26.5% on NZ, and 6.3% on IFNβ-1b. From 2008–2010 (Period 2), 14.0% with a 2008 anchor prescription for IFNβ-1a IM changed to a different DMT: 38.0% of patients changed to GA, 31.5% to IFNβ-1a SC, 21.1% to NZ, and 9.4% to IFNβ-1b.
IFNβ-1a SC
From 2006–2008 (Period 1), 13.6% of the 10,079 patients changed to IFNβ-1a SC as their 2008 anchor prescription. Of these patients, 50.0% were previously on GA, 32.9% on NZ, 11.3% on IFNβ-1a IM, and 5.8% on IFNβ-1b. In Period 2 from 2008–2010, 15.7% of patients with a 2008 anchor prescription for IFNβ-1a SC changed to a different DMT. Of these patients, 54.9% changed to GA, 25.0% to NZ, 11.6% to IFNβ-1a IM, and 8.5% to IFNβ-1b.
IFNβ-1b
Of the 10,079 patients, 11.9% changed to IFNβ-1b as their 2008 anchor prescription during Period 1 (2006–2008). Of these patients, 40.5% were previously on GA, 33.1% on NZ, 14.8% on IFNβ-1a SC, and 11.7% on IFNβ-1a IM. Looking forward from 2008–2010 (Period 2), 13.8% of patients with a 2008 anchor prescription for IFNβ-1b changed to a different DMT. Of these patients, 48.1% changed to GA, 24.8% to NZ, 16.2% changed to IFNβ-1a SC, and 10.8% changed to IFNβ-1a IM.
GA
During Period 1, from 2006–2008, 9.1% of the 10,079 patients changed to GA as their 2008 anchor prescription: 33.7% were previously on IFNβ-1a SC, 30.7% on NZ, 20.6% on IFNβ-1a IM, and 14.9% on IFNβ-1b. In Period 2, 2008–2010, 10.1% of patients with a 2008 anchor prescription for GA changed to a different DMT. Of these patients, 41.3% changed to IFNβ-1a SC, 24.8% to NZ, 17.9% to IFNβ-1b, and 16.1% to IFNβ-1a IM.
NZ
In Period 1, from 2006–2008, 4.7% of the 10,079 patients changed to NZ as their 2008 anchor prescription. Of these patients, 42.9% were previously on GA, 22.4% on IFNβ-1a IM, 20.4% on IFNβ-1a SC, and 14.3% on IFNβ-1b. During Period 2 from 2008–2010, 11.4% of patients with a 2008 anchor prescription for NZ changed to a different DMT. Of these patients, 57.0% changed to GA, 19.2% to IFNβ-1a IM, 15.4% to IFNβ-1a SC, and 8.5% to IFNβ-1b.
Treatment comparison between time periods
In the 2001–2003 time period, 62.9% of the patients had no observable change in DMT prior to their anchor DMT prescription, compared to 46.7% in the 2006–2008 time period. About a third of each DMT anchor cohort in 2003 and 2008 had no changes in DMT in the 2 years following their anchor prescriptions.
Regarding the changes in DMT observed over the various periods of the study, IFNβ-1a IM and IFNβ-1b gained the most users in the 2001–2003 time frame, while IFNβ-1a IM and IFNβ-1a SC gained the most users in the 2006–2008 time frame. The most changes in DMT in each of the follow-up periods from the anchor DMT prescriptions occurred with interferon users. Between 2003–2005, 21.2% of IFNβ-1a SC users and more than 15.0% of IFNβ-1a IM and IFNβ-1b users changed to another interferon or GA, while 12.5% of GA users changed to an interferon, most often IFNβ-1a SC. Those using IFNβ-1a IM also changed most often to IFNβ-1a SC, while those using IFNβ-1a SC or IFNβ-1b changed to GA more than 50% of the time. Between 2008–2010 the largest proportion of changes from each of the interferons and NZ were to GA. Of those with a 2008 anchor prescription for NZ, 11.4% had a change in therapy, with more than half of them receiving GA.
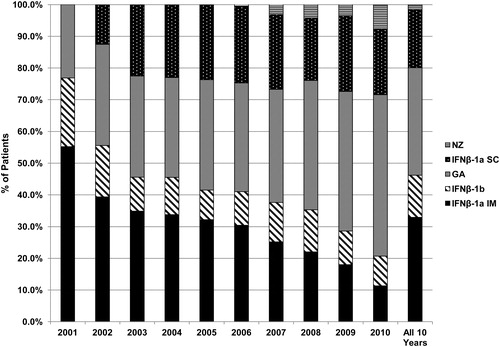
shows the shift in treatment patterns for the treated MS patients over the 2001–2010 time frame. The proportion of patients utilizing GA increased, while the proportion utilizing IFNβ-1a IM decreased. Use of IFNβ-1a SC increased after its introduction to the US market in 2002, and has remained fairly stable since 2003. Use of NZ has been increasing since its reintroduction in 2006. IFNβ-1b use declined after the introduction of IFNβ-1a SC, and remained fairly stable since 2003.
Figure 6. DMT utilization by product from 2001–2010.
Discussion
This study assessed treatment patterns in four time periods, from 2001–2003, 2003–2005, 2006–2008, and 2008–2010. From 2001–2003, the largest proportions of MS patients were started on IFNβ-1a IM and IFNβ-1b, with GA and IFNβ-1a SC having the lowest percentages of therapy gains. From 2003–2005, the largest proportions of patients were changed from IFNβ-1a SC to a different DMT. This is probably due to the introduction of IFNβ-1a SC to the US market in 2002 and the fact that patients who are beginning a new therapy are most vulnerable to discontinuation during the first 3–6 monthsCitation16. Early discontinuation is often the result of unrealistic expectations about the effectiveness of the therapy in the short-term or a lack of tolerability. The lowest percentage of patients were being changed from GA to a different DMT during the 2003–2005 time period. Between 2006–2008, the largest proportion of patients were being changed to IFNβ-1a IM and IFNβ-1a SC. NZ, the newest entry to the MS market in 2006, was beginning to see increased use. From 2008–2010, there was increased use of GA as therapy changes from IFNβ-1a SC, IFNβ-1a IM, IFNβ-1b and NZ were most often to GA. In part this may be attributed to the publications of head-to-head trials which showed GA to be as effective in terms of relapse reduction and slowing of disability progression as two of the interferons, IFNβ-1a SC and IFNβ-1bCitation17,Citation18.
Consistent with the results from Reynolds et al.Citation9, who reported that of patients on IFNβ-1a IM during the baseline period (1996–2005), the most common change was to IFNβ-1a SC, the analysis presented here shows most patients with a IFNβ-1a IM anchor prescription in 2003 changed to IFNβ-1a SC in 2003–2005.
There was also consistency in these findings relative to other studies that have reported lower rates of therapy change from GA than from other DMTs. Patients with GA as their anchor prescription in either 2003 or 2008 were less likely to have changed therapies than patients on other treatments. Reynolds et al.Citation9 reported that, compared to patients with IFNβ-1a IM as their index drug, patients with GA as their index drug were 40% less likely to change therapies (HR: 0.619; 95% CI: 0.51, 0.751). A separate analysis by Reynolds et al.Citation10 reported that patients initiating GA had the lowest rates of therapy change within the first 6 months after initiation (3.9%) and within 12 months after initiation (6.4%) compared to the beta-interferons.
The published literature on MS therapy changes does not include treatment pattern information on recently available MS therapies such as NZ, FG, and TF. While the use of FG and TF were not evaluated in this study due to a lack of data in the study population, this study does provide a picture of treatment patterns prior to and after the use of NZ. From 2006–2008, ∼5% of patients were changed from their anchor prescription to NZ, most often changing from GA, IFNβ-1a IM, and IFNβ-1a SC. From 2008–2010, more than 11% of patients stopped NZ and moved to another DMT. Over 50% of patients changed from NZ to GA, while ∼19% began IFNβ-1a IM and 15% started IFNβ-1a SC. The discontinuation of NZ was related to concerns about the increasing number of cases of progressive multifocal leukoencephalopathy (PML) associated with the drug. Unlike in the early years of this study interval when there were only three MS therapies available and fewer alternatives when one therapy appeared ineffective or intolerable, the additional array of therapies gave physicians and patients more treatment options in these later years that led to more therapy changes.
Over the entire span of the study from 2001–2010, the use of IFNβ-1a IM declined, while the use of GA increased. These findings are consistent with a trend that was first reported in an earlier analysis of the National Ambulatory Medical Care Survey (NAMCS)Citation12. In this study, Avasarala et al.Citation12 reported that, from 1998–2000, the use of IFNβ-1a IM declined, while use of IFNβ-1b and GA showed an upward trend. IFNβ-1a SC did not become commercially available until 2002, and was insignificantly represented in their study.
Reynolds et al.Citation9 examined healthcare resource utilization in MS patients after a treatment change or treatment discontinuation and compared it to those continuing initial treatment. Approximately half (55%) of the patients remained on their index prescription, while 11% changed MS therapy and 33% discontinued MS treatment for at least 90 days. The 18-month medical costs associated with changing therapies or stopping them were significantly higher (p < 0.0001) than those for patients who continued their initial treatment. Changing DMTs may result in increased healthcare costs, since the more common reasons for therapy changes are lack of effectiveness or troublesome side-effects that may require additional outpatient services. In addition, a new therapy could require medical management of its side-effectsCitation9. However, as Gajofatto et al.Citation19 have shown, changing a first-line DMT in patients who are not responding may be effective in many cases. Future research examining the specific reasons why patients change from one DMT to another may assist in determining the optimal sequence of MS treatments and contribute to the development of clinical guidelines.
Limitations
Claims database analysis allows for estimation of real-world treatment patterns, and the strength of our analysis derives from the large, geographically diverse population studied. However, all retrospective database analyses are subject to certain limitations, and the results of this study must be interpreted with appropriate consideration of these limitations. Claims data are collected primarily for payment purposes, not research, and are subject to coding errors. The presence of a claim for a filled prescription does not necessarily indicate that the medication was consumed or that it was taken as prescribed. The changing patterns described here are based on filled prescriptions. Claims-based data are constrained by coverage limitations which determine the data available and limit the generalizability of results to managed care patients. As the majority of MS patients are diagnosed between 20–50 years of age, however, this data source is representative of the MS patient population covered by managed care organizations.
Administrative claims allow for the identification of changes in treatment, but do not allow for an examination of the reasons why treatment changes occur. In this study, it is unknown whether changes in treatment are due to a lack of response to therapy, tolerability issues or side-effects, form of administration, or health plan structure such as copayments.
In this study, there were differences in the proportion of patients who had no observable change in DMT depending on whether the investigation was done using a retrospective or prospective approach. Retrospectively, nearly half to two-thirds of the patients had no observable DMT change, while, prospectively, it appears that about one-third of patients had no change in therapy over the subsequent 2 years. This is probably an artifact of the study design with a longer period of insurance coverage and, thus, database eligibility required looking forward from the anchor DMT prescription than was required looking backward.
Because recent and pending entries of oral medications into the MS armamentarium were outside of the timeframe of this study their patterns of use could not be examined. There is a need for future research to examine the place of oral therapy in the treatment of MS.
Finally, the patient population was identified for this study based on a filled prescription for an MS DMT. Patients were not stratified by type of MS, by disease severity, or by being newly diagnosed or newly treated. As noted by Margolis et al.Citation11, who investigated only newly-diagnosed MS patients, the proportion of therapy changes among a sub-set of only the newly diagnosed would be lower than for the combination of newly-diagnosed and continuously-diagnosed patients examined for this study. Changing patterns and choice of treatment may vary by these characteristics.
Conclusion
In general, switching rates between drugs is an under-served topic with more published data focusing on therapy adherence. The level of switching from the anchor DMT prescriptions found in our study is consistent with other published studies on treatment patterns. However, this is the first study to describe a dynamic pattern of switching over a relatively long time interval inclusive of the time two new drugs (IFNβ-1a SC and NZ) entered the market. Changes in therapy prior to the anchor DMT prescriptions of 2003 and 2008 were reflective of the addition of IFNβ-1a SC to the market in 2002 and the re-entry to the market of NZ in 2006. Following the anchor prescriptions of 2003 and 2008 there were differences in patterns of treatment with more IFNβ-1a IM users being changed to IFNβ-1a SC after the 2003 anchor DMT, while more of each of the interferons and NZ were changed to GA following the 2008 anchor DMT. Now that the first oral DMTs have been introduced into the MS market there is a need to evaluate more recent changes in the treatment patterns of persons with MS.
Transparency
Declaration of funding
Support for this study was provided by Teva Pharmaceuticals.
Declaration of financial/other relationships
MOB is a former employee of Teva Pharmaceuticals. AC and ES are employees of OptumInsight, which was contracted by Teva Pharmaceuticals to conduct the study.
Acknowledgments
Michelle Sotak provided medical writing assistance and is an employee of OptumInsight.
Related Research Data
References
- Compston A, Coles A. Multiple sclerosis. Lancet 2002;359:1221-31
- National Multiple Sclerosis Society. Epidemiology of MS [online]. National Multiple Sclerosis Society, 2011. http://www.nationalmssociety.org/about-multiple-sclerosis/what-we-know-about-ms/who-gets-ms/epidemiology-of-ms/index.aspx. Accessed September 5, 2011.
- Derwenskus J. Current disease-modifying treatment of multiple sclerosis. Mt Sinai J Med 2011;78:161-75
- Expert opinion paper: disease management consensus statement [online]. National Clinical Advisory Board of the National Multiple Sclerosis Society, 2008, New York, NY. http://www.nationalmssociety.org/search-results/index.aspx?q=Consensus+Statement&start=0&num=20&x=22&y=10. Accessed September 5, 2011.
- O'Rourke KE, Hutchinson M. Stopping beta-interferon therapy in multiple sclerosis: an analysis of stopping patterns. Mult Scler 2005;11:46-50
- Río J, Porcel J, Téllez N, et al. Factors related with treatment adherence to interferon beta and glatiramer acetate therapy in multiple sclerosis. Mult Scler 2005;11:306-9
- Tremlett HL, Oger J. Interrupted therapy: stopping and switching of the beta-interferons prescribed for MS. Neurology 2003;61:551-4
- Twork S, Nippert I, Scherer P, et al. Immunomodulating drugs in multiple sclerosis: compliance, satisfaction and adverse effects evaluation in a German multiple sclerosis population. Curr Med Res Opin 2007;23:1209-15
- Reynolds MW, Stephen R, Seaman C, et al. Healthcare resource utilization following switch or discontinuation in multiple sclerosis patients on disease modifying drugs. J Med Econ 2010;13:90-8
- Reynolds MW, Stephen R, Seaman C, et al. Persistence and adherence to disease modifying drugs among patients with multiple sclerosis. Curr Med Res Opin 2010;26:663-74
- Margolis JM, Fowler R, Johnson BH, et al. Disease-modifying drug initiation patterns in commercially insured multiple sclerosis patients: a retrospective cohort study. BMC Neurol 2011;11:122-31. http://www.biomedcentral.com/1471-2377/11/122. Accessed November 20, 2012.
- Avasarala JR, O'Donovan CA, Roach SE, et al. Analysis of NAMCS data for multiple sclerosis, 1998–2004. BMC Med 2007;5. 6 doi:10.1186/1741-7015-5-6 Accessed Jan 2013 http://www/biomedcentral.com/1741-7015/5/6
- Vollmer TL, Hadjimichael O, Preiningerova J, et al. Disability and treatment patterns of multiple sclerosis patients in United States: a comparison of veterans and nonveterans. J Rehabil Res Dev 2002;39:163-74
- Lo AC, Hadjimichael O, Vollmer TL. Treatment patterns of multiple sclerosis patients: a comparison of veterans and non-veterans using the NARCOMS registry. Mult Scler 2005;11:33-40
- 104th Congress. Health Insurance Portability and Accountability Act of 1996. Public Law 104-191 ed. 1996.
- Patti F. Optimizing the benefit of multiple sclerosis therapy: the importance of treatment adherence. Patient Prefer Adherence 2010;4:1-9.
- Mikol DD, Barkhof F, Coyle PK, et al. Comparison of subcutaneous interferon beta-1a with glatiramer acetate in patients with relapsing multiple sclerosis (the REbif vs. Glatiramer Acetate in Relapsing MS Disease [REGARD] Study): a multicentre, randomised, parallel, open-label trial. Lancet Neurol 2008;7:903-14
- O’Connor P, Filippi M, Arnason B, et al. 250 µg or 500 µg interferon beta-1b versus 20 mg glatiramer acetate in relapsing-remitting multiple sclerosis: a prospective, randomised, multicentre study. Lancet Neurol 2009;8:889-97.
- Gajofatto A, Bachetti P, Grimes B, et al. Switching first-line disease-modifying therapy after failure: impact on the course of relapsing-remitting multiple sclerosis. Mult Scler 2009;15:50-8