Abstract
Background:
Nausea is a common migraine symptom that is associated with impaired quality-of-life and functional disability. In this study, population-based data were used to elucidate the relationship between nausea frequency and headache-related healthcare utilization and costs in persons with migraine.
Research design and methods:
Participants with episodic migraine who completed the 2009 American Migraine Prevalence and Prevention (AMPP) Study survey rated their headache-related nausea as occurring never, rarely, <half the time, or ≥half the time with their headaches, and completed questions on symptom frequency and healthcare resource utilization.
Main outcomes measures:
Ordinal logistic regression models were used to assess the association between nausea frequency and headache-related healthcare utilization. Healthcare cost equivalents were calculated.
Results:
Among the 6488 respondents with episodic migraine, the number of respondents observed across headache-related nausea frequency strata were 6.9% for never, 14.5% for rarely, 29.1% for <half the time, and 49.5% for ≥half the time. In unadjusted models, the odds of having ≥1 healthcare encounter for headache in the preceding year increased with frequency of nausea for primary care/obstetrics-gynecology visits (OR = 1.41; 95% CI = 1.30–1.52, p < 0.001), nurse practitioner/physician assistant visits (OR = 1.52; 95% CI = 1.25–1.85, p < 0.001), neurology/headache clinic visits (OR = 1.33, 95% CI = 1.18–1.51, p < 0.001), pain clinic visits (OR = 1.31, 95% CI = 1.01–1.71, p < 0.05), emergency department visits (OR = 1.85; 95% CI = 1.56–2.19, p < 0.01), and overnight hospital stays (OR = 1.50, 92% CI = 1.12–2.00, p < 0.01). The odds of having ≥1 lifetime CT scan or MRI also increased with the frequency of nausea (p < 0.001 for both). Results remained significant in these analyses when controlling for sociodemographics and overall symptom severity except in the case of pain clinic visits (p < 0.107). Visits for Mental Health and visits for Chiropractic/Alternative care did not differ significantly by nausea group in unadjusted or adjusted models. Mean estimated direct headache-related healthcare cost equivalents per person per year generally increased with increasing headache-related nausea frequency across categories of healthcare utilization. Average per person healthcare cost for nausea ≥half the time vs nausea never was $179 and $49 yearly for outpatient services, $183 vs $20 yearly for overnight hospital stays, and $314 vs $257 for lifetime diagnostic services/imaging.
Conclusions:
Direct costs of migraine increase with increasing frequency of migraine-associated nausea. Both frequency and severity of headache-related nausea should be monitored as part of ongoing care of persons with migraine. Headache-related nausea, like headache pain, should be considered an area of central concern during clinical, diagnostic, and treatment optimization assessments.
Study limitations:
This study relied on self-reported headache frequency and healthcare costs which are subject to recall bias and under-reporting; however, reporting bias is unlikely to be different as a function of nausea frequency. In addition, medication use costs and indirect costs (which may be higher than direct costs for migraine) were not assessed.
Introduction
Migraine is a pervasive disease that affects an estimated one in 10 individualsCitation1,Citation2. Migraine attacks are characterized by 4–72-hour bouts of headache that are often unilateral and pulsating and can be aggravated by routine physical activityCitation3. Migraine headaches are associated with gastrointestinal symptoms including nausea and vomiting as well as with photophobia and phonophobia. Some patients have prodromal symptoms such as mood changes or appetite changes, which can occur 1–2 days before a migraine headache. Auras such as scintillating scotomas or paresthesias can also precede a migraine attack. The patient with migraine experiences functional impairment that restricts or prevents normal activitiesCitation1–5.
Headache-related nausea is a defining feature of migraine and a major challenge in its treatmentCitation3,Citation6. Nine in 10 migraineurs have experienced headache-related nausea (with or without vomiting) during at least some of their migraine episodesCitation2,Citation7. Migraine episodes with nausea compared with those without nausea are associated with greater pain severityCitation8,Citation9, poorer response to oral triptansCitation10,Citation11, poor quality-of-lifeCitation12,Citation13, and greater impairment in functional abilityCitation12,Citation13. Headache-related nausea also adversely affects patients’ medication-taking behavior, either as a result of treatment-emergent nausea, or because of headache-related nausea causing an inability to ingest medication. Consequently, headache-related nausea can cause patients to delay or avoid taking oral medicationCitation14, with a resultant loss or reduction of therapeutic efficacy; vomiting can render oral medications of all types (triptans, NSAIDS, narcotics, opioids) ineffective. For oral triptan medications specifically it has been shown that delayed administration has the therapeutic consequence of reducing efficacyCitation15.
The relative frequency and burden of headache-related nausea in persons with migraine were recently described in a companion paperCitation16 that is also based on data from the 2009 US population-based American Migraine Prevalence and Prevention (AMPP) Study survey. Among the 6448 respondents with episodic migraine reporting headache-related nausea symptom data, ∼50% reported high-frequency headache-related nausea (i.e., ≥half the time) with headache. Compared with no/rare headache-related nausea, high-frequency headache-related nausea was associated with significantly (p ≤ 0.05) greater odds of experiencing other headache features frequently; being occupationally disabled or on medical leave; higher levels of headache pain severity and headache-related disability and impact; more frequent reporting of financial burden in obtaining headache medications, worry about running out of headache medication(s), and more frequent reporting that headache medications interfered with work or school work, household work, and family/leisure activities. In addition, modeling of individual headache symptoms and pain intensity indicated that nausea accounted for the largest proportion of variance in predicting headache-related impact (even after taking into account the shared variance of symptoms). These data revealed that high frequency headache-related nausea is common among episodic migraineurs, an important independent predictor of headache-related impact and frequently associated with worse outcomes.
The current study, based on the 2009 AMPP Study survey, was conducted to extend these observations by assessing the association between healthcare resource utilization and costs and the frequency of headache-related nausea in episodic migraine. An understanding of this relationship will help raise awareness of the severity and impact of what is often considered a secondary aspect of migraine, but which recent workCitation16 demonstrates may be a key driver of outcomes.
Patients and methods
Study design
The AMPP Study is a longitudinal, population-based study modeled on the methods of the American Migraine Studies I and IICitation2,Citation17,Citation18. Methods of the AMPP Study have previously been described in detailCitation19,Citation20. Phase 1 was an initial screening phase to identify individuals in the general population with self-reported ‘severe headache’. A validated, self-administered questionnaire comprising 21 questions assessing headache features was mailed in 2004 to a stratified random sample of 120,000 US households, drawn from a 500,000-household nationwide mail panel maintained by the survey sampling firm TNS. Of the 162,756 respondents to the screener, 30,721 reported ≥1 severe headache in the preceding year. The TNS panel comprises sampling blocks, each containing 5000 households, that are constructed to be representative of the US population in terms of census region, population density, age of the head of the household, household income, and number of household members. Demographic and census information was obtained from each household during an initial recruitment mailing and is updated annually.
Phase 2 is a longitudinal study initiated in 2005. A random, representative sample of 24,000 adults (≥18 years old) who were self-identified in the 2004 screening survey as experiencing ‘severe headache’ were included. The baseline survey consisted of 60 detailed questions on headache features, frequency, impairment, medication use, resource utilization, and productivity loss. In longitudinal follow-up to the same individuals, additional questionnaires have been administered annually between 2005–2009 to assess symptoms, impairment, and resource utilization.
The current analyses are based on data collected during the 2009 follow-up with AMPP study participants. Surveys were mailed to 16,983 pre-identified severe headache sufferers.
This study was approved by the Albert Einstein College of Medicine Institutional Review Board.
2009 AMPP study survey questionnaire
The 2009 AMPP Study survey is a self-administered questionnaire assessing variables including but not limited to headache day frequency, pain severity, symptomology and associated features, and other information necessary to assign a headache diagnosis based on International Classification of Headache Disorders 2nd Revision (ICHD-2) criteriaCitation3.
Age and gender were confirmed via self-report in the survey. Additional sociodemographic data including annual average household income, race, household size, population density, and geographic region were obtained from TNS household records.
Respondents provided data on headache day frequency over the preceding 3 months via self-report. Headache symptom data were obtained for 10 headache features using a 4-point frequency scale (never, rarely, less than half the time, or half the time or more). These included: unilateral pain; pulsatile pain; moderate or severe pain intensity; activity-dependent pain exacerbation; photophobia; phonophobia; osmopobia; appetite suppression; neck pain; and sinus painCitation21. Symptom data were used to implement the ICHD-2 classification of migraine. Those meeting criteria for migraine with fewer than 15 headache days/month were classified as episodic migraine for this analysis.
Respondents reported healthcare resource utilization specifically for headaches as well as for other reasons. Data on headache-specific healthcare utilization were summarized and are reported herein. Office-based consultations included primary care, nurse practitioner/physician assistant, neurologist, pain clinic, headache clinic, mental health clinic and chiropractor/alternative medicine. Hospital and diagnostic services included emergency department visits, overnight hospital stays, computer-assisted tomography (CAT) scans, and magnetic resonance imaging (MRI). The number of healthcare encounters in the preceding 12-months was obtained for all utilization variables except for CAT scans and MRI, which were based on lifetime usage.
Statistical analyses
To assess the association between headache-related nausea frequency and odds of ≥1 vs 0 healthcare encounters, healthcare encounters were modeled as a function of a trend effect for headache-related nausea frequency groups in logistic regressions. The trend was a linear polynomial, testing the odds that healthcare resource use increased approximately linearly as headache-related nausea increased from never to rarely to less than half the time and to half the time or more. Logistic regressions were parameterized using SAS’ GENMOD Procedure with binomial distribution and logistic inverse link function. Odds ratios (ORs) for the trend of increasing headache-related nausea on each outcome and 95% confidence intervals (CI) for each utilization variable were the parameters of interest obtained from each logistic regression.
To evaluate the potential influence of sociodemographics and headache symptom severity on the association between resource utilization and headache-related nausea frequency, a second set of regression analyses were conducted with demographic characteristics and a symptom severity composite score as covariates. For these adjusted models the demographic covariates included participant age, gender, income, race, household size, geographic region, and population density. Composite symptom severity was calculated by summing the ratings (1: never, 2: rarely, 3: <half the time, 4: ≥half the time) for the primary migraine diagnostic symptom criteria: unilateral pain, pulsatile pain, pain worsens with routine activity, photophobia, and phonophobia (and excluded nausea).
Headache-related direct healthcare costs were summarized by headache-related nausea frequency, with descriptive statistics for each category of healthcare utilization. Mean usage rates were calculated based on survey data for each headache-related nausea frequency group (based against the total sample, with zero values for non-users) and unit costs for the US were collected outside of the survey and applied to healthcare resource use parameters, as shown in . Unit costs were collected using a direct medical care perspective with publicly available sources from calendar year 2010Citation22,Citation23. Medicare fees were used to approximate costs to Medicare and private healthcare plans for the reimbursement of physician encounters and other services. Medicare fees were used because they were readily available from public sources and serve as a conservative estimate for the reimbursement rates of private health plans. Data from the Healthcare Cost and Utilization Project (HCUP) Nationwide Inpatient Sample and the Nationwide Emergency Department Sample were used to approximate headache-related inpatient hospital stays (HCUP National Inpatient Statistics 2010) and emergency department visits (HCUP Emergency Department Statistics 2010), respectively, using the sub-set of data with a principal International Classification of Diseases, Ninth Revision, Clinical Modification (ICD-9-CM) diagnosis code for migraine (346.0–346.9).
Table 1. Sociodemographic characteristics of the sample.
Results
Sample
Of the 16,983 questionnaires mailed to AMPP Study participants in 2009 a total of 11,792 were returned (response rate: 69.4%) and 6723 met ICHD-2 criteria for episodic migraine. Among these individuals, (96%) provided headache-related nausea frequency from the symptom battery as well as information on healthcare resource utilization. Among respondents with migraine, 446 (6.9%) never had nausea, 942 (14.5%) had it rarely, 1887 (29.1%) had it less than half the time, and 3213 (49.5%) had it half the time or more. The majority of respondents were female, white, and ≥35 years old. Headache-related nausea frequency varied with sociodemographic sub-groups (). Women were more likely than men and white individuals were more likely than black individuals to report headache-related nausea. The sample was roughly evenly distributed across annual household income categories and approximately two thirds of respondents were from more densely populated geographic areas.
Table 2. Per-person healthcare resource utilization costs, data sources, and preceding 12-month mean number of healthcare encounters. (The total n for each nausea group was used to calculate mean yearly cost per respondent.)
Headache-related healthcare utilization
shows that as headache-related nausea frequency increased the frequency of all types of healthcare encounters also increased. In the unadjusted analyses, the odds of having ≥1 healthcare encounter in the preceding year significantly increased with frequency of headache-related nausea (never, rarely, <half the time, ≥half the time) for primary care/obstetrics-gynecology visits (OR = 1.41; 95% CI = 1.30–1.52, p < 0.001), nurse practitioner/physician assistant visits (OR = 1.52; 95% CI = 1.25–1.85, p < 0.001), emergency room/urgent care visits (OR = 1.85; 95% CI = 1.56–2.19, p < 0.01) neurology/headache specialist visits (OR = 1.33; 95% CI = 1.18–1.51, p < 0.001), pain clinic visits (OR = 1.31; 95% CI = 1.01–1.71, p < 0.05) and overnight hospital stays (OR = 1.50; 95% CI = 1.12–2.00, p < 0.01) (). In addition, the odds of having one or more lifetime CT scan (OR = 1.14; 95% CI = 1.08–1.20, p < 0.001) or MRI (OR = 1.12; 95% CI = 1.06–1.18, p < 0.001) significantly increased with frequency of headache-related nausea (). A similar pattern of results was observed with adjusted models, where demographic characteristics and symptom severity were included as covariates, except that the trend for headache-related nausea frequency was not significantly associated with pain clinic visits (p < 0.107). The odds of having one or more mental health or chiropractor/alternative medicine visit in the preceding year did not vary significantly by headache-related nausea frequency in the unadjusted analyses or in the adjusted models ().
Table 3. Headache-related healthcare utilization by nausea frequency for outpatient healthcare services and for hospital and diagnostic imaging services.
Headache-related healthcare costs
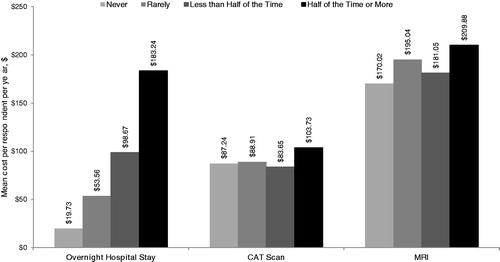
Mean annual direct headache-related healthcare costs per person for outpatient encounters, hospitalization, and diagnostic testing () generally increased with increasing headache-related nausea frequency. Contrasting headache-related nausea ≥half the time vs headache-related nausea never yielded annual per-person direct care costs that were 1.7-times higher for primary care/obstetrics-gynecology utilization, 2.1-times higher for neurology/headache specialist utilization, 5.7-times higher for emergency department/urgent care utilization, and 8.3-times higher for overnight hospital stays. This same contrast yielded estimates of per-person direct healthcare costs of $179 vs $49 yearly for outpatient services, $183 vs $20 yearly for overnight hospital stays, and $314 vs $257 for lifetime diagnostic services/imaging.
Figure 1. Mean headache-related outpatient healthcare costs per respondent per year by service type and nausea group (n = 6488).
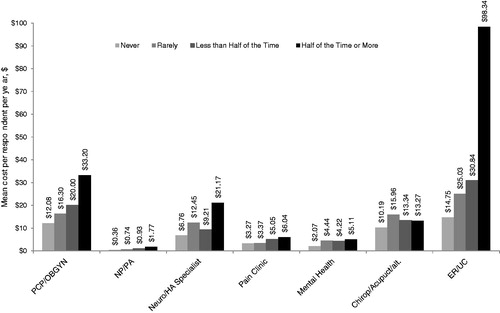
Figure 2. Mean headache-related outpatient healthcare costs per respondent per year in total by nausea group (n = 6488).
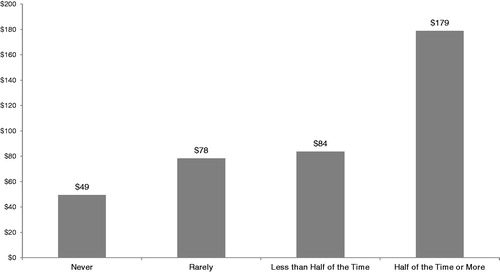
Figure 3. Mean headache-related hospital and diagnostic/imaging healthcare costs per respondent per year by nausea group. Hospital costs are for the past year. CT and MRI costs are for lifetime usage (n = 6488).
Discussion
This study assessed healthcare resource utilization for headache and related direct costs as a function of frequency of headache-related nausea among persons with episodic migraine in a US population-based sample. On average, with each increase in reported headache-related nausea frequency the odds of headache-related healthcare utilization (office visits) over a 1-year period increased by 1.08-times for a primary care visit, 1.21-times for an emergency department/urgent care visit, and 1.19-times for a headache specialist/neurologist visit. Like office visits, the cost of headache-related healthcare increased with increasing frequency of headache-related nausea. Estimated annual per person direct care costs for persons with headache-related nausea ≥half the time vs headache-related nausea never were 1.7-times higher for primary care/obstetrics-gynecology utilization, 2.1-times higher for headache specialist/neurologist utilization, 5.7-times higher for emergency department/urgent care use, and 8.3-times higher for overnight hospital stays. The results can be generalized to the migraine population as the study sample was large and demographically representative of the US migraine population. The trends in utilization and costs are particularly concerning given that approximately half (49.5%) of this US population-based sample of migraineurs fell into the group with the highest utilization (headache-related nausea ≥half the time with their headaches).
Headache-related health encounters are most often attributed to headache pain not nausea. We previously consideredCitation16 a model-based assessment of the importance of nausea relative to other symptoms, including pain, as they related to headache disability impact as measured by the Headache Impact Test (HIT-6). That work demonstrated that nausea was the greatest contributor to headache-related disability and impact, and headache pain was the next largest contributor. These previous findings regarding the importance of nausea features led us to consider the role of nausea in other dimensions like healthcare resource utilization. While we cannot conclude definitively that nausea is an independent predictor of resource utilization, like it is for headache-related impact, it seems likely that migraineurs with greater headache-related impact would also have more healthcare encounters and require greater attention and more resources from the provider community. Our data indicate that migraineurs with headache-related nausea are more likely to seek care and to seek it more often than those without nausea. The regression modeling in the present paper did control for the severity of other migraine headache features. That the nausea effects were robust to this adjustment indicates that the nausea main effects for provider visits are significant independent contributors to resource use, even after accounting for headache pain features (unilateral, pulsatile, and activity-dependent pain exacerbation), and sensory symptoms (photophobia and phonophobia). This was true for overnight stays in the hospital as well.
Primary care visits and obstetric-gynecology visits were combined in this analysis because many women rely on their gynecologist as their primary care provider. To be conservative, utilization costs for gynecology visits were assigned the same value as primary care visits, even though a typical gynecology visit is more costly.
These results extend our previous observationsCitation16 from the 2009 AMPP survey data demonstrating an association of frequent headache-related nausea with greater symptom burden, occupational disability or medical leave, worry about financial impact of headache, worry about running out of medication, and headache-related impact, even after controlling for overall symptom severity. The degree of burden or impairment on these variables was directly related to the frequency of headache-related nausea such that those with headache-related nausea half the time or more were more likely to have worse outcomes compared with those reporting headache-related nausea less than half the time, who in turn were more likely to have worse outcomes compared with those who rarely or never had headache-related nausea. Regression-based correlational analyses indicated that nausea contributed significantly and independently to headache-related impact. Considered in aggregate, these prior dataCitation16 and those presented here show that headache-related nausea is a marker for severe, debilitating migraine as well as increased headache-related resource utilization and direct costs
Limitations
The current study relied on self-reported measures of headache day frequency, headache severity and impact, symptomatology (including headache-related nausea), sociodemographics, and healthcare cost variables. No hospital, insurance, or pharmacy data were accessed directly. Self-report survey methods contain some unreliability due to errors in participant recall and reporting; however, this strategy is common for data collection in large, population-based, epidemiological studies. It is unlikely that the study measures had differentiated effects in persons with headache-related nausea versus persons without headache-related nausea. Substantial differences by headache-related nausea frequency are unlikely to arise due to measurement error.
Because our analysis is limited to data on resource utilization over the past year and symptoms are assessed on a frequency scale (never, rarely, less than half the time, half the time or more), it is not possible to link a given headache directly with a healthcare encounter. Our results are limited to general findings about migraineurs reporting frequent nausea compared to those with less frequent or rare headache-related nausea.
The current study assessed healthcare utilization and estimated headache-related costs based on encounters with providers, but did not capture medication use and associated costs. In the context of the significant impact of headache-related nausea frequency on other categories of healthcare utilization, medication costs are likely to increase with increasing frequency of headache-related nausea. This possibility should be assessed in future research. The study also did not assess indirect costs, which are typically higher than direct costs for migraine and warrant assessment as a function of headache-related nausea frequency.
Another limitation of the current study is the tendency for household panels to under-represent the very wealthy and very poor segments of the population and the lack of representation for military or institutionalized individuals. Moreover, in the current study, as in all studies employing non-experimental designs, the possibility of participation bias and unmeasured or poorly measured confounding cannot be excluded, nor can the influence of pre-existing imbalances among comparison groups. The adjusted analysis was conducted to control statistically for several demographic features as well as symptom severity; whether other possible baseline imbalances could have affected the results is unknown.
Strengths of this study include the use of a large, population-based sample and the use of validated instruments including the AMPP headache diagnosis module, which includes items that assess migraine features according to ICHD-2 criteria. This module has been demonstrated to have a sensitivity of 100% and specificity of 82% for the diagnosis of migraineCitation2, and sensitivity of 93% and specificity of 85% to the diagnosis of chronic migraineCitation24.
Conclusion
The high rate of frequent headache-related nausea among persons with episodic migraine and its link to increased symptom burden and worse outcomesCitation16, as well as the increased headache-related healthcare utilization and costs reported here, indicate that nausea is an important target for the treatment and management of migraine. Both frequency and severity of headache-related nausea should be assessed and considered in treatment planning and should be monitored as part of ongoing care of persons with migraine. Headache-related nausea, like headache pain, should be a target for treatment. Effective management of nausea could reduce the personal, clinical, and economic burdens of headache.
Transparency
Declaration of Funding
The American Migraine Prevalence and Prevention Study is funded through a research grant to the National Headache Foundation from McNeil-Janssen Scientific Affairs LLC, Raritan, NJ. The AMPP database was donated by McNeil-Janssen Scientific Affairs LLC to the National Headache Foundation for use in various projects. Additional analyses were supported by a grant from Nupathe, Inc. Conshohocken, PA, to the National Headache Foundation.
Declaration of financial/other relationships
RL has received grants from Allergan Pharmaceuticals, Endo Pharmaceuticals, GlaxoSmithKline, Minster, Merck, Neuraleve, Novartis, Ortho-McNeil, Pfizer, NuPathe, the National Headache Foundation, and the National Institutes of Health. He has received honoraria from Allergan Pharmaceuticals, AstraZeneca, CoLucid, Endo Pharmaceuticals, GlaxoSmithKline, MAP, Merck, Novartis, Ortho-McNeil, and Pfizer. DB has acted as a consultant for Allergan Pharmaceuticals, ENDO Pharmaceuticals, Iroko Pharmaceuticals, Novartis, MAP, and Merck. MR and DS have received funding for research and data analysis from Allergan Pharmaceuticals, CoLucid, Endo Pharmaceuticals, GlaxoSmithKline, MAP, Merck, Novartis, NuPathe, Ortho-McNeil, and the National Headache Foundation. JS reports no disclosures.
Acknowledgments
The authors acknowledge Kristina Fanning, PhD (Vedanta Research), for additional statistical and analytical support to the authors of this manuscript.
References
- Lipton RB, Bigal ME, Diamond M, et al. Migraine prevalence, disease burden, and the need for preventive therapy. Neurology 2007;68:343-9
- Lipton RB, Stewart WF, Diamond S, et al. Prevalence and burden of migraine in the United States: data from the American Migraine II Study. Headache 2001;41:646-57
- Headache Classification Committee of the International Headache Society. The international classification of headache disorders. 2nd edn. Cephalalgia 2004;24(1 Suppl):9-160
- Stewart WF, Wood GC, Manack A, et al. Employment and work impact of chronic migraine and episodic migraine. J Occup Environ Med 2010;52:8-14
- Hazard E, Munakata J, Bigal ME, et al. The burden of migraine in the United States: current and emerging perspectives on disease management and economic analysis. Value Health 2009;12:55-64
- Rapoport AM, Freitag F, Pearlman SH. Innovative delivery systems for migraine: the clinical utility of a transdermal patch for the acute treatment of migraine. CNS Drugs 2010;24:929-40
- Silberstein SD. Migraine symptoms: results of a survey of self-reported migraineurs. Headache 1995;35:387-96
- Winner P, Rothner AD, Putnam DG, et al. Demographic and migraine characteristics of adolescents with migraine: Glaxo Wellcome clinical trials’ database. Headache 2003;43:451-7
- Kelman L, Tanis D. The relationship between migraine pain and other associated symptoms. Cephalalgia 2006;26:548-53
- Diener HC, Ferrari M, Hansbach H, et al. Predicting the response to sumatriptan: the Sumatriptan Naratriptan Aggregate Patient Database. Neurology 2004;63:520-4
- Diener HC, Dodick DW, Goadsby PJ, et al. Identification of negative predictors of pain-free response to triptans: analysis of the eletriptan database. Cephalalgia 2008;28:35-40
- Holroyd KA, Drew JB, Cottrell CK, et al. Impaired functioning and quality of life in severe migraine: the role of catastrophizing and associated symptoms. Cephalalgia 2007;27:1156-65
- Tkachuk GA, Cottrell CK, Gibson JS, et al. Factors associated with migraine-related quality of life and disability in adolescents: a preliminary investigation. Headache 2003;43:950-9
- National Headache Foundation. Migraine patient survey. 2010. Available at http://www.headaches.org/NHF_Programs/NHF_Web_Surveys [last accessed 27 November 2010] (available online)
- Valade D. Early treatment of acute migraine: new evidence of benefits. Cephalalgia 2009; 29(3 Suppl):15-21
- Lipton RB, Buse DC, Saiers J, et al. Frequency and burden of headache-related nausea: results from the American Migraine Prevalence and Prevention (AMPP) Study. Headache 2013;53:93-103
- Stewart WF, Lipton RB, Celentano DD, et al. Prevalence of migraine headache in the United States: relation to age, income, race, and other sociodemographic factors. JAMA 1992;267:64-70
- Lipton RB, Diamond S, Reed M, et al. Migraine diagnosis and treatment: results from the American Migraine Study II. Headache 2001;41:638-45
- Diamond S, Bigal ME, Silberstein S, et al. Patterns of diagnosis and acute and preventive treatment for migraine in the United States: results from the American Migraine Prevalence and Prevention Study. Headache 2007;47:355-63
- Buse D, Manack A, Fanning K, et al. Chronic migraine, prevalence, disability and sociodemographic factors: results from the American Migraine Prevalence and Prevention Study. Headache 2012;52:1456-70
- Serrano D, Buse DC, Reed ML, et al. Development of the Migraine Symptom Severity Scale (MiSSS) Score: a latent variable model for migraine definition. Headache 2010;50:40
- Physician’s Fee and Coding Guide 2010. Atlanta, GA: MAG Mutual Healthcare Solutions, Inc.
- CMS/Centers for Medicare and Medicaid Services. Physician fee schedule. 2010. http://www.cms.gov/apps/physician-fee-schedule/. Accessed February 2010 (available online)
- Liebenstein M, Bigal M, Sheftell F, Tepper S, Rapoport A, Lipton R. Validation of the chronic daily headache questionnaire (CDH-Q). Headache 2007;47:760-1