Abstract
Objective:
To describe costs, healthcare resource utilization, and adherence of US patients receiving human regular U-500 insulin (U-500R), compared to patients receiving high-dose (>200 units/day) U-100 insulins (U-100) by subcutaneous injection for the treatment of diabetes.
Methods:
A retrospective analysis of data from Thomson Reuters MarketScan Research Databases (7/1/2008 to 12/31/2010). Difference-in-differences analyses were conducted on cost (medical, pharmacy, and overall costs) and on healthcare resource utilization variables (overall, diabetes-related, and non-diabetes-related medical visits). Adherence rates to the index insulins were assessed by proportion of days covered (PDC).
Results:
Seven hundred and eleven (19%) patients in the U-500R cohort and 1508 (6%) patients in the U-100 cohort met selection criteria. Propensity score matching resulted in 684 matched pairs. Mean change in annualized pharmacy costs was in favor of the U-500R vs the U-100 cohort (−$1258 vs $3345, a difference of −$4603, p < 0.0001). Mean overall cost increase in the U-500R vs the U-100 cohort was also lower ($1999 vs $9104, a difference of −$7105, p = 0.005). The proportion of patients with at least one coded hypoglycemic event during the 12-month post-index period was higher in the U-500R vs the U-100 cohort (17.1% vs 11.7%, p < 0.005), but neither hypoglycemia rate (2.73 vs 2.90 events per person) nor hypoglycemia-specific costs (mean $1669 vs $1543) were significantly different. No significant differences were noted between cohorts for change (post–pre) in any resource utilization category. PDC was greater in the U-500R vs the U-100 cohort (65.2% vs 39.5%, p < 0.0001).
Limitations:
Claims data are not as accurate as empirical evaluation by a clinician. Glycemic control data were not available for this analysis.
Conclusions:
In patients requiring high-dose insulin, treatment with U-500R vs high-dose U-100 insulins is associated with significant decreases in pharmacy and overall costs, slightly higher hypoglycemia incidence, no difference in hypoglycemia-specific costs or in resource utilization, and better adherence.
Introduction
The parallel and inter-related global epidemics of diabetes and obesity are rapidly progressingCitation1–4. Severe insulin resistance, defined as daily insulin requirement of >200 units or >2.0 units/kg3,Citation4, is becoming more common and occurs in patients with type 2 diabetes (T2D) and type 1 diabetes (T1D) as wellCitation1,Citation2,Citation5,Citation6. Injecting large volumes of prandial and basal insulins may require complex dosing regimens, with 5–8 separate injections daily, and can lead to injection site discomfort and leakageCitation1,Citation2,Citation6. These issues may lead to poor treatment complianceCitation1,Citation2,Citation4,Citation6,Citation7. A more concentrated insulin preparation reduces the volume of insulin required and may facilitate and simplify insulin management in the target population of patients with insulin resistance and high-dose insulin requirementsCitation1–3,Citation5–8.
Regular U-500 insulin was first introduced to the US market in 1952 (Iletin [beef]; Eli Lilly and Company, Indianapolis, IN). The current formulation, human regular U-500 insulin (U-500R; Humulin R U-500; Eli Lilly and Company), available since 1997, is 5-times more concentrated (500 units/mL) than conventional U-100 insulin (100 units/mL) and comes in a 20 mL vial containing 10,000 units. U-500R has a pharmacokinetic/pharmacodynamic profile distinct from that of human regular U-100 insulinCitation9. In comparison to the U-100 formulation, U-500R has a delayed time-to-peak insulin concentration and action (at 100 units), longer duration of activity, and slightly lower peak insulin concentration and effect, although with similar overall exposure and effect (at both 50 and 100 units) in healthy obese subjectsCitation9.
Use of U-500R has increased dramatically in recent years. Between August 2008 and September 2010, there was a 97% increase in use of U-500RCitation9, which may reflect the growing numbers of patients requiring high-dose insulin and increase in physicians’ and patients’ comfort in using concentrated insulin. However, there is a paucity of information regarding the characteristics of patients using U-500R and the healthcare costs, resource utilization, and adherence in a naturalistic setting.
The objective of this study was to describe patient characteristics, costs (including hypoglycemic events), healthcare resource utilization, and adherence of US patients receiving U-500R compared to patients receiving high doses (>200 units/day) of U-100 insulins for the treatment of diabetes.
Patients and methods
Data source and study design
A retrospective analysis was conducted using data from Thomson Reuters MarketScan Research Databases. These databases capture person-specific clinical utilization, expenditures, and enrollment across inpatient, outpatient, prescription drug, and carve-out services from a selection of large employers, health plans, and government and public organizations. The MarketScan Databases link paid claims and encounter data to detailed patient information across sites and types of providers, and over time. The annual medical databases include private sector health data from ∼100 payers. Historically, more than 500 million claim records are available in the MarketScan Databases. These data represent the medical experience of insured active employees and their dependents, early retirees, Consolidated Omnibus Budget Reconciliation Act (COBRA) continuees, and Medicare-eligible retirees with employer-provided Medicare Supplemental plans. The data used spanned the time period from July 1, 2008 through December 31, 2010. The index date occurred between January 1, 2009 and December 31, 2009, allowing for a 6-month pre-period and a 12-month post-period beginning after the data collection period started and ending before the data collection period ended.
Sample selection
To be eligible for inclusion, patients had to be in receipt of at least two coded diagnoses of T1D or T2D (The International Classification of Diseases, Ninth Revision, Clinical Modification [ICD-9-CM] of 250.xx) at any time during the study period, had continuous medical service and pharmaceutical enrollment for at least 6 months prior to the index date and at least 12 months post index date, and be ≥18 years of age at index. Patients were excluded if they had a diagnosis of secondary diabetes (249.xx) or gestational diabetes (648.8x), or used an insulin pump (not approved by the Food and Drug Administration for use with U-500R) during the pre- or post-periods.
The U-500R cohort was comprised of patients in receipt of at least two U-500R prescriptions via subcutaneous injection, with the first such date identified as the index date. Because high-dose use of U-100 insulin cannot be determined from a single prescription, the U-100 cohort was comprised of patients in receipt of >200 units/day of U-100 insulin therapy, via subcutaneous injection, for at least 31 days within a 60-day period, with the first such date identified as the index date. This was intended to be analogous to the receipt of two high-dose prescriptions. Patients in this cohort did not receive U-500R at any time during the study period (pre-, index, and post-periods).
Outcome measures
Healthcare costs
The cost variables of interest included medical, pharmacy, and overall costs and were calculated in both the pre- and post-periods. Total, diabetes-related, and non-diabetes-related medical costs were divided into the following sub-groups: inpatient, outpatient, and emergency room. Overall pharmacy costs were broken down by insulin type, oral anti-diabetic drug (OAD), non-insulin injectable, and other costs (including the cost of prescribed home blood glucose monitoring supplies). It was our hypothesis that treatment with U-500R, as compared to high-dose U-100 regimens, would be associated with a cost benefit.
Hypoglycemic events were identified by the receipt of an ICD-9-CM diagnostic code associated with hypoglycemia or receipt of an ICD-9-CM diagnostic code of 250.8x (diabetes with other specified manifestations) in the absence of any pre-determined co-diagnosis codes, according to a previously validated algorithmCitation10. Hypoglycemia-specific costs were those attributed to these events. It is important to note that glycemic efficacy data were not available for analysis in this database.
Healthcare resource utilization
The healthcare resource utilization variables of interest were also calculated in both the pre- and post-periods, encompassing overall, diabetes-related, and non-diabetes-related medical visits, and were divided into the following sub-groups: inpatient admissions, outpatient visits, emergency room visits, and total medical visits.
Adherence
Adherence rates to the index insulin regimens in the post-period were assessed by the proportion of days covered (PDC). For the U-500R cohort, the PDC measured the proportion of days U-500R was available over the 12-month post-index period. For the U-100 cohort, given the difficulties in measuring adherence to a complex multiple-injection insulin regimen, PDC was calculated based on the proportion of days when a minimum of each patient’s index daily dose of insulin was available. For example, if at index, a patient had a dosage of 250 units of insulin per day, that patient’s PDC was the proportion of days when at least 250 units of insulin were available.
Statistical analysis
The propensity score matching method was used to control for potential selection bias. The propensity score for each patient, defined by the probability of being in the U-500R cohort, was estimated using logistic regression. The logistic regression propensity model included the a priori identified independent variables, in the pre-index period or at index, listed in . These variables were selected as being potentially moderately related to both cohort and outcome or strongly related to either cohort or outcomeCitation11.
Table 1. Demographic and clinical characteristics of patients in the pre-index period or at index.
A Greedy 1:1 matching algorithmCitation12 was utilized to match each U-500R patient with an appropriate U-100 patient. The algorithm utilized the absolute value of differences in propensity score with a caliper of 0.2-times the standard deviation of the logit of the propensity scoreCitation13,Citation14. The balance produced by the propensity scoring was assessed by significance testing and assessment of standardized differences of each covariate between cohortsCitation15.
Two-sample t-tests and chi-square tests were utilized to assess differences between the cohorts across baseline covariates before and after propensity matching. In addition, the standardized differences, defined as the difference in means between the two groups divided by a measure of the standard deviation of the variable, were computed and displayed. Standardized differences can be computed for both continuous and binary covariates and can identify specific covariates with larger residual imbalances after propensity score adjustment. As a rule of thumb, standardized differences greater than 0.10 indicate an imbalance that may require further investigationCitation15.
The pre-index outcomes including costs, number of hypoglycemia events, and resource utilization were annualized before the differences from pre-index to post-index outcomes were calculated. All statistical tests were evaluated at a significance value of 0.05.
Healthcare costs
Within each matched cohort, a paired t-test was used to compare pre-index cost with post-index cost. Difference-in-differences (DID) (difference between the pre–post, within-subjects differences of the two matched cohorts) cost analyses were conducted using paired t-tests and non-parametric bootstrapping methodsCitation12. The mean and variance of the DID were estimated with 10,000 bootstrap samples of pairs. Bootstrap confidence intervals (95%) were calculated using the percentile method; that is, the 2.5th and 97.5th percentiles of the bootstrap distribution.
Propensity score matching can provide a good balance between groups for measured covariates, but has a potential trade-off of reduced generalizability. A sensitivity analysis for cost was performed on the full, unmatched sample using propensity score bin bootstrapping (PSBB)Citation11. The patients were first grouped into five strata of equal size using the estimated propensity score quintiles. Second, within each study arm, 10,000 bootstrap resamples of fixed sizes were drawn within each stratum, with the total number of samples equaling the total number of patients. Finally, the DID was computed for each of the 10,000 replications; 95% bootstrap confidence intervals using the percentile method for the DID were calculated.
The proportion of patients with hypoglycemia during the post-index period was calculated and compared between the matched cohorts using a chi-square test. The number of hypoglycemia events per patient and the annual costs associated with these hypoglycemic events were then compared using a Wilcoxon rank sum test.
Resource utilization
Paired t-tests were used to compare differences in annualized pre-index resource utilization with post-index resource utilization within each matched cohorts and for DID analyses.
Adherence
The PDC to the index insulin regimen (PDCindex) in the post-index period was calculated and compared between the matched cohorts using a two-sample t-test. The PDCindex was then grouped into five categories (<20%, 20–<40%, 40–<60%, 60–<80%, and ≥80%). The distributions over the five categories were compared between the matched cohorts using a chi-square test. In addition, the proportions of patients with PDCindex ≥80% were compared between the cohorts using a chi-square test. A secondary evaluation calculated the PDC for the U-100 cohort using a minimum daily dose amount of >200 units (PDC200) to assess adherence to high dose regimens in general, not specifically related to the individual patient’s index dose. The same analyses done for the PDCindex were done for PDC200.
All statistical analyses were completed using SAS 9.2 (SAS Institute, Cary, NC).
Results
Study population
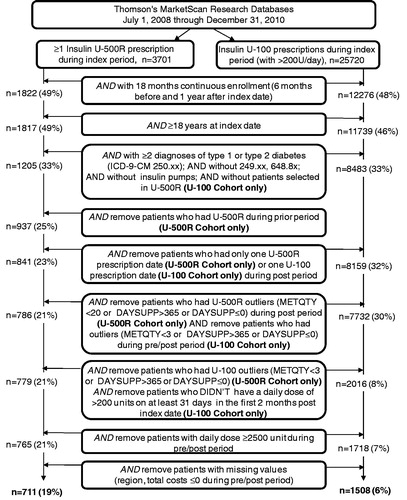
The flow of study sample selection is shown in . A total of 29,421 patients were identified as having had ≥1 U-500R prescription (n = 3701) or ≥1 U-100 prescription (n = 25,720) during the index period. The selection criteria led to a final sample of 711 (19%) patients in the U-500R cohort and 1508 (6%) patients in the U-100 cohort (). The continuous enrollment requirement led to the majority of attrition in each cohort.
Figure 1. Sample selection flowchart. DAYSUPP, day supplied; ICD-9-CM, The International Classification of Diseases, Ninth Revision, Clinical Modification; METQTY, metric quantity; n, number of patients; U-500R, human regular U-500 insulin; U-100, U-100 insulin regimens.
Before propensity score matching, the distributions of multiple patient characteristics were statistically significantly different between the two cohorts (). Compared with the U-100 cohort, the U-500R cohort was younger (p < 0.001), had a higher proportion of females (p < 0.05), a higher proportion of patients enrolled in a commercial insurance plan (p < 0.01), a higher proportion of patients treated by an endocrinologist (p < 0.001), a higher Charlson Comorbidity Index score (p < 0.001), a higher proportion of inpatient admissions (p < 0.05), and a higher proportion of patients treated with non-insulin injectable medication (p < 0.01).
After propensity score matching, which resulted in 684 matched pairs, the two cohorts were balanced in terms of demographic and clinical characteristics in the pre-index period or at index. There were no statistically significant differences across the matched cohorts for any of the 22 variables and the standardized differences were all < 0.1 ().
U-500R patient characteristics
While the majority of U-500R patients (prior to matching) were diagnosed with T2D, 13.5% were identified as having T1D, 54.4% were previously treated with OADs, and 17.4% were treated with non-insulin injectables (). The proportion of U-500R patients who were treated by an endocrinologist was 43.6% ().
Healthcare costs
Within the U-500R cohort, the mean diabetes-related medical costs increased significantly and the mean pharmacy costs decreased significantly from the pre- to the post-period, with no significant difference in the overall costs. The reduction in pharmacy costs was driven by the reduction in U-100 insulins, OAD, and non-insulin injectable costs. Within the U-100 cohort, the mean overall costs increased significantly, as did the costs within the sub-categories of total medical, diabetes-, and non-diabetes-related medical and pharmacy ().
Table 2. Costs for matched cohorts in the pre-index and post-index period.
Mean change in pharmacy costs was much in favor of the U-500R vs the U-100 cohort (−$1258 vs $3345, a difference of −$4603, p < 0.0001). Mean overall cost increase in the U-500R vs the U-100 cohort was also lower ($1999 vs $9104, a difference of −$7105, p = 0.005). The results of the analyses using the non-parametric bootstrapping method supported these findings. When the cost changes between the two unmatched cohorts were analyzed using the PSBB method, the results were in agreement with the findings from the matched cohorts ().
Table 3. Difference-in-differences cost analyses.
The proportion of patients with at least one coded hypoglycemic event during the 12-month post-index period was significantly higher in the U-500R cohort than in the U-100 cohort (17.1% vs 11.7%, p < 0.005), however, among those who experienced an event, there was not a significant difference in the rate of hypoglycemic events per patient between the cohorts (2.73 vs 2.90 events per patient). Accordingly, the costs attributed to hypoglycemic events did not differ significantly between the cohorts (mean $1669 vs $1543).
Resource utilization
In the U-500R cohort, total non-diabetes related and overall utilization significantly increased from pre- to post-index period. In the U-100 cohort, total diabetes-related resource utilization significantly decreased, whereas total non-diabetes-related utilization significantly increased with no difference in overall resource utilization. However, there were no significant differences between the two cohorts on the change (post–pre) in each of the resource utilization categories and overall utilization ().
Table 4. Resource utilization.
Adherence
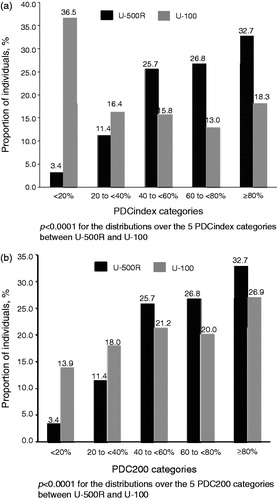
Adherence to the index regimen (PDCindex) during the post-index period was significantly greater in the U-500R cohort than the U-100 cohort (mean PDCindex: 65.2% vs 39.5%, p < 0.0001). shows the proportion of patients in each of the five PDCindex categories (<20%, 20–<40%, 40–<60%, 60–<80%, and ≥80%) by cohort. The distributions over the five PDCindex categories are significantly different between the two cohorts (p < 0.0001). PDCindex ≥80% was observed in 32.7% of U-500R patients, significantly different from 18.3% of U-100 patients (p < 0.0001). For the U-100 cohort, a more conservative estimate of adherence calculated how many days patients were considered to be high-dose users, as the PDC with >200 units (PDC200). Although the difference between the cohorts was less when using PDC200 for the U-100 cohort, it was still significantly greater in the U-500R cohort than the U-100 cohort (mean PDC200: 65.2% vs 55.5%, p < 0.0001). shows the proportion of patients in each of the PDC200 categories by cohort. The distributions over the five PDC200 categories are significantly different between the two cohorts (p < 0.0001). PDC200 ≥80% was observed in 32.7% of U-500R patients, significantly higher than 26.9% from U-100 patients (p = 0.0181).
Figure 2. Adherence to index insulin regimens (a) PDCindex (b) PDC200. PDCindex, the proportion of days covered using the index insulin regimen; PDC200, the proportion of days covered using a using a minimum daily dose amount of >200 units; U-500R, regular U-500 insulin; U-100, U-100 insulin regimens.
Discussion
This study provides the first real-world analysis of patients taking U-500R insulin compared to high-dose U-100 treatment. Using a large healthcare claims database, this study evaluated healthcare costs, resource utilization, and adherence rates in US patients receiving U-500R for the treatment of diabetes, compared to patients receiving high doses (>200 units/day) of U-100 insulin regimens.
After propensity score matching, the U-500R and U-100 cohorts were very well balanced in terms of demographic and clinical characteristics. As hypothesized, the mean overall cost increase in the U-500R cohort was statistically significantly less than the mean overall cost increase in the U-100 cohort. This difference was driven by a mean decrease in pharmacy costs in the U-500R cohort vs a mean increase in pharmacy costs in the U-100 cohort. Specifically, there was a significant decrease in insulin costs upon initiation of U-500R. Some of this difference may be due to the lower cost per unit of insulin with U-500R compared to the unit costs of the U-100 insulins, both regular and analog. However, this could be offset by the higher number of units dispensed with U-500R prescriptions, making the cost per U-500R prescription higher relative to U-100 patients utilizing less than 10,000 units/month. Furthermore, the length of the post-index period in this study may not have been long enough to show an impact on non-pharmacy diabetes- and non-diabetes-related costs. The fact that the diabetes-related medical costs increased in both cohorts during the study period is not surprising, given the level of utilization and probable severity of disease.
Hypoglycemia-specific costs and the mean number of hypoglycemic events per patient were similar between the cohorts, but the proportion of patients with at least one hypoglycemic event during the post-index period was significantly higher in the U-500R cohort vs the U-100 cohort. Prior U-500R case series have very infrequently reported the occurrence of severe hypoglycemiaCitation1,Citation3,Citation5,Citation6, although a recent large (n = 53) case series did report eight severe hypoglycemic episodes in six patients over a mean treatment duration of 20 monthsCitation8. The higher adherence to insulin regimen in the U-500R cohort may also have contributed to the higher proportion of patients with at least one hypoglycemic event. However, it should be noted that glycemic control could not be assessed in the MarketScan database, and tighter glycemic control in insulin-requiring patients generally correlates with an increased frequency of hypoglycemiaCitation16, so caution must be exercised when interpreting these hypoglycemia data.
No significant differences were observed between the two matched cohorts on the change (post minus pre) in resource utilization, perhaps a reflection of the more advanced diabetes associated with the patients included in both cohorts of this study. As compared to a healthier diabetic population, the level of utilization seen in the present study is considerably higherCitation17,Citation18. Thus, it is likely that the utilization was driven by the patients’ disease severity as opposed to the specific insulins used.
U-500R can generally be dosed 2–3-times dailyCitation1–3,Citation6,Citation7,Citation19,Citation20. Previously published expert clinical reviews have suggested the potential for improved adherence to insulin therapy with U-500R, by reducing the complexity and burden of high dose U-100 regimensCitation2,Citation7. The results in the present study empirically support this notion: adherence was significantly improved in the U-500R cohort as compared to the U-100 cohort. This finding is significant in light of the fact that the differences in the units of insulin dispensed was not adjusted for in the analyses, and previous research has demonstrated that the number of units dispensed of U-100 insulin in a single prescription (i.e., 10 mL in a vial [1000 units] or 15 total mL in a pack of pre-filled pens) can impact the time between refillsCitation21. It is possible that the PDC calculation under-estimates the actual days where U-500R is on hand due to the large volume (20 mL; 10,000 units) dispensed but typically still only written as having 30 days’ supply. On the other hand, there are limitations with attributing adherence to specific doses of insulin from claims data due to the lack of uniform dosing. The U-100 cohort was identified based on having a minimum daily-dose regimen in an attempt to make the comparison to the U-500R cohort, who are by default, high-dose insulin users, as analogous as possible. The intent was to measure adherence specifically to the high-dose regimens, and given that multiple insulins (e.g., basal and bolus) contribute towards the daily requirement of high-dose U-100 use, assigning adherence based on patients’ individual doses was judged to be most appropriate.
There are limitations to this study. The use of retrospective secondary coded data does not provide as accurate an assessment as an empirical evaluation by a clinician and is neither randomized nor controlled. An inflation adjustment to the cost variables was not applied, and, thus, the mean costs for both groups were mildly under-estimated compared to 2010 dollars. However, this would have little effect on the comparisons performed and conclusions drawn from the analyses, given that the data used only spanned 2.5 years. Hypoglycemia rates were calculated using ICD-9-CM codes, which require some medical intervention and, therefore, milder events may not have been captured. A recent study showed that patients experience hypoglycemia significantly more often than what is captured in administrative claims dataCitation22. As mentioned above, the degree of glycemic control (e.g., hemoglobin A1c), which may impact healthcare resource utilization and incidence of hypoglycemic events, was not measured in this study. The doses of insulin measured in this study were calculated based upon the volume dispensed and the days’ supply. We were unable to calculate a weight-based daily dose due to the lack of weight data. Because there is no standard insulin dose for patients, it cannot be determined from claims data whether the full amount of insulin dispensed was used by the patients. Given the difference in units dispensed with U-500R prescriptions (as opposed to U-100 prescriptions), we felt daily doses calculated in this manner would not provide reliable estimates of actual use, and thus were not incorporated into this study. PDC as a measure of adherence may not reflect the true adherence, especially with a therapy such as insulin which is very dose dependent—i.e., not only did they take the insulin, but was it at the right dose at the right time—and done in accordance with exercise/diet/other considerations. Patients who utilized an insulin pump were excluded and, therefore, the results of the present study are not generalizable to that population. Finally, the results may not be representative of uninsured patients or elderly patients with only basic Medicare coverage. The MarketScan database does not include all Medicare claims for those older than 65 years.
This study also has several strengths and contributes unique, highly relevant data to the literature. The data were obtained from a large US claims database and the patients were geographically diverse, reflecting real-world use patterns and characteristics of high-dose insulin users. The cohorts were very well matched and the number of matching criteria used for propensity matching was large. Considering the low number of clinical case reports/series (310 multiple daily dosed U-500R patients in the most recent review/meta-analysis by Reutrakul et al.Citation6) and the fact that there have been no randomized clinical trials of U-500R, the sample sizes in this study were remarkably large. Finally, the use of robust analytical techniques, all demonstrating similar results, strengthens the findings and conclusions of this study.
Conclusions
The findings of this study suggest that, in patients with diabetes requiring high doses (>200 units/day) of insulin, treatment with concentrated U-500R compared to high doses of U-100 insulin is associated with a significant decrease in pharmacy and overall costs, no difference in costs associated with hypoglycemia or resource utilization, and better patient adherence. The finding of increased hypoglycemic episodes and incidence in the U-500R cohort with no difference in costs associated with hypoglycemia compared to the U-100 cohort call for additional health outcomes studies from databases which include glycemic efficacy data.
Transparency
Declaration of funding
This work was sponsored by Eli Lilly and Company.
Declaration of financial/other relationships
E.L.E, P.W., B.H.C., J.X., D.C.H., and J.A.J. are employees of Eli Lilly and Company and own stock in Eli Lilly and Company. I.I. has received research support from Eli Lilly and Company, has served as a consultant for, and is on the speakers’ bureau of Eli Lilly and Company and Merck Sharpe Dohme. A.L.P. has served as a consultant and speaker for Eli Lilly and Company, Novo Nordisk, and Sanofi-aventis. R.C.H. has served as a consultant for and received research support from Eli Lilly and Company, and is on the speakers’ bureau of Eli Lilly and Company and Novo Nordisk. JME Peer Reviewers on this manuscript have no relevant financial relationships to disclose.
Acknowledgments
The authors thank Michelle Carey (PharmaNet/i3, part of the inVentiv Health Company) for assistance with the preparation of the manuscript.
References
- Dailey AM, Tannock LR. Extreme insulin resistance: indications and approaches to the use of U-500 insulin in type 2 diabetes mellitus. Curr Diab Rep 2011;11:77-82
- Garg R, Johnston V, McNally PG, et al. U-500 insulin: why, when and how to use in clinical practice? Diabetes Metab Res Rev 2007;23:265-8
- Lane WS, Cochran EK, Jackson JA, et al. High-dose insulin therapy: is it time for U-500 insulin? Endocr Pract 2009;15:71-9
- Ovalle F. Clinical approach to the patient with diabetes mellitus and very high insulin requirements. Diabetes Res Clin Pract 2010;90:231-42
- Boldo A, Comi RJ. Clinical experience with U500 insulin: risks and benefits. Endocr Pract 2012;18:56-61
- Reutrakul S, Wroblewski K, Brown RL. Clinical use of U-500 regular insulin: review and meta-analysis. J Diabetes Sci Technol 2012;6:412-20
- Segal AR, Brunner JE, Burch FT, et al. Use of concentrated insulin human regular (U-500) for patients with diabetes. Am J Health Syst Pharm 2010;67:1526-35
- Ziesmer AE, Kelly KC, Guerra PA, et al. U500 regular insulin use in insulin-resistant type 2 diabetic veteran patients. Endocr Pract 2012;18:34-8
- de la Peña A, Riddle M, Morrow LA, et al. Pharmacokinetics and pharmacodynamics of high-dose human regular U-500 insulin versus human regular U-100 insulin in healthy obese subjects. Diabetes Care 2011;34:2496-501
- Ginde AA, Blanc PG, Lieberman RM, et al. Validation of ICD-9-CM coding algorithm for improved identification of hypoglycemia visits. BMC Endocr Disord 2008;8:4
- Faries DE, Leon AC, Haro JM, et al. Analysis of observational health care data using SAS. Cary, NC: SAS Institute Inc, 2011
- D'Agostino RB, Jr. Propensity score methods for bias reduction in the comparison of a treatment to a non-randomized control group. Stat Med 1998;17:2265-81
- Austin PC. Optimal caliper widths for propensity-score matching when estimating differences in means and differences in proportions in observational studies. Pharm Stat 2011;10:150-61
- Rosenbaum P. Design of observational studies. New York: Springer Inc., 2010
- Austin PC, Mamdani MM. A comparison of propensity score methods: a case-study estimating the effectiveness of post-AMI statin use. Stat Med 2006;25:2084-106
- Cryer PE. Hypoglycaemia: the limiting factor in the glycaemic management of Type I and Type II diabetes. Diabetologia 2002;45:937-48
- Lee LJ, Li Q, Reynolds MW, et al. Comparison of utilization, cost, adherence, and hypoglycemia in patients with type 2 diabetes initiating rapid-acting insulin analog with prefilled pen versus vial/syringe. J Med Econ 2011;14:75-86
- Maciejewski ML, Maynard C. Diabetes-related utilization and costs for inpatient and outpatient services in the Veterans Administration. Diabetes Care 2004;27:B69-B73
- Cochran E, Musso C, Gorden P. The use of U-500 in patients with extreme insulin resistance. Diabetes Care 2005;28:1240-4
- Eli Lilly and Company. Humulin R regular U-500 prescribing information. Eli Lilly and Co., http://pi.lilly.com/us/humulinr-u500-pi.pdf. Accessed January 21, 2013
- Baser O, Bouchard J, DeLuzio T, et al. Assessment of adherence and healthcare costs of insulin device (FlexPen) versus conventional vial/syringe. Adv Ther 2010;27:94-104
- Williams SA, Shi L, Brenneman SK, et al. The burden of hypoglycemia on healthcare utilization, costs, and quality of life among type 2 diabetes mellitus patients. J Diabetes Complications 2012;26:399-406