Abstract
Objective:
In US treatment guidelines, efavirenz (EFV) is the preferred non-nucleoside reverse transcriptase inhibitor (NNRTI) for first-line HIV treatment. In the ECHO and THRIVE trials comparing EFV with another NNRTI, rilpivirine (RPV), both medications had similar virologic suppression rates at 96-weeks; however, RPV had higher rates of virologic failure and drug resistance and lower rates of discontinuation due to adverse events. This study compared the cost-effectiveness of EFV to RPV in first-line HIV treatment in the US.
Methods:
A Markov model with 14 health states was constructed to estimate 10-year costs and clinical outcomes from a US payer perspective for antiretroviral naïve HIV patients initiating EFV or RPV. First-line efficacy data came from 96-week results of the ECHO and THRIVE trials, which compared EFV and RPV, both in combination with two nucleos(t)ide reverse transcriptase inhibitors. Other clinical inputs, mortality rates, and costs (2011 US$) came from published sources. Subsequent therapy lines (second, third, non-suppressive) were based on US treatment guidelines and common to both treatment arms. Robustness of study results was assessed in sensitivity analyses varying model inputs by ±25%. Potential limitations of the model center on the ability of any model to capture the clinical complexity of HIV treatment.
Results:
In the base case, 10-year costs were lower for EFV compared to RPV ($214,031 vs $222,090). Life expectancy (8.44 years) and years without AIDS (8.40 years) were equal; years in virologic suppression were similar (EFV = 7.87 years, RPV = 7.86 years). EFV had modest cost savings compared to RPV in terms of incremental cost-effectiveness per life-year gained, life-year gained in viral suppression, and life-year gained without AIDS. In sensitivity analyses, EFV remained cost-saving compared to RPV in over 90% of scenarios, demonstrating the robustness of study results.
Conclusions:
EFV was predicted to be modestly cost-saving compared with RPV over 10 years in US patients initiating first-line HIV treatment. Sensitivity analyses suggest that results may hold across multiple settings.
Background
While there have been numerous recent advances in HIV treatment, the underlying goals remain unchanged: achieving durable suppression of HIV-RNA levels while preserving immunologic function, reducing HIV and AIDS-related morbidity and mortality, and maintaining quality-of-lifeCitation1,Citation2. The choice of first-line therapy continues to be significant as it represents the patient’s best chance at sustained virologic suppressionCitation3–5. Non-nucleoside reverse transcriptase inhibitors (NNRTIs) remain a staple in first-line combination antiretroviral therapy (cART), which is defined as two or more drugs from two or more drug classes and must include a protease inhibitor, NNRTI, a nucleoside reverse transcriptase inhibitors (NRTIs) (abacavir or tenofovir), an integrase inhibitor, or an entry inhibitorCitation6.
There are currently five NNRTI treatments approved by the Food and Drug Administration (FDA)Citation7. Of these, efavirenz (EFV), rilpivirine (RPV), nevirapine, and delavirdine have treatment-naïve indications, and only EFV and RPV are offered in a one-pill-per-day regimen, which for EFV has shown to be associated with higher patient adherence compared to a two-pill EFV regimenCitation8. EFV was FDA-approved in 1998 for the treatment of HIV infection, while RPV was approved in 2007. In a recent phase III clinical trial, RPV was found to be non-inferior to EFV for the primary end-point of 96-week efficacy (defined as virologic suppression)Citation9. Additionally, pooled clinical trial results indicate that EFV and RPV have similar efficacy and safety profilesCitation9,Citation10, although there appear to be exceptions. For example, EFV had higher rates of adverse events such as dizziness, abnormal dreams, and rash, with associated discontinuation, while RPV had higher rates of virologic failure and treatment resistance, resulting in NNRTI and/or NRTI cross-resistanceCitation9,Citation10.
The HIV treatment guidelines issued by the US Department of Health and Human Services (DHHS) in March 2012 listed EFV combined with emtricitabine and tenofovir as the preferred first-line NNRTI-based regimen, while RPV combined with emtricitabine and tenofovir was listed as an alternative NNRTI-based regimenCitation6. Each of these regimens is available as a single daily pill (Atripla®Citation11 and Complera®Citation12, respectively). A preferred regimen, as defined by the DHHS, has optimal and durable virologic efficacy and a favorable tolerability and toxicity profile, as well as ease of use. In contrast, alternative regimens are defined as being effective but showing disadvantages compared to the preferred regimensCitation6.
The objective of this study was to compare the cost-effectiveness of EFV and RPV, each in combination with two NRTIs, for treatment-naïve HIV patients initiating first-line cART from the perspective of a third-party US payer. This economic evaluation uses clinical data presented in the pooled analysis of the ECHO and THRIVE phase III clinical trials, incorporating additional survival and cost information.
Methods
The cost-effectiveness of EFV relative to RPV, each in combination with two NRTIs, was assessed with a semi-Markov model. The states, inputs, and event probabilities were based on ECHO and THRIVE clinical trial data as well as other published sources, outlined below. A diagram of the model structure is presented in . In summary, patients enter the model as treatment-naïve; every cycle (6 months) they either respond to first-line therapy (i.e., remain in virologic suppression) or are switched to a second-line therapy. Patients can switch therapy lines with or without failed virological suppression. Patients with failed virological suppression can do so with or without treatment resistance. Patients who discontinue without failed virological suppression (e.g., patients who switch due to adverse events) are assumed to not have treatment resistance. Patients cycle through the second and third therapy lines in the same manner, with patients who maintain virologic suppression staying on their current therapy until they either discontinue or have failed suppression. After three lines of therapy, patients transition to non-suppressive therapy and begin progressing towards AIDS (i.e., CD4 counts start decreasing).
Figure 1. Model structure.
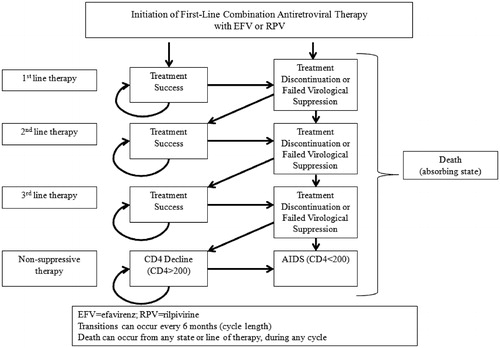
Both AIDS-related and secular (non-AIDS-related) mortality were incorporated in the model. Secular mortality was incorporated using mortality rates on age- and gender-specific 2006 US general population mortality dataCitation13, weighted to match the ECHO and THRIVE clinical trial demographic characteristics (median age 36, 76% male)Citation9. Secular death can occur from any health state, in any cycle. An annual adjustment factor of 2.5 was applied to account for increases in non-AIDS mortality rates present among HIV patientsCitation14.
The model cycle length was set to 6 months, as this aligns with the clinical data available from the ECHO and THRIVE studies. While the model base case was 10 years, time horizons of 3 and 5 years are also presented. A half-cycle correction was incorporated into the modelCitation15. Costs and benefits were discounted at 3% per year, as per the World Health Organization Guide to Cost-Effectiveness AnalysisCitation16. Model outcomes included total cost, total life expectancy, total number of life-years in virological suppression, total number of life-years with AIDS, and cost per year in each of these states. Incremental Cost Effectiveness Ratios (ICERs) were calculated for life expectancy, number of years in virological suppression, and total number of life years with AIDS. ICERs were calculated as the sum of discounted costs divided by the sum of discounted outcomes; non-discounted outcomes were included in a sensitivity analysis. Sensitivity analysis was conducted varying the cost and efficacy inputs by ±25% under a 10-year time horizon. Additional scenarios were conducted, removing the discount rate of 3% on model outcomes, changing the decrease in the virological response from the base case of 4% per year to 2%, 6%, and 10% per year, and using time horizons of 10, 15, and 20 years. For each scenario, the incremental cost per additional life-year, year in virologic suppression, and year without AIDS was evaluated across a total of 75 scenarios.
The model was programmed in Microsoft ExcelCitation17.
Efficacy
Event rates for EFV and RPV were taken from the pooled ECHO and THRIVE clinical trial resultsCitation10,Citation11. Efficacy was defined as maintaining a viral load <50 copies/mL. CohenCitation9,Citation10 reported similar virological responses for both RPV and EFV at 48 and 96 weeks as shown in .
Table 1. Efficacy inputs—event probabilities.
Cohen et al.Citation10 provided efficacy data for the first 96 weeks of RPV or EFV treatment; however, the virological response over longer periods of time is unknown. From year 1 to year 2, virological response in the trial decreased by 4% for both EFV and RPV. In the model base case, this relative rate of decrease in virological response was applied to each subsequent year. After switching from first-line EFV or RPV, patients had probabilities of 0.0745 and 0.0760 of progressing from second-line to third-line treatment, and from third-line to non-suppressive treatment, respectivelyCitation3. Second line treatment consisted of lopinavir or atazanavir plus two NRTIs, and third line treatment and non-suppressive therapy consisted of raltegravir, etravirine, darunavir, and two NRTIsCitation3. Alternate rates of virological response decrease were tested in the sensitivity analysis.
Costs
Only direct medical costs were incorporated in the model. shows model cost inputs in 2011 US$. Treatment costs were calculated per 6-month cycle. Adverse event costs were calculated using the cost (constant across treatments) and prevalence of each event (treatment-specific) for both treatment groups. The cost of a single office visit ($97) was used for the two most common adverse events reported in the ECHO and THRIVE clinical trials, namely mental disturbances (specifically abnormal dreams and dizziness) and management or rashCitation18. Given the transient nature of mental disturbances and rash management, these costs were applied to the first 2 years of EFV or RPV therapy. The ECHO and THRIVE trials found that EFV was associated with higher cholesterol and triglyceride levels compared to RPVCitation10, although this was not associated with an elevation in CV events over the 96-week period. The model assumed that the higher cholesterol and triglyceride levels resulted in additional lipid-lowering therapy at a cost of $1 per dayCitation19.
Table 2. Cost inputs.
Bishai et al.Citation20 estimated that treatment costs for patients with virologic failure and resistance were 1.6-times higher than treatment costs of those with virologic failure without resistance ($21,061 vs $34,518). The model incorporates resistance as a cost multiplier, with 1.55 as the base case value.
Results
Over the 10-year time horizon, EFV patients had total medical and pharmacy costs of $214,031 and showed 8.4426 mean total life-years, of which 7.8694 were spent in virologic suppression. In comparison, RPV patients had total medical costs of $222,090 and 8.4426 mean total life-years, with 7.8571 life-years spent in virologic suppression. contains detailed results from the model at three different time horizons. While clinical outcomes were nearly identical between EFV and RPV, medical costs associated with EFV treatment were ∼$2500 lower over 3 years, $4300 lower over 5 years, and $8000 lower over 10 years. Per 100 patients, RPV had a greater number of cases of virologic failure (+6.2 over 3 years, +9.5 over 5 years, and +13.1 over 10 years) compared to EFV. Of these, RPV had more cases of virologic failure with drug resistance (+3.5 over 3 years, +4.6 over 5 years, and +5.6 over 10 years) when compared to EFV.
Table 3. Model base case summary and incremental cost effectiveness ratios (ICER).
also shows the incremental cost-effectiveness ratios (ICERs) for RPV compared to EFV for the cost per additional life-year gained, additional life-year in virologic suppression, and additional life-year without AIDS over three time horizons (3, 5, and 10 years). As shown in , across all three outcomes and time horizons, RPV is not cost-effective compared to EFV. Over the 3- and 5-year time horizons, RPV provides better clinical outcomes than EFV at a higher cost. The ICERs over the 3- and 5-year time horizons are large due to the small difference in clinical outcomes between EFV and RPV. For example, over a 5-year time horizon, an EFV patient experienced 0.0007 fewer years in virologic suppression than did an RPV patient. Considered over a 10-year time horizon, EFV is dominant (i.e., it provide better clinical outcomes at a lower cost) over RPV.
is parallel to , containing non-discounted outcomes. Similar to the discounted outcomes, EFV had lower costs at 3, 5, and 10 years, with substantively similar outcomes compared to RPV.
Table 4. Model base case summary and incremental cost effectiveness ratios (ICER): non-discounted outcomes.
Sensitivity analysis
With the model base case, EFV dominates RPV (i.e., EFV is less costly with greater benefit). Using a 10-year time horizon and varying inputs by ±25%, the incremental cost per additional life-year, year in virologic suppression, and year without AIDS was evaluated in a total of 204 different scenarios. EFV dominated RPV for 184 of 204 scenarios; in the remaining 20 scenarios, EFV was cost-effective (ICER < $50,000) for 14 scenarios and RPV cost-effective for six scenarios. contains a summary of sensitivity analysis results. Changing the base case values by ±25% of the following characteristics did not impact EFV’s dominance over RPV: cost of managing adverse events, cohort age or gender distribution, secular mortality rate, AIDS-related mortality rate, discount rate, increased cost associated with treatment resistance, costs of switching therapies, or the treatment costs after the first therapy line. Specific cost scenarios were also modeled to determine their impact on the model results. When the price of RPV was set to the price of EFV ($9899 per 6-month cycle), EFV was still dominant over RPV, with modestly better outcomes and modestly lower costs ($4092 over 10 years). Removing the additional cost associated with drug resistance resulted in lower overall costs for both therapies over 10 years (EFV: $209,910; RPV: $215,187) without changing the clinical outcomes. Over longer time horizons, the total cost difference between EFV and RPV increased. Specifically, total costs for EFV were $8000, $9700, and $10,100 lower over 10, 15, and 20 years, respectively. Changing the virological response decrease after the second year of therapy from the base case value of 4% per year to 2%, 6%, and 10%, impacted the overall number of life years in virological suppression. Setting the virological response decrease to 2% per year resulted in total life years in virological suppression of 7.869 and 7.857 for EFV and RPV, respectively, compared to 7.795 and 7.789 using a decrease of 10% per year.
Table 5. Sensitivity analysis results.
Discussion
In the current study, we found that, while the clinical outcomes of EFV and RPV were similar, the decreased cost associated with EFV was modest but increased with longer time horizons. With the exception of adverse event-related costs, which make up a very small portion of overall costs (<1%) for both EFV and RPV, costs for EFV were lower in every other category. Sensitivity analysis showed the robustness of this result; in over 90% of the scenarios tested, the combination of EFV with two NRTIs was either dominant or more cost-effective than RPV combined with two NRTIs. These findings complement the DHHS guidelines supporting EFV as a preferred HIV treatment. DHHS guidelines support first-line use of EFV from a clinical standpoint; the current analysis supports the first-line use of EFV from an economic standpoint, as it provides similar clinical outcomes to RPV at a modestly lower cost.
While the current model included structural elements from published modelsCitation3,Citation17,Citation20, one element that differentiated it from previous studies was its distinction between patients who switched due to virologic failure and patients who switched due to adverse events or other reasons. The current model also incorporated drug resistance in evaluating first-line treatment with EFV vs RPV.
Quantitative data on the negative impact of treatment resistance is scarce, while qualitative information is plentiful. As a result, the current analysis incorporated the impact of treatment resistance through an increase in second-line treatment costs, likely understating the full impact of treatment resistance. The World Health Organization reports that second-line treatment regimens were ∼6-times more expensive than first-line treatment regimens for patients with treatment resistanceCitation21. The ECHO and THRIVE clinical trials reported lower rates of treatment resistance for EFV than for RPVCitation10,Citation11, so increasing the impact of treatment resistance in the model would affect only the magnitude of the results, not the model findings or direction. For example, given base case inputs and a 10-year time horizon, the use of a resistance cost multiplier of 6.0 resulted in total costs of $277,980 and $247,372 for RPV and EFV, respectively (Δ = $30,607); removing the resistant cost multiplier results (i.e., using a cost multiplier of 1.0) resulted in total costs of $215,183 and $209,910 for RPV and EFV, respectively (Δ = $5273). Future research should continue to explore the impact of treatment resistance on outcomes (both economic and clinical), as this is a potential differentiating factor for HIV treatments.
Potential limitations of the model center on the ability of any model to capture the clinical complexity of HIV treatment. The current analysis was limited in that other NNRTI based regimens as well as non-medical costs (e.g., indirect costs, caregiver costs) were not included in the analysis. As with Brogan et al.Citation3, this study used brand pricing and full regimen switches at therapy failure. On one hand, this approach under-estimated the full complexity of HIV treatment following treatment failure; on the other, it created an equitable background and structure with which to evaluate the cost-effectiveness of EFV vs RPV. This model was also limited in its ability to differentiate EFV and RPV, which have very similar clinical profiles. In several instances, differences between EFV and RPV were present in the fourth or fifth decimal place, resulting in large ICERs. The point estimates on these findings should be interpreted with caution as the study inputs were specified to only the first or second decimal place. Due to the clinical similarity between EFV and RPV, this analysis focused on drug acquisition and related treatment costs (e.g., costs related to adverse events) and did not incorporate broader background costs related to overall HIV management.
Conclusion
Over a 10-year time horizon, EFV was predicted to be cost-saving compared with RPV in HIV patients initiating first-line treatment in the US. EFV and RPV had similar efficacy profiles; however, EFV costs were lower in every category with the exception of adverse event-related costs. Alternate scenarios were evaluated including but not limited to adjusting the cohort’s age, impact of treatment resistance, long-term decline in virological response, discount rate, and efficacy and safety profiles of both treatments. In these sensitivity analyses, EFV remained cost-saving more than 90% of the time when compared with RPV, thus demonstrating the robustness of study results. Although the absolute values might change, the robustness of these results suggests that the value of EFV relative to RPV holds across a number of patient populations and settings.
Transparency
Declaration of funding
This research was funded by Bristol-Myers Squibb Co. Truven Health Analytics (formerly Thomson Reuters Healthcare) was awarded a research contract to conduct the study.
Declaration of financial relationships
TJ, TH, and TC are employee of Bristol-Myers Squibb Co. and have received Bristol-Myers Squibb stock/stock options; MB, KP, and GL are employees of Truven Health Analytics (formerly Thomson Reuters Healthcare), which received a research contract to conduct this analysis.
References
- Boyle BA, Jayaweera J, Witt MD, et al. Randomization to once-daily stavudine extended release/lamivudine/efavirenz versus a more frequent regimen improves adherence while maintaining viral suppression. HIV Clin Trials 2008;9:164-76
- Kress KD. HIV update: emerging clinical evidence and a review of recommendations for the use of highly active antiretroviral therapy. Am J Health Syst Pharm. 2004;61(suppl 3):S3-S14
- Brogan AJ, Talbird SE, Cohen C. Cost-effectiveness of nucleoside reverse transcriptase inhibitor pairs in efavirenz-based regimens for treatment-naïve adults with HIV infection in the United States. Value in Health 2011;14:657-64
- Hogg RS, Bangsberg DR, Lima VD, et al. Emergence of drug resistance is associated with an increased risk of death among patients first starting HAART. PLoS Med 2006;3:e356
- Smith CJ, Lampe FC, Youle M, et al. Treatment discontinuation and virological failure amongst HIV-positive individuals starting second-line combination antiretroviral therapy (cART). J Int AIDS Soc 2008;11(Suppl 1):O37
- Department of Health and Human Services (DHHS). Panel on Antiretroviral Guidelines for Adults and Adolescents. Guidelines for the use of antiretroviral agents in HIV-1-infected adults and adolescents. March 27, 2012; 1-240. http://aidsinfo.nih.gov/guidelines. Accessed April 2012
- Food and Drug Administration. Antiretroviral drugs used in the treatment of HIV infection. 2012. http://www.fda.gov. Accessed January 2013
- Portsmouth SD, Osorio J, McCormick K, et al. Better maintained adherence on switching from twice-daily to once-daily therapy for HIV: a 24-week randomized trial of treatment simplification using stavudine prolonged release capsules. HIV Medicine 2005;6:185-90
- Cohen C, Molina J, Cassetti I, et al. Pooled week 96 efficacy, resistance, and safety results from the double-blind, randomised, phase III trials comparing rilpivirin (RPV, TMC278) versus efavirenz (EFV) in treatment-naive, HIV-1-infected adults. Poster Presentation at the 6th International AIDS Society Conference on HIV Pathogenesis, Treatment and Prevention, July 17–20, 2011; Rome, Italy
- Cohen C, Molina JM, Cahn P, et al. Pooled week 48 safety and efficacy results from the echo and thrive phase III trials comparing TMC278 vs EFV in treatment-naive, HIV-infected patients. Oral Presentation 0432. Presented at: The XVIII International AIDS Conference; July 18–23, 2010; Vienna, Austria
- Bristol Myers Squibb Co. Atripla package insert. Plainsboro, NJ. June 2012
- Gilead Sciences. Complera package insert. Foster City, CA. Revised August 2012
- Heron M, Hoyert DL, Murphy SL, et al. Deaths: final data for 2006. Natl Vital Stat Rep 2009;57:1-134
- Lewden C, Chene G, Morlat P, et al. HIV-infected adults with a CD4 cell count greater than 500 cells/mm3 on long-term combination antiretroviral therapy reach same mortality rates as the general population. J Acquir Immune Defic Syndr 2007;46:72-7
- Sonnenberg FA, Beck JR, Markov models in medical decision making. Medical Decision Making 1993, p 329
- World Health Organization (WHO). Guide to cost-effectiveness analysis. Tan-Torres Edejer T, Baltussen R, Adam T, et al., editors. Geneva, Switzerland: WHO; 2013; 45-8
- Microsoft. Microsoft Excel. Redmond, Washington: Microsoft, 2010. Computer Software
- Sanders GD, Bayoumi AM, Sundaram S, et al. Cost-effectiveness of screening for HIV in the era of highly active antiretroviral therapy. N Engl J Med 2005;352:570-85
- Heart Protection Study Collaborative Group. Statin cost-effectiveness in the United States for people at different vascular risk levels. Circ Cardiovasc Qual Outcomes 2009;2:65-72
- Bishai D, Haberlen S, Spacek L, et al. Comparing the cost-effectiveness of first-line HAART regimens. Poster P10.4/06 presented at 11th European AIDS Conference (EACS), October 24–27, 2007; Madrid, Spain
- World Health Organization (WHO). HIV drug resistance fact sheet. April 2011; www.who.int/hiv/. Accessed January 2012