Abstract
Objectives:
To determine the cost effectiveness of sevelamer vs calcium carbonate in patients with chronic kidney disease and not on dialysis (CKD-ND) from the perspective of the National Health Service (NHS) in the UK.
Methods:
A Markov decision analytic model was developed to estimate (1) total life years (LYs), quality-adjusted life years (QALYs), and costs for patients treated with sevelamer or calcium carbonate; and (2) incremental costs per LY gained (LYG) and per QALY gained for sevelamer vs calcium carbonate. Data informing probability transitions to all-cause death and dialysis inception in CKD-ND patients were taken directly from the INDEPENDENT-CKD study and were extrapolated beyond the 3-year clinical trial using Weibull regression analysis. Estimates of health utility and costs (in £2011) were derived from the published literature.
Results:
Over a lifetime horizon, sevelamer treatment resulted in a gain of 2.05 LYs and 1.56 QALYs per patient, an increase of £37,282 in total costs per patient vs calcium carbonate (3.5% discount), and a per-patient cost of £18,193/LYG and £23,878/QALY gained. Results were robust to alternative assumptions in key parameters; results were most sensitive to alternative assumptions regarding the mean daily dose of sevelamer, impact of sevelamer on dialysis initiation, cost of dialysis, and health utility estimates. The probabilistic sensitivity analysis showed that sevelamer was cost-effective vs calcium carbonate in 93% of simulations at a willingness-to-pay threshold of £30,000/QALY gained.
Limitations:
While the model simulated a real-world clinical setting, this analysis was subject to limitations common to all decision analytic models, in that it used a mix of data sources and relied on several assumptions. Not all variables that impact real-world outcomes and costs were included in this model.
Conclusions:
Sevelamer is a cost-effective option compared to calcium carbonate for the first-line treatment of hyperphosphatemia in CKD-ND patients in the UK.
Introduction
Chronic kidney disease (CKD) is recognized as a global public health problem, affecting ∼8% of the world’s populationCitation1. In the UK, recent epidemiological studies indicate that 6–8.5% of the adult population have CKDCitation2. The prevalence of CKD worldwide and in the UK continues to increase at an alarming rate of ∼7% per year as a consequence of pandemics of obesity, hypertension, and type 2 diabetes mellitusCitation3,Citation4. As is the case with many chronic diseases, the clinical and economic burden associated with CKD is significant. Patients with CKD are at increased risk of premature deathCitation5–8 and other health issues such as cardiovascular disease (CVD)Citation9,Citation10, and require lifelong care. Patients who do not succumb to the disease or its sequelae before complete renal failure require either permanent dialysis or kidney transplantation to survive.
Hyperphosphatemia (elevated levels of phosphorus in the body) is a common complication of CKD that begins early in the natural history of the diseaseCitation11–13 and is independently and strongly associated with increased risk of morbidity and mortality in patients with CKDCitation14–16. A systematic review on the health implications of serum phosphorus in patients with CKD revealed higher serum phosphorus levels to be an independent risk factor for CVD and mortalityCitation15. In addition, analysis of data collected by the Dialysis Outcomes and Practice Patterns (DOPPS) study demonstrated that high serum phosphorus levels are also associated with a more rapid decline in renal functionCitation17. In fact, the data shows that even minor increases in serum phosphorus levels within the normal range significantly impact morbidity and mortality in CKD patientsCitation14,Citation18.
In recognition of the poor outcomes associated with increases in serum phosphorus in CKD patients, guidelines recommend that serum phosphate be routinely monitored and maintained within the target range in all patients with CKD stage 3 or greaterCitation1,Citation19–22. The most recent and well-known of these guidelines, the Kidney Disease: Improving Global Outcomes (KDIGO) guidelines, recommend maintaining serum phosphorus within the normal range (2.5–4.5 mg/dl or 0.81–1.45 mmol/l) in patients with stage 3–5 CKD and not on dialysis (CKD-ND) and toward the normal range in patients with stage 5 CKD and on dialysisCitation1.
Phosphate binders, which act to lower serum phosphorus through various mechanisms, are a key component in the successful management of patients with CKD and hyperphosphatemia. Two types of phosphate binders represent the mainstay of pharmacological management of serum phosphorus: calcium-based binders (CBBs) such as calcium acetate and calcium carbonate and non-calcium-based phosphate binders such as sevelamer (including sevelamer hydrochloride and sevelamer carbonate) and lanthanum carbonate. Non-CBBs such as sevelamer were developed and introduced primarily as a response to concerns regarding the long-term safety of CBBs. Clinical studies show that intake of oral calcium (in the form of supplements or phosphate binders) in patients with CKD leads to excess calcium being deposited in the vessels (arterial calcification) and might place patients at increased risk of CVD, cardiovascular events, and mortalityCitation23–26. The KDIGO guidelines, for example, recommend restricting the dose of CBBs for the treatment of hyperphosphatemia in patients with CKD in the presence of arterial calcificationCitation1.
Despite concerns regarding the long-term safety of CBB use and the availability of new phosphate binders such as sevelamer and lanthanum that are efficacious and do not share the same concernsCitation27–30, CBBs remain standard care for the first-line treatment of hyperphosphatemia in CKD patients and particularly in patients with CKD-ND. For example, in the UK, calcium carbonate and calcium acetate are the recommended phosphate binders for the first-line treatment of hyperphosphatemia in CKD-ND patientsCitation31,Citation32, while non-CBBs are typically reserved for second-line use in patients with CKD-ND. The primary reason is one of cost, as CBBs are less costly than non-calcium-based bindersCitation25.
Recently, the INDEPENDENT-CKD study, a multi-center, randomized, open-label study, evaluated the long-term impact of sevelamer vs calcium carbonate on all-cause mortality (primary outcome), the inception of dialysis (secondary outcome), and the composite outcome of all-cause mortality and inception of dialysis (secondary outcome) in patients with Stage 3–4 CKDCitation33. Over the duration of the study (36 months), patients randomized to sevelamer (n = 107) had significantly fewer deaths (p < 0.01) and a trend towards longer duration to dialysis inception than patients randomized to calcium carbonate (n = 105). The INDEPENDENT-CKD study represents the first study to evaluate the impact of phosphate binders on long-term outcomes in patients with CKD-ND and is the first study to demonstrate a significant survival benefit with non-calcium-based binders compared to CBBs in patients with CKD-ND.
The objective of this study was to use data from the INDEPENDENT-CKD study to determine if the clinical benefits associated with the non-calcium-based phosphate binder sevelamer translate into cost-effectiveness vs CBBs (calcium carbonate specifically) in patients with CKD-ND in the UK.
Methods
The economic evaluation of sevelamer vs calcium carbonate was performed using an Excel-based Markov model and data from the INDEPENDENT-CKD study. The study design, patient enrollment, and clinical results of the INDEPENDENT-CKD study are described in detail elsewhereCitation33. Briefly, a total of 239 patients in 12 nephrology clinics across South Italy were randomized in a 1:1 fashion to open-label treatment with either 1600 mg/day sevelamer (n = 107) or 2000 mg/day calcium carbonate (n = 105). Thereafter, clinicians were free to increase the dose of phosphate binder. Patients were followed for 36 months or until all-cause death (the primary study end-point). Inception of dialysis and the composite end-point of all-cause mortality or inception of dialysis were also investigated as secondary study end-points.
For the economic evaluation, data from the INDEPENDENT-CKD study for time to death from all causes was used to calculate life years (LYs), while time to initiation of dialysis and number of dialysis sessions was used in the calculation of costs. Mean daily dose of sevelamer and calcium carbonate was also taken from the INDEPENDENT-CKD study and was included in the calculation of costs. Since the INDEPENDENT-CKD study did not collect data regarding quality-of-life or patient utility, estimates of health utility to inform the calculation of quality-adjusted life years (QALYs) in the analysis were taken from the published literature. The base-case analysis was conducted for a lifetime horizon in order to capture the long-term outcomes associated with the treatment of hyperphosphatemia in patients with CKD. The perspective of the analysis was the NHS in the UK and included all direct medical costs borne by the NHS, including drug and dialysis costs. No indirect costs such as out-of-pocket costs borne by the patient and/or caregiver or productivity losses were included in the analysis. A 3.5% annual discount rate was applied for costs and outcomes based on the guidelines of the National Institute for Clinical Excellence (NICE)Citation34. Costs are expressed in 2011 Great British Pounds (£). Final outputs of the analysis were reported as the incremental cost per LY gained and the incremental cost per QALY gained for sevelamer vs calcium carbonate. The results were subject to a probabilistic sensitivity analysis (PSA).
Model overview
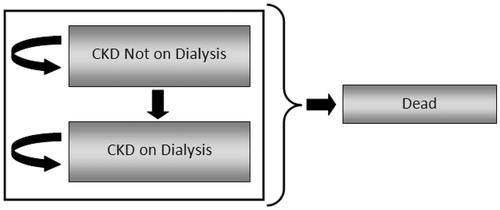
The model was designed as a state transition model using Markov cohort simulation techniques, where a hypothetical cohort of patients (n = 1000) moves simultaneously through the model. A simplified schematic of the model is provided in . Health states incorporated in the model include ‘Alive without Dialysis’, ‘Alive with Dialysis’, and ‘Dead’. All patients started the model in the ‘Alive without Dialysis’ state with a pre-defined set of characteristics (e.g. age, baseline serum phosphate level, co-morbidities). In each model cycle (cycle length = 1 month), patients could transition to the ‘Alive with Dialysis’ state. In each model cycle, patients in each of the ‘Alive’ states either remained in their respective ‘Alive’ states or transitioned to ‘Dead’. Transitions to ‘Alive with Dialysis’ and ‘Dead’ were determined using survival curves from the INDEPENDENT-CKD study, which reported the cumulative risk of dialysis and death, respectively, in patients over time. Utilities and utility decrements used in the calculation of QALYs and resource utilization were derived from the literature; unit costs specific to the UK were derived from UK NHSCitation35 and British National Formulary (BNF) 62Citation36.
Figure 1. Simplified schematic of the Markov model.
Data inputs and assumptions
The key data inputs, assumptions, and sources of data used in the base-case analysis are summarized in and are described in further detail below.
Table 1. Model inputs, assumptions, and data sources for the base-case and one-way sensitivity analyses.
Patient population
The patient population for this analysis was based on the efficacy population of the INDEPENDENT-CKD studyCitation33. Inclusion criteria for study participants were ≥18 years old, stage 3–4 CKD, and not on dialysis. Patients were excluded for heart failure, coronary artery disease, previous myocardial infarction, coronary bypass, angioplasty, stroke, arrhythmia, liver dysfunction, nephrotic syndrome, and fast progression of kidney function. Patients were a mean age of 57.9 years; 61% of patients were male, and 28% of patients were diagnosed with diabetes. The mean baseline serum phosphorus was 4.82 mg/dl for patients randomized to sevelamer and 4.87 mg/dl for patients randomized to calcium carbonate. A greater proportion of patients randomized to sevelamer demonstrated coronary artery calcification (62.6%) compared to patients randomized to calcium carbonate (47.6%) (p = 0.02). There were no significant differences between treatment groups in the use of concomitant medications such as statins, calcium channel blockers, beta-blockers, ACE inhibitors/angiotensin II receptor antagonists, or native or active vitamin D (not shown).
It is important to note that the disposition of patients included in the INDEPENDENT-CKD study may have been broader than the population recommended in the European Medicines Agency (EMEA) guidelines for the use of phosphate binders.
Treatment comparator
Calcium carbonate is the treatment comparator for the CEA as it was the CBB included in the comparator arm of the INDEPENDENT studyCitation33.
All-cause mortality
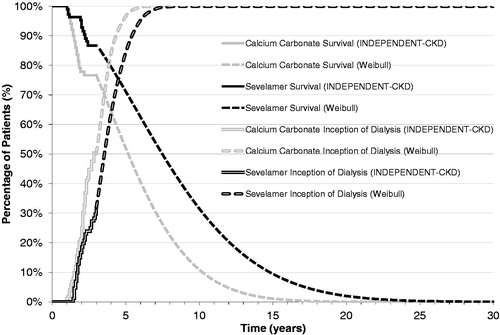
For the analysis, treatment-specific monthly probabilities for the transition from ‘Alive’ to ‘Dead’ for up to 36 months were obtained directly from the Kaplan-Meier survival curves reported in the INDEPENDENT-CKD studyCitation33. The all-cause mortality rate was significantly lower (p < 0.01) in patients that received sevelamer than in those that received calcium carbonate. Weibull regression analysis was used to extrapolate survival beyond the duration of the clinical trial to a lifetime horizon for both the calcium carbonate and sevelamer treatment groups. The Weibull regression model was selected as it showed the best fit among several regression models that were tested, including the lognormal and Gompertz regression models (). On the basis of the extrapolated survival curves, the percentage of patients alive at 10 years was 24% for the sevelamer group and 4% for the calcium carbonate group.
Figure 2. Overall survival and time to inception of dialysis in patients with CKD-ND from the INDEPENDENT-CKD study and extrapolated to lifetime using Weibull regression analysis.
Initiation of dialysis
Thirty-six month treatment-specific monthly probabilities for the initiation of dialysis were also obtained directly from the Kaplan–Meier survival curves reported in the INDEPENDENT-CKD studyCitation33. As reported in the study, 31 (29%) patients in the sevelamer group initiated dialysis vs 42 (40%) patients in the calcium carbonate group. As was the case with overall survival, Weibull regression analysis was used to extrapolate the inception to dialysis curves beyond the duration of the clinical trial to a lifetime horizon for both the calcium carbonate and sevelamer treatment groups. The Weibull regression model was also selected in this case as it showed the best fit among the several regression models that were tested ().
Health utility
A structured literature search and assessment of health utility associated with dialysis and CKD-ND was conducted to determine the most appropriate values for use in the CEA. Computerized literature searches were performed, without any language restrictions, using MEDLINE, NHS Economic Evaluation Database (EED) and Health Technology Assessment (HTA). Articles were considered relevant if health-related quality-of-life (HRQoL) was measured using a generic HRQoL instrument which could then be used to produce a single index score for the calculation of QALYs (including EuroQol-5D [EQ-5D], Health Utility Index [HUI], Short Form-6D [SF-6D], and Quality of Well-Being Scale [QWB]) or if utility had been evaluated directly with a preference-based technique (including time trade-off [TTO] or standard gamble [SG]).
Estimates of health utility for a population of CKD patients in the UK were limited to two published studies assessing the HRQoL in patients with end-stage renal disease (ESRD) that both used the Rosser IndexCitation37,Citation38. GudexCitation37 described the HRQoL of patients on different forms of treatment for ESRD with the aim of collecting data for cost-utility analyses of renal failure treatment in the UK. The Rosser Index score was 0.91 for dialysis patients. Leese et al.Citation38 reported utilities for ESRD patients receiving transfusions or erythropoietin to manage anemia in five European countries including the UK. The HRQoL scores for the UK were 0.917 for transfusion and 0.965 for erythropoietin treatment. No UK or European studies were identified in the published literature that reported HRQoL of patients with CKD-ND. Two published studies in total were identified that reported HRQoL in CKD-ND patients; both studies were conducted in US-based populationsCitation39,Citation40. Gorodetskaya et al.Citation39 used the HUI-3 and TTO techniques to determine health utilities in subjects with CKD at different disease stages. Using a global HUI-3 score of 0.94 to represent good health, the QALY scores varied from 0.71 for CKD patients at stages 1 and 2 to 0.58 for CKD patients at stages 4 and 5. The utility derived from TTO was 0.90 for stages 1 and 2, 0.87 for stage 3, 0.85 for stage 4, and 0.72 for stage 5. Gorodetskaya et al.Citation39 also reported a utility of 0.70 for patients receiving dialysis. Revicki et al.Citation40 reported a utility value of 0.59 for pre-dialysis patients requiring blood transfusion for anemia control and 0.70 for pre-dialysis patients without anemia.
For the base-case analysis, utility score data from Gorodetskaya et al.Citation39 was used to inform utility for patients with CKD-ND and for patients receiving dialysis. The utility associated with CKD-ND used in the base-case analysis (utility = 0.85) was calculated as a weighted average of the TTO utility reported for stage 4 and 5 CKD-ND patients in Gorodetskaya et al.Citation39. The utility associated with patients on dialysis (utility = 0.72) used in the base-case analysis was taken directly from Gorodetskaya et al.Citation39.
Resource utilization and costs
Resource use and costs captured in the economic evaluation are summarized in and reflect acquisition costs associated with sevelamer and calcium carbonate, and dialysis for those patients who initiated dialysis. Other costs such as those associated with hospitalizations, outpatient visits, concomitant medications, and adverse events were not included in the analysis.
The starting dose of sevelamer and calcium carbonate in the INDEPENDENT-CKD study was established on the basis of data from a previous study in pre-dialysis patients in which 1600 mg/day of sevelamer and 2000 mg/day of calcium carbonate were found to be the minimum dosages able to reduce urinary phosphorus excretionCitation25. Thereafter, clinicians in the INDEPENDENT-CKD study were free to adjust the dose of sevelamer and calcium carbonate in order to maintain serum phosphorus concentrations between 2.7–4.6 mg/dl for patients with stage 3–4 CKD, and between 3.5–5.5 mg/dl for patients with stage 5 CKD, as suggested by Kidney Disease Outcomes Quality Initiative (KDOQI) guidelines, which were available at the start of the INDEPENDENT-CKD study. The mean actual daily dose of sevelamer and calcium carbonate as reported in the INDEPENDENT-CKD study (2184 [SD = 592] and 2950 [SD = 703] mg/day, respectively) was used to inform the dose of sevelamer and calcium carbonate in the economic evaluation. The mean dose reported in the INDEPENDENT-CKD study accounts for drug compliance and is representative of drug use in actual practice. The acquisition cost for sevelamer (£0.8192) and calcium carbonate (£0.0900) was taken from the BNF 62 in the UKCitation36.
The annual cost of dialysis incorporated in the base-case analysis (£24,204.19) for patients initiating dialysis was calculated by combining estimates of the percentage of CKD patients in the UK receiving hemodialysis (HD) and peritoneal dialysis (PD) from the 2009 UK Renal Registry (HD, 85%; PD, 15%)Citation41 with an estimate of the frequency of HD and PD (assumed to be 3 days/week and 7 days/week, respectively, based on Renal Association Guidelines on HemodialysisCitation42) and per session costs for HD (£160.59) and PD (£53.15) taken from the 2009–2010 NHS reference costs databaseCitation35. shows the calculations performed in determining the cost of dialysis used in the base-case analysis.
Table 2. Cost of dialysis.
One-way sensitivity analyses and probabilistic sensitivity analysis
One-way sensitivity analyses were performed on the time horizon, discount rate, daily dose of sevelamer, daily dose of calcium carbonate, acquisition cost for sevelamer, alternative assumptions regarding the impact of sevelamer vs calcium carbonate on initiation of dialysis, utility for patients with CKD-ND, and cost of dialysis. During one-way sensitivity analyses all other parameters remained at the base-case analysis values. A probabilistic sensitivity analysis (PSA) was performed to quantify the uncertainty around the cost-effectiveness estimate. The key parameters included in the PSA were the HRs for mortality, time to dialysis, daily dose of sevelamer and calcium carbonate, cost of dialysis, utility for patients with CKD-ND, and utility for patients receiving dialysis. The key parameters included in the PSA and their respective probability distributions are summarized in .
Table 3. Summary of parameter estimates and distributions for the probabilistic sensitivity analysis.
Results
Base-case analysis
The base-case analysis showed that total discounted LYs, QALYs, and costs per patient over a lifetime horizon were greater for patients treated with sevelamer treatment compared to those treated with calcium carbonate (LYs: 6.2458 vs 4.1965; QALYs: 4.8829 vs 3.3216; costs: £83,399 vs £46,117, respectively). The ICERs using LYs and QALYs are shown in . In the base-case analysis, sevelamer was associated with an incremental cost per LY gained of £18,193 and an incremental cost per QALY gained of £23,878.
Table 4. Base-case model results for CKD patients over a lifetime (sevelamer vs calcium carbonate).
Sensitivity analyses
The results of the one-way sensitivity analyses (discounted) are summarized in . The sensitivity analyses showed that the base-case results were most sensitive to: (1) time horizon, (2) mean daily dose of sevelamer, (3) alternative assumptions regarding the impact of sevelamer on initiation of dialysis, and (4) cost of dialysis. Decreasing the time horizon of the analysis from lifetime to 3 years resulted in sevelamer being dominant vs calcium carbonate (i.e. more effective and less costly). Increasing the mean daily dose of sevelamer from 2.184 to 14.4 g (i.e. the maximum dose specified in the Summary of Product Characteristics (SPC) Medicines Compendium 2011) increased the cost per QALY gained to £38,490. Because the results of the INDEPENDENT-CKD study were inconclusive regarding the impact of sevelamer vs calcium carbonate on initiation of dialysis, we conducted a sensitivity analysis which excluded the impact of treatment on initiation of dialysis (as well as the costs of dialysis) and considered only treatment impact on overall survival. In this sensitivity analysis the cost per QALY gained decreased substantially from the base-case of £23,878 to £2108. This was expected because, although the INDEPENDENT-CKD study showed a trend towards a longer duration to the initiation of dialysis, the significant survival advantage for sevelamer meant that more patients were alive to initiate dialysis and therefore accrue the costs associated with dialysis in the base case analysis. For similar reasons, the sensitivity analysis that increased the cost of dialysis in the base-case analysis from £24,204.20 to £31,479.26 resulted in an increase in the cost per QALY to £30,348.
Figure 3. Tornado diagram showing the results of the one-way sensitivity analyses.
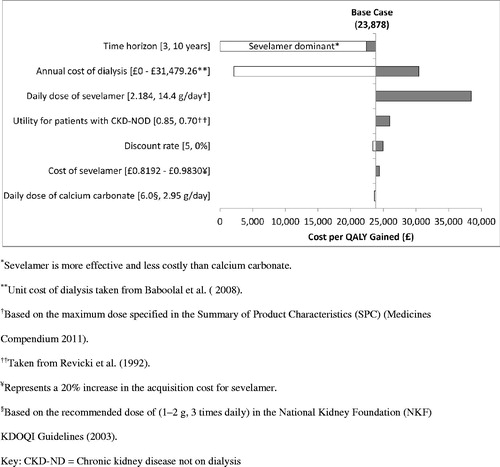
Given the uncertainty around the generalizability of US-based utility estimates to a UK population, we conducted several sensitivity analyses to quantify the impact of alternative assumptions regarding utility on the base-case results. In the analysis that used a lower estimate of the health utility for patients with CKD-ND (0.70) based on HRQoL data reported by Revicki et al.Citation40, the cost per QALY gained increased minimally to £25,990. The base-case results were robust to changes in all other parameters, including a 20% increase in the acquisition cost for sevelamer.
Probabilistic sensitivity analyses
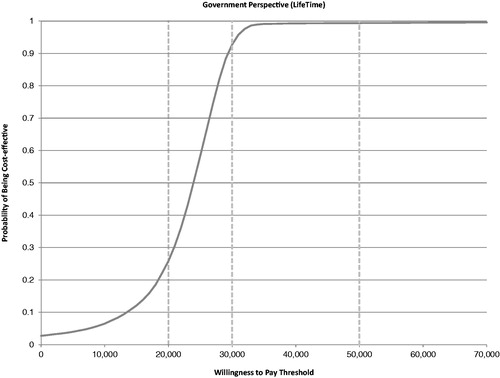
A PSA of 10,000 runs was performed to characterize the uncertainty around the cost effectiveness of sevelamer vs calcium carbonate given the uncertainty around all key variables in the model. plots the results of the PSA on the cost-effectiveness plane, where the x-axis represents the incremental cost for sevelamer vs calcium carbonate and the y-axis represents the incremental QALYs for sevelamer vs calcium carbonate. presents the cost-acceptability curve. A PSA of 10,000 simulations showed a mean QALY gained of 1.65 (SD = 0.742), a mean incremental cost of £40,652 (SD = £23,677), and a mean ICER of £23,035 (SD = £6,238) for sevelamer vs calcium carbonate. These results of the PSA also demonstrated that sevelamer is cost-effective compared with calcium carbonate in ∼93% of simulations, assuming a willingness-to-pay threshold of £30,000 per QALY gained.
Figure 4. Scatterplot of incremental costs and incremental QALYs based on 10,000 simulations.
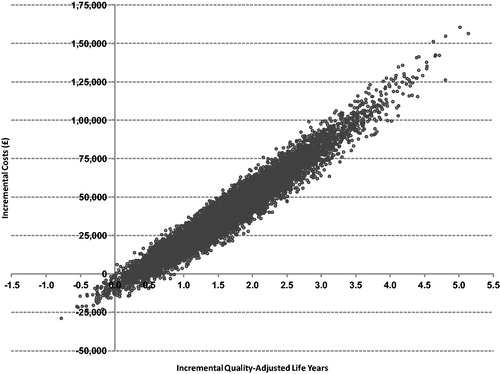
Figure 5. Cost-effectiveness acceptability curve for sevelamer vs calcium carbonate.
Discussion
Hyperphosphatemia is a common, progressive, and life threatening consequence of CKD. The long-term sequelae of hyperphosphatemia in patients with CKD has been well documented; elevated serum phosphorus levels are associated with an independent and significant risk of CVD, further impairment of kidney function, and mortalityCitation15. International guidelines recommend timely diagnosis, routine monitoring, and aggressive treatment of hyperphosphatemia, and recommend the use of phosphate binders therapy to maintain serum phosphate within the normal range for patients with CKD-NDCitation1.
In the UK, sevelamer is indicated for the treatment of hyperphosphatemia in adult patients with CKD-ND and serum phosphate ≥5.5 mg/dl (1.78 mmol/L). Sevelamer has been shown to effectively lower serum phosphorus without the health risks associated with CBBs, but has traditionally been reserved for second-line use after CBBs due to its higher acquisition cost. The objective of this study was to determine if the clinical benefits of sevelamer vs CBBs in terms of mortality and initiation of dialysis translate into good value for money from the perspective of the NHS in the UK. To our knowledge, this study represents the first to examine the cost effectiveness of sevelamer compared with CBBs (calcium carbonate) in the treatment of hyperphosphatemia in CKD-ND patients in the UK. The economic evaluation used data from a large randomized controlled trial that evaluated mortality and initiation of dialysis in 212 patients with stage 3–4 CKD-ND treated with either sevelamer or calcium carbonateCitation33.
In the base-case analysis, patients receiving sevelamer had higher total costs (£37,282) but greater LYs (2.0493) and greater QALYs (1.5613), yielding ICERs of £18,193 and £23,878 per LY and QALY gained, respectively. The base-case results were quite robust across several one-way sensitivity analyses that considered alternative assumptions in key model parameters. The results were most sensitive to alternative assumptions regarding the time horizon of the analysis, impact of sevelamer vs calcium carbonate on initiation of dialysis, and cost of dialysis. Assuming a 3-year time horizon for the analysis, sevelamer was more effective and less costly than calcium carbonate, resulting in a situation of dominance for sevelamer vs calcium carbonate. In the sensitivity analysis that excluded the impact of treatment on the initiation of dialysis and the cost of dialysis, the cost per QALY gained decreased significantly to £2108. In the sensitivity analysis that assumed a higher cost of dialysis, the cost per QALY gained increased significantly to £30,438. The decreased cost per QALY observed by excluding the impact of treatment of the initiation of dialysis and dialysis costs and the increased cost per QALY observed with a higher cost for dialysis can be explained by the fact that sevelamer extends survival, thereby increasing the numbers of patients alive to receive dialysis and increasing the time on dialysis once dialysis is initiated. As dialysis is a costly intervention, any treatment which leads to improved survival and therefore increased use of dialysis will also be associated with higher total costs and, therefore, higher ICERsCitation43. The results were only moderately sensitive to alternative assumptions regarding the daily dose of sevelamer, and the utility for patients with CKD-ND. The results of the PSA showed that, at a willingness-to-pay threshold of £30,000, treatment with sevelamer was cost-effective in 93% of simulations.
This analysis represents the first to make use of head-to-head clinical trial data regarding the impact of sevelamer on the long-term outcomes of survival and dialysis inception. Importantly, the INDEPENDENT-CKD study was designed to approximate a real-world clinical setting, as patients and clinicians were not blinded to treatment and clinicians were at liberty to adjust the dose of phosphate binder in order to maintain serum phosphate level within the target range. However, this analysis is also subject to several limitations. First, hospitalization and cardiovascular event data was not collected in the INDEPENDENT-CKD study and, in order to remain true to the study, hospitalization and cardiovascular events were not included as parameters in the model. However, there is strong evidence demonstrating that sevelamer reduces both the frequency and duration of hospitalization compared to CBBs and may reduce the frequency of cardiovascular events. For example, in a pre-planned secondary analysis of the Dialysis Clinical Outcomes Revisited (DCOR) study that linked study results to the Centers for Medicare and Medicaid Services (CMS) End-Stage Renal Database in the US, sevelamer significantly reduced the rate of hospitalization and the length of stay compared to CBBs in CKD patients on dialysisCitation44. When these data were linked to claims data from the CMS, sevelamer-dependent reductions in hospitalization translated into significant cost savingsCitation45. The exclusion of hospitalization and cardiovascular events from our analysis may have resulted in an over-estimate of the total costs for patients receiving sevelamer and an under-estimate of the total costs for patients receiving CBBs, representing a potential bias in favor of CBBs.
It is important to note that the quality-of-life and cost impacts associated with treatment-related adverse events were also excluded from the CEA for similar reasons. While the INDEPENDENT-CKD study reported a significantly increased risk of hypercalcemia in patients taking calcium carbonate in comparison to those taking sevelamer (n = 82 [78%] vs n = 6 [5%]; p < 0.01), no information regarding the severity of hypercalcemia or the frequency of other adverse events was provided. Of particular interest would have been the frequency of gastrointestinal events in patients treated with sevelamer compared with calcium carbonate, as significant increases in the risk of adverse gastrointestinal events with sevelamer in comparison to calcium salts has been previously reportedCitation29. However, so as not to bias the analysis against calcium-based binders by including only hypercalcemia, it was decided to exclude hypercalcemia and all other adverse events from the CEA.
Second, mortality and inception of dialysis data from the INDEPENDENT-CKD study was limited to 36 months follow-up and was required to be extrapolated via regression analysis in order to inform a lifetime analysis. Due to a lack of availability of longer-term mortality and inception of dialysis data in this patient population, it was not possible to validate the final extrapolated curves used in the analysis. In addition, the difference in the time to inception to dialysis between sevelamer and calcium carbonate was not found to be significantly different in the model adjusted for both baseline covariates and time varying covariates (HR = 0.77; 95% CI = 0.45–1.34). As the analysis was intended to model the clinical study as closely as possible, the inception to dialysis curves were incorporated in the base case analysis just as they were reported in the study and were then extrapolated to lifetime horizon. In order to determine the impact of this assumption on the base case results, a sensitivity analysis was conducted that excluded the impact of treatment on the initiation of dialysis and the cost of dialysis. As discussed, the cost per QALY gained decreased significantly to £2108. This was because the significant survival advantage for sevelamer meant that more patients were alive to initiate dialysis and therefore accrue the costs associated with dialysis in the base case analysis.
Third, the INDEPENDENT study was subject to potential biases that may have impacted the results of our analyses. For example, since the trial investigators were not blinded to study treatment, assessment of the trial outcomes may have been biased. Additionally, the analyses were conducted in a completer patient population only (i.e. patients enrolled in the study but lost to follow-up were not included in the analysis), potentially resulting in a biased assessment of study outcomes. Unfortunately, lack of data for the intention-to-treat patient population precluded an analysis for all patients enrolled in the INDEPENDENT study.
And, lastly, due to the absence of data regarding the HRQoL of CKD-ND patients in UK or Europe, utility data from a US-based patient population was used in the base case analysis. While this data represents the best available data regarding the HRQoL for patients with CKD-ND, the generalizability of US-specific HRQoL data to a UK population is not clear. However, we assessed the impact of alternate utility assumptions by conducting several sensitivity analyses, and found that the base case results were only moderately sensitive to changes in this parameter.
Overall, this analysis indicates that the long-term benefits of sevelamer vs calcium carbonate in terms of overall survival and inception of dialysis in patients with CKD-ND translate to good value for money for sevelamer from the perspective of the NHS in the UK.
Conclusions
Management of serum phosphate is vital to reducing the increased risk of CVD, disease progression, and mortality in CKD patients. Sevelamer, a non-absorbed, calcium-free phosphate binder, is an important alternative to traditional phosphate binder therapies. The results of our analysis demonstrate that sevelamer represents a cost-effective alternative to calcium carbonate for the treatment of hyperphosphatemia in patients with CKD-ND in the UK.
Transparency
Declaration of funding
Funding for this research was provided by Genzyme (a Sanofi Company).
Declaration of financial/other relationships
Melissa Thompson, Susan Bartko-Winters, and Lisa Bernard have disclosed that they are employees of and shareholders in Cornerstone Research Group Inc., which received funds from Genzyme for the conduct of this study. Andy Fenton is an employee of Genzyme. Colin Hutchison has received honorarias for scientific consulting from Genzyme Corporation. Biagio Di Iorio has no relevant financial relationships to disclose. JME Peer Reviewers on this manuscript have no relevant financial relationships to disclose.
Acknowledgments
The authors are grateful to Dr David Wheeler for his review of the manuscript and for providing insightful comments. The results of this study were previously presented at the International Society for Pharmacoeconomics and Outcomes Research 15th Annual European Congress in Berlin, Germany, November 2012.
References
- Kidney Disease: Improving Global Outcomes (KDIGO). KDIGO Clinical Practice Guidelines for the Diagnosis, Evaluation, Prevention, and Treatment of Chronic Kidney Disease-Mineral and Bone Disorder (CKD-MBD). Kidney Int 2009;76:S1-S130
- Ayodele OE, Alebiosu CO. Burden of chronic kidney disease: an International perspective. Adv Chronic Kidney Dis 2010;17:215-24
- Stevens PE, O'Donoghue DJ, de Lusignan S, et al. Chronic kidney disease management in the United Kingdom: NEOERICA project results. Kidney Int 2007;72:92-9
- de Lusignan S, Tomson C, Harris K, et al. Creatinine fluctuation has a greater effect than the formula to estimate glomerular filtration rate on the prevalence of chronic kidney disease. Nephron Clin Pract 2011;117:c213-24
- Kundhal K, Lok CE. Clinical epidemiology of cardiovascular disease in chronic kidney disease. Nephron Clin Pract 2005;101:c47-52
- Yoshino M, Kuhlmann MK, Kotanko P, et al. International differences in dialysis mortality reflect background general population atherosclerotic cardiovascular mortality. J Am Soc Nephrol 2006;17:3510-9
- Dor A, Pauly MV, Eichleay MA, et al. End-stage renal disease and economic incentives: the International Study of Health Care Organization and Financing (ISHCOF). Int J Health Care Finance Econ 2007;7:73-111
- Glynn LG, Reddan D, Newell J, et al. Chronic kidney disease and mortality and morbidity among patients with established cardiovascular disease: a West of Ireland community-based cohort study. Nephrol Dial Transplant 2007;22:2586-94
- USRDS. Atlas of chronic kidney disease and end-stage renal disease in the United States. United States Renal Data Service Annual Data Report. Bethesda, MD: National Institutes of Health, National Institute of Diabetes and Digestive and Kidney Diseases, 2011
- Hage FG, Venkataraman R, Zoghbi GJ, et al. The scope of coronary heart disease in patients with chronic kidney disease. J Am Coll Cardiol 2009;53:2129-40
- Ramos AM, Albalate M, Vazquez S, et al. Hyperphosphatemia and hyperparathyroidism in incident chronic kidney disease patients. Kidney Int Suppl 2008;111:S88-93
- Levin A, Bakris GL, Molitch M, et al. Prevalence of abnormal serum vitamin D, PTH, calcium, and phosphorus in patients with chronic kidney disease: results of the study to evaluate early kidney disease. Kidney Int 2007;71:31-8
- Hsu CY, Chertow GM. Elevations of serum phosphorus and potassium in mild to moderate chronic renal insufficiency. Nephrol Dial Transplant 2002;17:1419-25
- Bellasi A, Mandreoli M, Baldrati L, et al. Chronic kidney disease progression and outcome according to serum phosphorus in mild-to-moderate kidney dysfunction. Clin J Am Soc Nephrol 2011;6:883-91
- Kanbay M, Goldsmith D, Akcay A, et al. Phosphate - the silent stealthy cardiorenal culprit in all stages of chronic kidney disease: a systematic review. Blood Purif 2009;27:220-30
- Block GA, Klassen PS, Lazarus JM, et al. Mineral metabolism, mortality, and morbidity in maintenance hemodialysis. J Am Soc Nephrol 2004;15:2208-18
- Young EW, Albert JM, Satayathum S, et al. Predictors and consequences of altered mineral metabolism: the Dialysis Outcomes and Practice Patterns Study. Kidney Int 2005;67:1179-87
- Smith DH, Johnson ES, Thorp ML, et al. Outcomes predicted by phosphorous in chronic kidney disease: a retrospective CKD-inception cohort study. Nephrol Dial Transplant 2010;25:166-74
- National Kidney Foundation. K/DOQI clinical practice guidelines for bone metabolism and disease in chronic kidney disease. Am J Kidney Dis 2003;42:S1-201
- Isakova T, Gutierrez OM, Chang Y, et al. Phosphorus binders and survival on hemodialysis. J Am Soc Nephrol 2009;20:388-96
- Tentori F, Blayney MJ, Albert JM, et al. Mortality risk for dialysis patients with different levels of serum calcium, phosphorus, and PTH: the Dialysis Outcomes and Practice Patterns Study (DOPPS). Am J Kidney Dis 2008;52:519-30
- Danese MD, Belozeroff V, Smirnakis K, et al. Consistent control of mineral and bone disorder in incident hemodialysis patients. Clin J Am Soc Nephrol 2008;3:1423-9
- Chertow GM, Burke SK, Raggi P. Sevelamer attenuates the progression of coronary and aortic calcification in hemodialysis patients. Kidney Int 2002;62:245-52
- Burke SK, Dillon MA, Hemken DE, et al. Meta-analysis of the effect of sevelamer on phosphorus, calcium, PTH, and serum lipids in dialysis patients. Adv Ren Replace Ther 2003;10:133-45
- Russo D, Miranda I, Ruocco C, et al. The progression of coronary artery calcification in predialysis patients on calcium carbonate or sevelamer. Kidney Int 2007;72:1255-61
- Bolland MJ, Grey A, Avenell A, et al. Calcium supplements with or without vitamin D and risk of cardiovascular events: reanalysis of the Women's Health Initiative limited access dataset and meta-analysis. BMJ 2011;342:d2040-40
- Delmez J, Block G, Robertson J, et al. A randomized, double-blind, crossover design study of sevelamer hydrochloride and sevelamer carbonate in patients on hemodialysis. Clin Nephrol 2007;68:386-91
- Fan S, Ross C, Mitra S, et al. A randomized, crossover design study of sevelamer carbonate powder and sevelamer hydrochloride tablets in chronic kidney disease patients on haemodialysis. Nephrol Dial Transplant 2009;24:3794-9
- Navaneethan SD, Palmer SC, Vecchio M, et al. Phosphate binders for preventing and treating bone disease in chronic kidney disease patients. Cochrane Database Syst Rev 2011;(2):CD006023
- Navaneethan SD, Palmer SC, Craig JC, et al. Benefits and harms of phosphate binders in CKD: a systematic review of randomized controlled trials. Am J Kidney Dis 2009;54:619-37
- Hutchison AJ, Smith CP, Brenchley PE. Pharmacology, efficacy and safety of oral phosphate binders. Nat Rev Nephrol 2011;7:578-89
- Ketteler M. Phosphate Metabolism in CKD Stages 3-5: dietary and pharmacological control. Int J Nephrol 2011;2011:970245
- Di Iorio B, Bellasi A, Russo D. Mortality in kidney disease patients treated with phosphate binders: a randomized study. Clin J Am Soc Nephrol 2012;7:487-93
- National Institute for Health and Clinical Excellence (NICE). Guide to the methods of technology appraisal. National Institute for Health and Clinical Excellence. 2008
- National Health Service (NHS). NHS Reference Cost Database. National Health Service, Department of Health. 2010
- British Medical Association and the Royal Pharmaceutical Society of Great Britain. British National Formulary (BNF). London: BMA. 2011
- Gudex CM. Health-related quality of life in endstage renal failure. Qual Life Res 1995;4:359-66
- Leese B, Hutton J, Maynard A. A comparison of the costs and benefits of recombinant human erythropoietin (epoetin) in the treatment of chronic renal failure in 5 European countries. Pharmacoeconomics 1992;1:346-56
- Gorodetskaya I, Zenios S, McCulloch CE, et al. Health-related quality of life and estimates of utility in chronic kidney disease. Kidney Int 2005;68:2801-8
- Revicki DA, Rothman M, Luce B. Health-related quality of life assessment and the pharmaceutical industry. Pharmacoeconomics 1992;1:394-408
- Ansell D, Feehally J, Fogarty D, et al. UK Renal Registry 2009: 12th Annual Report of the Renal Association. Nephron Clin Pract 2010;115(1 Suppl)
- Mactier R, Hoenich N, Breen C. The Renal Association Guidelines - Haemodialysis. The Renal Association. 2009
- Grima DT, Bernard LM, Dunn ES, et al. Cost-effectiveness analysis of therapies for chronic kidney disease patients on dialysis: a case for excluding dialysis costs. Pharmacoeconomics 2012;30:981-9
- St Peter WL, Liu J, Weinhandl E, et al. A comparison of sevelamer and calcium-based phosphate binders on mortality, hospitalization, and morbidity in hemodialysis: a secondary analysis of the Dialysis Clinical Outcomes Revisited (DCOR) randomized trial using claims data. Am J Kidney Dis 2008;51:445-54
- St Peter WL, Fan Q, Weinhandl E, et al. Economic evaluation of sevelamer versus calcium-based phosphate binders in hemodialysis patients: a secondary analysis using centers for Medicare & Medicaid services data. Clin J Am Soc Nephrol 2009;4:1954-61
- Baboolal K, McEwan P, Sondhi S, et al. The cost of renal dialysis in a UK setting—a multicentre study. Nephrol Dial Transplant 2008;23:1982-9
- Revicki DA. Relationship between health utility and psychometric health status measures. Med Care 1992;30:MS27-82