Abstract
Objective:
Understanding of the effects of providers’ cost on regional variation in healthcare spending is still very limited. The objective of this study is to assess cross-state and cross-region variations in inpatient cost of lower extremity amputation among diabetic patients (DLEA) in relation to patient, hospital, and state factors.
Methods:
Patient and hospital level data were obtained from the 2007 US Agency for Healthcare Research and Quality Healthcare Cost and Utilization Project (HCUP). State level data were obtained from the US Census Bureau and the Kaiser Family Foundation websites. Regression models were implemented to analyze the association between in-patient cost and variables at patient, hospital, and state levels.
Results:
This study analyzed data on 9066 DLEA hospitalizations from 39 states. The mean cost per in-patient stay was $17,103. Four out of the five most costly states were located on the East and West coasts (NY and NJ, CA and OR). Age, race, length of stay, level of amputation, in-patient mortality, primary payer, co-morbidities, and type of hospital were significantly correlated with in-patient costs and explained 55.3% of the cost variance. Based on the means of costs unexplained by those factors, the three West coast states had the highest costs, followed by five Midwestern states, and four Southern states, and Kansas were the least costly.
Conclusions:
Over 40% of the variations in DLEA hospital costs could not be explained by major patient-, hospital-, and state-level variables. Further research is needed to examine whether similar patterns exist for other costly surgical procedures among diabetic patients.
Introduction
Significant variation in practice pattern and healthcare expenditures across geographic areas has been documented in the literature. In diabetes patients, previous research showed that amputation rates exhibit high regional variation, even after controlling for age, sex, and race factorsCitation1. Studies have demonstrated that the geographic variation in healthcare spending in the US is greater than in other developed countries such as Canada and the UKCitation2. Differences in healthcare price, population’s health status, income, racial makeup, educational attainment, and patients’ preferences may contribute to the variation in healthcare spendingCitation2. Regional variations in per capita expenditure and some causal factors have been examined on Medicare patients. Gottlieb et al.Citation3 noted that, while Medicare’s payment for similar inpatient services varied substantially across regions, price only explains a small proportion of the observed variation. Although extensive research has been done in the past to examine the contribution of inappropriate use of healthcare services to healthcare expenditure variation, especially discretionary services, few studies can be found on regional variation in providers’ costs for diabetes or other specific disease areas. As a result, our understanding of the effects of providers’ cost on regional variation in healthcare spending is very limited. It is unknown if there are regional patterns in cost variation and whether major patient, hospital, and state factors can explain such variation. Our study sought to examine the regional variation of inpatient cost by focusing on one costly procedure—lower extremity amputation among diabetic patients (DLEA).
Diabetes mellitus causes major complications such as neuropathy and peripheral vascular disease, which may lead to foot ulcer and/or lower extremity amputationCitation4. The risk of LEA in diabetic patients is more than 10-times greater compared to those without diabetes. From 7–20% of diabetes foot ulcer patients will need LEA ultimatelyCitation5. In 2002, there were 82,000 DLEA hospital stays in the USCitation6. Lower extremity amputation results in high use of healthcare resourcesCitation7. Hospitalizations for LEA account for ∼75% of all healthcare costs for diabetic foot ulcer careCitation8. DLEA accounts for more than half of non-traumatic LEAsCitation9. In 2001, DLEA cost the US ∼10 billion dollarsCitation10. Lower extremity amputation was more expensive than hospitalizations due to other procedures related to diabetes such as diabetic coma, heart failure, stroke, ischemic heart disease, peripheral vascular complications, myocardial infarction, and renal failureCitation11. In 2002, the average length of stay (LOS) for DLEA was 11.2 daysCitation6. According to Boulton et al.Citation5, the cost per amputation admission ranged from $16,488–$66,215 in 1998.
There are two objectives of this study: (1) to examine the magnitude of cross-state variation in inpatient cost of DLEA and (2) to estimate the proportion of inpatient cost variation of DLEA that can be explained by patient, hospital, and state level factors. The geographic variation in healthcare prices can be attributed to inputs used to produce medical care. Since price can be broken down into profit mark-up and cost, examining the variation in cost can provide deeper knowledge of price variation by excluding variation in profit markups which depend largely on competition and bargaining powerCitation12.
Methods
We used the 2007 data from the Healthcare Cost and Utilization Project (HCUP) National Inpatient Sample (NIS)Citation13. The database contains ∼8 million inpatient stays from a stratified sample—accounting for 20% of all US community hospitals. Previous studies showed that the HCUP database is reliableCitation14. Both Medicare and non-Medicare patients were included in the current study. Patients who had diabetes as a primary or secondary diagnosis and lower extremity amputation as a primary or secondary procedure were identified using the clinical classification provided in the HCUP. Patient-level variables included age, gender, race, LOS, level of amputation, in-patient mortality, co-morbidities, and primary payer. Hospital-level variables included hospital size, volume of DLEA for hospital and type of hospital (rural, urban non-teaching, urban teaching). Level of amputation was categorized into three groups using ICD-9-CM codes: foot (84.11–84.12), leg (84.13–84.16), and thigh (84.17–84.18) amputation. The burden of comorbidities was estimated using the Charlson’s Comorbidity Index.
Additionally, state-level variables were obtained from two other sources. State average personal income, percentage of the population below the poverty line, and population density were obtained from the US Census Bureau (census.gov). The number of hospital beds per 10,000 residents, number of physicians per 10,000 residents, hospital admissions per 1000 residents, and average malpractice cost were obtained from Kaiser Family FoundationCitation15.
Descriptive analyses were performed on the sample characteristics and costs. The bivariate relationship between cost and patient-level, hospital-level, and state-level variables were examined using state as the unit of analysis. Three-level hierarchical linear regression models were implemented to analyze the association between in-patient cost and independent variables at the patient, hospital, and state level. Random effects of the intercepts for hospitals and states were introduced into the three-level model to account for the clustering effects of patients within hospitals and those of hospitals within states. The inpatient cost was calculated by multiplying the charge by the hospital-specific cost-to-charge ratio provided by HCUP. Although the distribution of in-patient cost is skewed, we chose to use the original cost instead of transformation given the large sample size. According to the Central Limit Theorem, when the sample size is large, even if the original data are skewed, the distribution of the parameter estimated will be normal. Using the original cost variable is also helpful in the interpretation of the results. The three models are shown below.
The model with only patient-level variables:
where X stands for patient-level independent variable (or variables if expanded) and e stands for the residual.
The model with patient- and hospital-level variables:
where costij stands for the cost for patient j within hospital i, β0 is the intercept of the regression model, βpXpij stands for the product of a patient-level variable (or variables if expanded) and its coefficient, βhXhi stands for the product of a hospital-level variable (or variables if expanded) and its coefficient, αi stands for the intercept for hospital i, and eij stands for the residual.
where costkij stands for the cost for patient j within hospital i of state k, β0 is the intercept of the regression model, βpXpkij stands for the product of a patient-level variable (or variables if expanded) and its coefficient, βhXhki stands for the product of a hospital-level variable (or variables if expanded) and its coefficient, πk stands for the intercept of state k, αki stands for the intercept for hospital i in state k, and ekij stands for the residual.
The cost not explained by the individual and hospital-level variables was captured by state-level random effects and residuals. The regional patterns of unexplained cost variation were compared with that of total cost variation to identify states with the most and least unexplained cost. Patterns of total cost variation were examined using the mean in-patient cost of each state. SAS was used for analysis and a p < 0.05 was considered statistically significant.
Results
There were 9066 DLEA hospitalizations in the 2007 HCUP database. Mean patient age was 61.64 years. Of the study sample, 34% were females, 57% were white (10 states did not include race/ethnicity information), mean LOS was 11 days, 55% had Medicare and 70% had amputation limited to the foot or a portion of the foot (foot-level). Mean of total cost per patient was $17,103.
There were 40 states with DLEA cases ( and ). Maine had 20 cases but was excluded because cost data were not available. Tennessee had the lowest average total cost ($9381.4) and New York had the highest total cost ($23,282.7). South Dakota had the shortest LOS (5.3 days) and Hawaii has the longest LOS (19.3 days). South Dakota also had the highest percentage of foot-level amputation (80.1%), while Nevada had the lowest percentage of foot-level amputation (52.0%). New Hampshire and Utah had the lowest number of comorbidities (1.3) and South Dakota had the highest number of comorbidities (3.5).
Table 1. Cost and socio-demographic characteristics of the sample by State*.
Table 2. Clinical characteristics of the sample by State*.
In the bivariate analysis between cost and the other variables using state as the analysis unit, only the 32 states that had more than 50 amputation cases were included. Statistically significant correlations (which were also strong in magnitude) were obtained between cost and LOS (0.689, p = 0.000), cases in each state (0.428, p = 0.014), percentage of liver disease (0.382, p = 0.031), and percentage of rural hospital (−0.349, p = 0.050). None of the state-level variables from were significantly correlated with state average cost of DLEA.
In the hierarchical linear regression analysis, only the 32 states that had more than 50 DLEA cases in 2007 were included. Among patient and hospital factors examined, age, race, length of stay, level of amputation (foot, ankle to knee, thigh), in-patient mortality, primary payer, co-morbidities, and type of hospital (rural, urban non-teaching, urban teaching) were significant. Gender, hospital size, and volume of LEA were non-significant and dropped from the final model. The patient and hospital factors explained 55.3% of the variance. Among the state level factors examined, only the number of hospital beds per 10,000 residents was significant. State average personal income, percentage of the population below the poverty line, population density, number of physicians per 10,000 residents, hospital admissions per 1000 residents, and malpractice cost were non-significant. Overall, the patient-level factors, hospital-level factors, and number of hospital beds per 10,000 can explain 55.9% of the variance. The random intercept effects at the state level accounted for 16.9% of variance. This 16.9% together with the residual is the total variance that cannot be explained by the patient and hospital variables.
To examine the pattern of cross-state variation in cost that was not explained by the patient and hospital factors, we calculated the mean of the unexplained cost (random effect of intercept + residual from the hierarchical linear regression model) for each state. The variation of unexplained cost was examined before and after including the state-level variable—number of hospital beds per 10,000. To facilitate the comparison of state ranks of total cost and unexplained cost, the cross-state variation of total cost is presented in . Unexplained cost variations across states were presented in and . After the number of hospital beds variable was added to the model, the unexplained cost still varied greatly. We can see some states have consistently low or high cost before and after controlling for the patient and hospital level factors. Specifically, California, Oregon, and Michigan consistently had high costs that cannot be explained by the known patient- and hospital-level factors. Tennessee, Kansas, Kentucky, and Arkansas consistently had lower cost. Notably, the rank of some states changed dramatically—Minnesota was low in total cost, but, after controlling for patient and hospital level factors, became the most expensive state. Costs in Virginia, South Carolina, and New Jersey were relatively low after controlling for patient- and hospital-level factors.
Figure 1. Across-state variation in total cost (2007 US$).
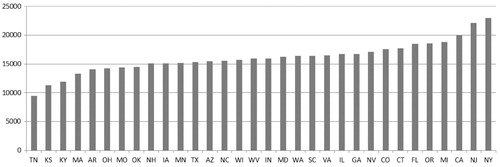
Figure 2. Across-state variation in cost unexplained by patient and hospital factors (2007 US$).
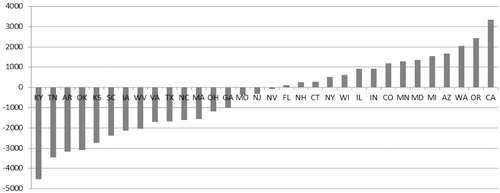
Figure 3. Across-state variation in cost unexplained by patient, hospital, and state factors (2007 US$).
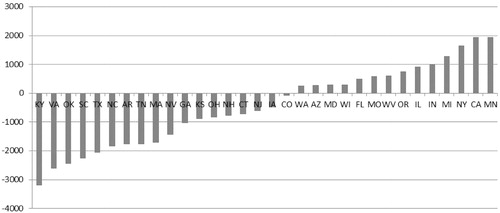
and present the ranks of unexplained cost by states. States with positive values mean that patients from those states tend to have higher costs than can be explained by the factors. States with negative values mean that patients from those states tend to have lower cost than can be explained by the factors. The values presented in and for each state are the average unexplained cost of patients from the specific state. From , we can see that West Coast states (Washington, Oregon, California), Midwestern states (Wisconsin, Illinois, Indiana, Minnesota, Missouri), two Southwest states (Arizona and Colorado), and Maryland had high costs that were unexplained by the patient and hospital level factors. In the middle were several Northeast states (New York, Connecticut, New Hampshire, and New Jersey). The low-cost states after controlling for patient- and hospital-level factors were five Southern states (Kentucky, Tennessee, Arizona, Oklahoma, and Kansas). In , which controlled for the state number of hospital beds, the regional pattern still exists, but was not as clear as in .
Discussion
By focusing on DLEA patients, the current study is the first to examine regional patterns of inpatient cost, the contribution of common patient, hospital and state factors to explaining the cost variation, and the regional pattern of unexplained cost. We used a nationally representative database that covers all types of adult patients, payers, and hospitals. We observed that the total hospital cost for DLEA varied greatly across states and the most costly state (NY) has a cost 2.5-times that of the least costly state (TN). This variation is not as wide as the price variation found in the GAO study which has a multiple of 3.59Citation1Citation2, but it is close to the finding of Makarov et al.Citation16, which found a multiple of 2.69 for radical prostatectomy inpatient cost. It should be noted that the GAO study focused on price variation in the Federal Employees Health Benefit Program across major metropolitan areas, while the current study compared cost variation between states in the general population. The larger variation found in the GAO study may be due to the smaller geographic unit used.
In the bivariate analysis (state as the analysis unit), states with longer LOS, greater number of DLEA cases, a higher percentage of patients with liver disease, and a higher percentage of urban hospitals tended to have higher total costs. It is understandable that longer LOS is associated with higher cost and the higher cost associated with urban hospitals may be due to the higher cost of operation or more complex cases than in rural areas. It is interesting that only liver disease is associated with higher cost, but not the other 25 comorbidities or disorders recorded, e.g., chronic heart failure. Further study is needed to investigate the effects of comorbidities as well as number of diabetes-related LEA cases on state-level cost.
The hierarchical linear regression analysis showed that patient-level variables, the type of hospital, and hospital bed supply in a state explained 55.9% of the cost variance. The remaining 44.1% of variance falls into unexplained cross-state variance and between-individual variance. The effects of patient factors and hospital factors were not the major focus of the current study, so discussion is focused on the cross-state variation. The state ranks of total cost showed some degree of regional pattern, with more Northeastern states having higher costs and more Southern states having lower costs. The state ranks of cost adjusted for patient and hospital factors showed a much clearer regional pattern. Specifically, West Coast states (California, Oregon, and Washington) had the highest costs, which were followed next by the Midwestern states (Missouri, Minnesota, Indiana, Illinois, and Wisconsin), and then the Northeastern states (New York, Connecticut, New Hampshire, New Jersey, and Massachusetts). The southern states had the lowest costs (Kentucky, Tennessee, Arizona, Oklahoma, and Kansas). However, this pattern became somewhat less prominent after factoring in hospital bed supply.
Two inferences may be made from the effects of hospital beds available. First, the greater the number of hospital beds per 10,000 residents, the lower the total cost. This may be a result of (a) competitionCitation17, (b) economies of scale, or (c) that patient populations which have more hospital beds available may have less severe conditions, and, thus, incur lower costs. Second, the change in rank of unexplained cost for states before and after controlling for hospital beds available was generally related to their ranks in hospital beds availableCitation15. Specifically, some states (e.g., WV) shifted up in the cost ranking because those states had more hospital beds to drive down cost relative to other states. So, when hospital beds available were controlled, their unexplained cost became relatively higher. On the other hand, the ranks of unexplained cost for some states (e.g., Virginia) became lower after controlling for hospital beds available. This is because those states had lower hospital bed availability which had driven up their total costs. The shift-up of Midwestern states in the ranking was notable. Those states’ hospital beds availability was in the middle of the range, thus it is reasonable to infer that their shift-up was mainly due to shift-down of California, Oregon, Washington, and Arizona.
More research is needed to examine the relationship between states’ hospital bed availability and inpatient cost, particularly on how hospital bed availability in a state affects in-patient cost, and why this factor is dominant compared with other state-level factors. With such knowledge, policy-makers can be better informed as to whether better planning of hospital bed supply can help in cost-containment.
Overall, when considering the total inpatient cost, a regional pattern was not very clear except that there were more Southern states occupying the lower ranks. After adjusting for patient, hospital, and state factors, the Midwestern and West coast states, together with CA and NY, became the most costly states. This finding is somewhat consistent with the findings from the GAO-sponsored study, which found that prices for hospital stays tended to be higher in metropolitan areas in the MidwestCitation12. The GAO-sponsored study, however, found that prices were lower in the Northeast.
Makarov et al.Citation16 examined the regional variation of total cost by focusing on radical prostatectomy inpatient cost using HCUP NIS data. A comparison of our results with the results of the study by Makarov et al.Citation16 reveals that state ranks of total cost are quite different between DLEA and radical prostatectomy. Specifically, for DLEA the top four states are New York, New Jersey, California, and Missouri, and the bottom four states are Tennessee, Kansas, Kentucky, and Massachusetts; but for radical prostatectomy the top four are Minnesota, California, Massachusetts, and New Hampshire, and the bottom four are Utah, Kansas, Iowa, and Kentucky. Makarov et al.Citation16 did not examine the regional variation of unexplained cost. The difference between the two studies based on the ranking of total cost may suggest that cost variation is procedure-specific. Whether such procedure-specific cost variation is due to physicians’ practice pattern and/or hospitals’ business practice should be investigated.
There are several limitations of the current study which may affect the interpretation and implications of the regional pattern of unexplained cost identified in this study. First, the regional pattern for unexplained cost was based on DLEA. Whether or to what extent this pattern applies to other surgical procedures needs to be examined further. Second, other patient, hospital, and state factors not examined in this study may explain additional variability in costs, which may in turn affect the regional pattern of unexplained cost. Third, only 40 of the 50 states contributed data to the HCUP project in 2007, and only 32 of these states had 50 or more DLEA cases to provide reliable estimation. Although the other 18 states have small-populations (except Pennsylvania), the addition of the other 18 states in future research will provide a more complete picture on the regional patterns.
Conclusions
A regional pattern for unexplained cost was found for DLEA. West coast states and most Midwestern states had the highest and three Southern states had the lowest unexplained cost, while controlling for patient and hospital factors. After considering states’ hospital bed availability, West coast states and the Midwestern states were still the most costly states. More studies are needed to examine whether this pattern occurs in the unexplained cost for other surgical procedures and also the role of hospital bed availability in relation to cross-state cost variation.
Transparency
Declaration of funding
Travel for this study was funded by Merck & Company.
Declaration of financial/other relationships
H.Y. has disclosed that she received funding from Merck for travel expenses to the conference where this research was presented. H.Y. contributed to the research design, data analysis, and manuscript writing. L.R. has disclosed that he is an employee of Merck and contributed to the research design, data interpretation, and manuscript writing. S.X.K. has disclosed that he is an employee of Nove Nordisk, and contributed to the research design, data interpretation, and manuscript writing.
Acknowledgments
This study was presented at the 33rd annual meeting of the Society for Medical Decision Making in Chicago, IL.
References
- Wrobel JS, Mayfield JA, Reiber GE. Geographic variation of lower-extremity major amputation in individuals with and without diabetes in the Medicare population. Diabetes Care 2001;24:860-4
- United States Congress Budget Office. Geographic variation in health care spending. Congress of the United States, Congressional Budget Office, Washington, DC. 2008
- Gottlieb DJ, Zhou W, Song Y, et al. Prices don’t drive regional Medicare spending variations. Health Aff 2010;29:537-43
- Hamalainen H, Ronnemaa T, Halonen JP, et al. Factors predicting lower extremity amputations in patients with type 1 or type 2 diabetes mellitus: a population-based 7-year follow-up study. J Intern Med 1999;246:97-103
- Boulton AJM, Vileikyte L, Ragnarson-Tennvall G, et al. The global burden of diabetic foot disease. Lancet 2005;366:1719-24
- Centers for Disease Control and Prevention. Data and trends: National diabetes surveillance system, vol. 2006. Atlanta, GA: National Center for Chronic Disease Prevention and Health Promotion, 2005
- Mountford WK, Soule JB, Lackland DT, et al. Diabetes-related lower extremity amputation rates fall significantly in South Carolina. South Med J 2007;100:787-90
- O’Brien J, Ward A, Salas M. Managing diabetic foot ulcers: economic consequences in the USA. Expert Rev Pharmacoecon Outcomes Res 2003;3:25-32
- O’Brien JA, Patrick AR, Caro J. Estimates of direct medical costs for microvascular and macrovascular complications resulting from type 2 diabetes mellitus in the United States in 2000. Clin Ther 2003;25:1017-38
- Gordois A, Scuffham P, Shearer A, et al. The health care costs of diabetic peripheral neuropathy in the US. Diabetes Care 2003;26:1790-5
- Gerdtham UG, Clarke P, Hayes A, et al. Estimating the cost of diabetes mellitus-related events from inpatient admissions in Sweden using administrative hospitalization data. Pharmacoeconomics 2009;27:81-90
- United States Government Accountability Office. Federal employees’ health benefit program: competition and other factors linked to wide variation in health care prices. United States Government Accountability Office, Washington, DC. 2005
- Nationwide Inpatient Sample (NIS). Healthcare Cost and Utilization Project (HCUP). 2007. Agency for Health Research and Quality. Rockville, MD. [article online]. www.hcup-us.ahrq.gov/nisoverview.jsp. Accessed January 15, 2012
- Kong SX, Hatoum HT, Zhao SZ, et al. Prevalence and cost of hospitalization for gastrointestinal complications related to peptic ulcers with bleeding or perforation: comparison of two national databases. Am J Manag Care 1998;4:399-409
- The Kaiser Family Foundation. State Health Facts. 2007. The Kaiser Family Foundation, Washington, DC. [article online]. http://www.statehealthfacts.org/compare.jsp. Accessed December 5, 2011
- Makarov DV, Loeb S, Landman AB, et al. Regional variation in total cost per radical prostatectomy in the healthcare cost and utilization project nationwide inpatient sample database. J Urol 2010;183:1504-509
- Bamezai A, Zwanziger J, Melnick GA, et al. Price competition and hospital cost growth in the United States (1989–1994). Health Econ 1999;8:233-43