Abstract
Objective:
The objective of this analysis was to estimate the cost-effectiveness of exenatide once weekly (EQW) for the treatment of type two diabetes mellitus (T2DM) in Spain. EQW was compared against exenatide twice daily (EBID) and insulin glargine (IG).
Methods:
The IMS CORE Diabetes Model was used to project clinical and economic outcomes for patients with T2DM treated with EQW, EBID, and IG. Treatment effects and patient baseline characteristics were taken from the DURATION 3 and pooled DURATION 1 and 5 studies, in the comparison against IG and EBID, respectively. Unit costs and health state utility values were derived from published sources. To reflect diabetes progression, patients started on EQW or EBID, switching to insulin glargine after 3 years. The analysis was conducted from the perspective of the Spanish National Health Service over a time horizon of 35 years with costs and outcomes discounted at 3%. The base case included patients with a BMI > 30 kg/m2, which is in line with current prescription restrictions in Spain. Uncertainty was addressed through extensive one-way sensitivity analyses around key model parameters and a comprehensive probabilistic sensitivity analysis.
Results:
When compared with EBID, EQW was the dominant strategy, i.e., less costly and more effective. When compared to IG, the incremental cost-effectiveness ratio was estimated at €12,084 per QALY gained. Sensitivity analysis indicated that the model projections were robust to the various scenarios tested.
Limitations:
Primary limitations of the analysis are common to other T2DM analyses and include the extrapolation of short-term clinical data to the 35 year time horizon and uncertainty around optimum treatment durations.
Conclusion:
The analyses indicate that EQW is a cost-effective option for the treatment of T2DM patients in Spain for patients with a BMI > 30 kg/m2 considering a willingness-to-pay threshold of €30,000 per QALY gained.
Introduction
Diabetes is increasingly prevalent in Western society affecting up to 11.63% of adults at any one timeCitation1. The majority of diabetes patients (∼90%) will suffer from type 2 diabetes mellitus (T2DM), a condition that is often under-reported, with the American Diabetes Association estimating that about one third of individuals with diabetes are unaware that they have the diseaseCitation2,Citation3. T2DM historically occurs in people older than 40 years and the incidence increases with age with T2DM affecting more than 25% of people aged over 65 yearsCitation4. However, as society is becoming increasingly obese and children are increasingly subject to poor diet and sedentary lifestyles, T2DM often arises at a younger ageCitation5–7. A recent study carried out in Spain estimating both known and undiagnosed rates of diabetes reported an important increase in the prevalence of T2DM among people aged 18 years and older. Overall prevalence was estimated at 13.8%, of which about half had unknown diabetes (6%)Citation8. Further, the Eurostat data indicate that, in Spain, the death rate associated with T2DM is now estimated at 11.8 per 100,000 inhabitantsCitation9.
The high prevalence and the socio-economic consequences of T2DM make this disease an important public health concern. The life expectancy of patients with diabetes can be reduced by up to 10 years compared to the general population, mainly due to the increased risk of cardiovascular death and strokeCitation10,Citation11. The total annual health cost per patient with diabetes from a societal perspective in Spain was estimated to be €4278 (of which €2504 were direct costs) (1999 values)Citation12. The management of T2DM-related complications is the major underlying cost driver, with half of diabetes-related medical expenditure attributed to hospital inpatient careCitation13–15. Improving glycaemic control and other cardiovascular risk factors can substantially reduce the risk of diabetes-related complicationsCitation16,Citation17 and associated costsCitation18–22.
Exenatide is a glucagon-like peptide-1 (GLP-1) receptor agonist and is currently approved for twice-daily (EBID) and once weekly (EQW) administrationCitation23. Recent clinical studies conducted as part of the DURATION clinical trial programme have shown that EQW improved glycaemic control compared with exenatide BID, with a similar reduction in body weightCitation24,Citation25 and resulted in improvement in glycaemic control compared to sitagliptin, pioglitazone, and insulin glargine (IG)Citation26,Citation27.
The objective of this study was to assess the cost-effectiveness of EQW when compared to EBID and IG for the treatment of T2DM patients with a body mass index (BMI) ≥ 30 kg/m2 in Spain. This base case is in line with the current restriction for prescription in Spain.
Methods
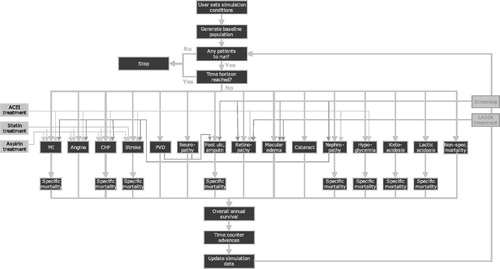
The IMS Centre for Outcomes Research (CORE) Diabetes Model was used to assess the long-term clinical and economic outcomes of the interventions (). This model is a robust and well-established simulation model validated against results from both clinical and epidemiological studiesCitation28,Citation29. Analyses were conducted for the two comparisons of interest. Patient characteristics (including the prevalence of diabetes complications) and treatment parameters are described in detail below. The analyses were conducted from the perspective of the Spanish National Health Service, as it represents the main audience for economic evaluations of healthcare technologies, which are predominantly financed with public funds. Consequently, the analyses captured all relevant direct medical costs (pharmacy costs plus complication and management costs). The patient population comprised patients with T2DM and reflected the RCT trial populations on which the analyses were based. Spanish-specific unit cost data were used with an emphasis on costs derived from diabetes-specific sources where possible. Unit costs were reported in 2012 values, inflated when necessary, using the Consumer Price Index published by the Spanish National Statistics InstituteCitation30. Health state utilities were estimated based on published dataCitation31–40 and are described in detail below. Given the chronic nature of T2DM, a lifetime horizon representing 35 years or death, whichever came first, was used in the analysis. Spanish recommendations on the economic evaluation of health technologies were followed throughout model developmentCitation39. The model output was in the form of estimated incremental cost-effectiveness ratios (ICERs). Costs and benefits were both discounted at 3% annually in accordance with Spanish guidelinesCitation41.
Figure 1. Diagrammatic representation of the IMS CORE diabetes model. Figure from Palmer et al.Citation27 (IMS Health is the owner of the CORE Diabetes Model).
Baseline characteristics of patients
Exenatide twice daily comparison
The baseline patient cohort was defined according to data from the DURATION 1 and 5 studies where EQW was compared against EBIDCitation42,Citation43. Although both studies showed a superior reduction in glycated haemoglobin (HbA1c) with EQW therapy compared to EBID therapy, the magnitude of the difference in HbA1c between the two studies differed. There was no strong rationale for selecting the results from one study over another and, therefore, the data from the two studies were pooled. Pooling was considered appropriate as the studies were similar in terms of participants (inclusion and exclusion criteria identical), treatments (intensity, dose, duration, mode of administration were all similar), outcomes (HbA1c was re-defined at same time point for pooling), design (parallel RCTs), and conduct (allocation, concealment, and analysis methods).
Insulin Glargine comparison
The baseline cohort was defined according to data from DURATION 3, where EQW was compared with IGCitation44. However, baseline rates of diabetes complications were not reported in DURATION 3, therefore the rates reported in the combined DURATION 1 and 5 data were used. This was considered appropriate as these studies were from a similar patient population (i.e., patients who have failed on up to two oral anti-diabetes drugs, OADs).
Other patient characteristics such as the proportion of smokers or the weekly average alcohol consumption were derived from official European statistics sourcesCitation1. Baseline characteristics can be found in . reports the modelled rates of baseline diabetes complications.
Table 1. Baseline characteristics of analysis cohort (Mean, SD).
Table 2. Diabetes complications at baseline.
Treatment effects
Treatment effects associated with the three treatments were drawn from the efficacy and safety data from the respective clinical trialsCitation24,Citation43,Citation45. Changes in HbA1c, systolic blood pressure (SBP), total cholesterol (TC), high density lipoprotein (HDL)-cholesterol, low density lipoprotein (LDL)-cholesterol, and triglycerides were simulated along with changes in BMI and hypoglycaemic events, as listed in .
Table 3. Treatment effects from DURATION 1 and 5 (pooled) and DURATION 3 (Mean change from baseline, SD).
T2DM is a chronic and progressive disease; glycaemic control typically worsens over timeCitation46 and it is likely that patients on EQW or EBID will need to intensify their treatment regime at some pointCitation47. Treatment guidelines address this by recommending stepwise intensification of treatment from monotherapy with OADs through to insulin therapyCitation48–50. Therefore, in the model it was assumed that patients do not remain on their initial therapy for the entire duration of the analysis. A common starting regimen for insulin is the initiation of long-acting insulinCitation51. In order to reflect usual clinical practice, after 3 years of initial treatment both exenatide treatment groups were switched to insulin glargine.
In the model the treatment effect was applied in the first year of treatment. In subsequent years, the UK Prospective Diabetes Study (UKPDS) regression approachCitation42 was applied to predict the progression of HbA1c over the course of the simulation. The level of HbA1c was determined for each year according to patient baseline HbA1c, as reported in each of the DURATION clinical trials, and the duration of diabetes as reported in the UKPDS Outcomes Model, which represents the natural progression of HbA1c within the UKPDS cohort. For BMI progression, the respective weight change estimates were applied at the beginning of the simulations, and then it was assumed that patients regained their baseline weight at the initiation of insulin. Note that the switch to insulin glargine results in an initial expected weight gain which is applied across both interventions.
Health state utilities and disutilities
For T2DM and its complications, health state utilities for the model were derived wherever possible from the UKPDSCitation52, supplemented with data from other sources as necessary ().
Table 4. Health state utilities and disutilities.
Nausea disutility was applied within the model based on nausea rates observed in the DURATION clinical trials. In the EBID analysis, 26.0% of patients treated with EQW and 38.9% of patients treated with EBID experienced transient nausea (data from the DURATION 1 and 5 trials); in the glargine analysis, 12.9% of patients treated with EQW and 1.3% of patients treated with insulin glargine experienced transient nausea (data from the DURATION 3 trial). The disutility for nausea (−0.04) was taken from the Matza et al.Citation53 study. Evidence suggests that nausea incidence decreases over timeCitation54, the model reflects this and the disutility was applied to the affected patients only for the first 6 months of the analysis period.
Cost data
The annual therapy cost included the drug costs, based on established or reported dosing regimensCitation55–58 and the blood glucose monitoring cost, detailed in and . Needles and lancets were assumed to have zero cost. The self-blood glucose monitoring frequency used in the model follows that recommended by Owens et al.Citation59. For patients using OAD regimens which include sulphonylurea, 3-times weekly monitoring is recommended; for regimens including basal insulin, daily monitoring is recommended. No monitoring is required for patients using OAD regimens that do not include sulphonylurea. During monitoring, it was assumed that patients use a new strip for each blood glucose test.
Table 5. Annual drug costs.
Table 6. Self-blood-glucose monitoring cost.
Spanish-specific unit cost data were used throughout, as listed in . Emphasis was placed on the use of costs derived from diabetes-specific sources where possible and in line with published evidence that the cost of treating complications in patients with diabetes may well be higher than in the general populationCitation60. Minor hypoglycaemia was assumed to have zero cost.
Table 7. Complication and management-related costs.
Handling uncertainty
A comprehensive series of one-way sensitivity analyses were conducted to assess the robustness of model outcomes to plausible changes in key model parameters. These were conducted both on cost and effectiveness parameters. The effectiveness parameters assessed were: the changes from baseline in HbA1c, weight and SBP (varied by trial-reported upper and lower 95% confidence intervals), utilities (scenarios described below), time-horizon (10 and 20 years), discount rate (0% and 6%), time on treatment (5 and 10 years), and complication and treatment-related costs (±20%).
The effect of treatment-related utilities was explored in a series of scenario analyses. Variation 1 included application of injection site reaction disutility (0.011) which was derived from Boye et al.Citation61, applied for patient lifetimes for affected patients. The percentage of patients affected was assumed to be the percentage of patients in each treatment group with injection site reaction as an adverse event in the respective DURATION trial. Variation 2 included injection site reaction disutility as in Variation 1, together with dose flexibility utility (0.006) applied to both treatments, and dose frequency utility for once-weekly administration (0.023) applied for as long as patients remained on EQW treatment. These were also derived from Boye et al.Citation61. Variation 3 considered a utility change related to body weight derived from Matza et al.Citation62, rather than from BagustCitation63 as in the base case. Variation 4 considered only health-state utilities related to complications (no treatment-related utilities or disutilities applied).
Probabilistic sensitivity analysis (PSA) was performed using a non-parametric bootstrapping approach in which the progression of diabetes was simulated in a cohort of 25,000 patients, repeated 500-times to calculate the mean and standard deviation (SD) for costs, life expectancy, and quality-adjusted life expectancy. Results from the 500 iterations were used to generate scatter plot diagrams and cost-acceptability curves comparing the two treatment regimens included in each comparison.
Results
EQW vs EBID: base-case analysis
In the base case analysis, treatment with EQW was projected to increase quality-adjusted life expectancy vs treatment with EBID. EQW was the dominant strategy, i.e., more effective and less costly. EQW was associated with a lower cumulative incidence of almost all simulated complications. Stroke (event and death) were the only exception. A breakdown of lifetime costs is provided in . The model predicts that the difference in acquisition costs of €889 is offset by the reduction in costs associated with complications.
Table 8. Base-case and sensitivity analysis results: EQW vs EBID.
Table 9. Base-case results (EQW vs EBID): Breakdown of cost differences.
Sensitivity analyses
For nearly all the scenarios considered, EQW remained the dominant strategy. The exceptions were when a 10-year time horizon was tested and when a 10-year treatment duration was assumed (). When the lower limits of the confidence intervals were used as model inputs for efficacy, EQW was still expected to be dominant. The only exception was when the 95% upper confidence interval for HbA1c was applied.
Probabilistic sensitivity analyses
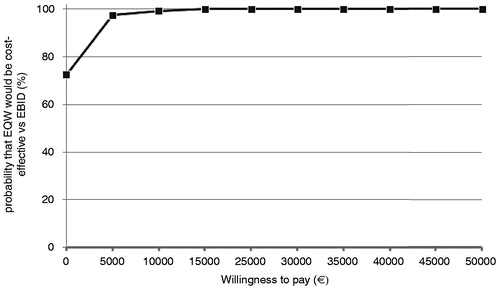
It was observed that 72.6% of the cost-effectiveness pairs fell in the south east quadrant of the cost-effectiveness plane, indicating that EQW was expected to be the dominant strategy in the majority of the simulations (). The cost-effectiveness acceptability curve (CEAC) shows that EQW is expected to have a 100% probability of being cost-effective for almost all threshold levels considered ().
Figure 2. Cost-effectiveness plane (EQW-EBID). EQW, exenatide once weekly; EBID, exenatide twice daily; QALY, Quality adjusted life year.
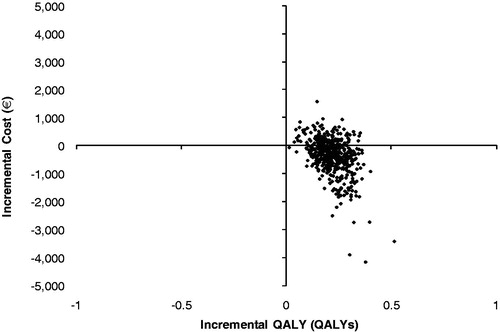
Figure 3. Cost-effectiveness acceptability curve (EQW-EBID). EQW, exenatide once weekly; EBID, exenatide twice daily.
EQW vs insulin glargine: base-case analysis
Treatment with EQW was projected to increase quality-adjusted life expectancy vs treatment with insulin glargine. The cumulative incidence of diabetes-related complications was also lower in the EQW arm. However, EQW was the more costly strategy, resulting in an estimated incremental cost per quality-adjusted life year of €12,084 ().
Table 10. Base-case results: EQW vs IG.
Table 11. Base-case results (EQW vs IG): Breakdown of cost differences.
Sensitivity analyses
EQW remained more effective and more costly across all the scenarios tested, but resulting ICERs were within acceptable bounds of cost-effectiveness. The results were most sensitive to variations in effectiveness values, the time on initial treatment and the time-horizon of the analysis, with estimated ICERs ranging from €7867–€33,450 per QALY gained. The incremental differences in effectiveness were kept constant when different times on treatment were tested. However, in these scenarios higher ICERs were obtained given the expected increase in the incremental costs. The latter were mainly driven by the higher costs of treatment in the EQW arm. The variation in management costs had little impact on the cost-effectiveness results.
Probabilistic sensitivity analysis
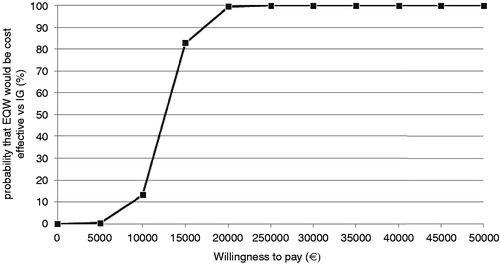
It was observed that nearly 100% of the simulations fell in the north-east quadrant of the cost-effectiveness plane, indicating that EQW was projected to be the more effective but at the same a time more costly treatment than insulin glargine (). The cost-effectiveness acceptability curve (CEAC) shows that EQW was expected to have a 99.4% probability of being cost-effective at a willingness to pay threshold of €20,000 per QALY gained ().
Figure 4. Cost-effectiveness plane (EQW-IG). EQW, exenatide once weekly; IG, insulin glargine; QALY, Quality-adjusted life year.
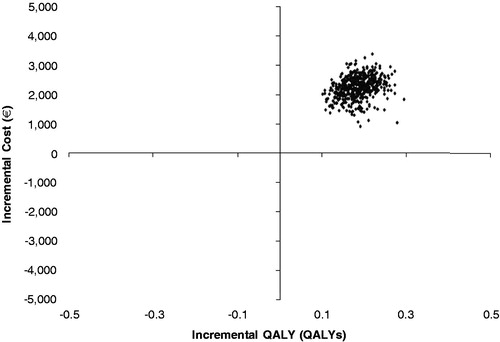
Figure 5. Cost-effectiveness acceptability curve (EQW-IG). EQW, exenatide once weekly; IG, insulin glargine.
Discussion
A comprehensive clinical trial programme has been undertaken to demonstrate the relative effectiveness of EQW against available comparatorsCitation30,Citation3,Citation64–66. The current analysis used a sub-set of the data from the combined DURATION 1 and 5 for EQW vs EBID and DURATION 3 for EQW vs IG comprising those patients with a baseline BMI ≥ 30 kg/m2. In all three trials there was a significant reduction in HbA1c from baseline for EQW. In addition to this, for the DURATION 1 and 5 trials, patients in both treatment arms experienced a reduction in body weight and similar rates of hypoglycaemia were seen.
When compared to EBID, treatment with EQW was found to be the dominant strategy, i.e., more effective and less costly. Patients in the EQW arm were associated with an improvement in life-expectancy and quality-of-life at a lower cost. EQW was associated with a lower cumulative incidence of almost all simulated complications. Stroke events were the exception, with higher cumulative incidence predicted in the EQW arm. This can perhaps be explained by the survival paradox whereby patients in the EQW group had a longer life expectancy and were, therefore, exposed to the risk of stroke for a longer period of time—stroke risk is driven largely by age and not by markers of glycaemic controlCitation67.
The results were robust across the majority of changes in parameters tested in the sensitivity analyses, with EQW being the dominant strategy in almost all the scenarios tested. The only exceptions were when an analysis time horizon of 10 years was tested, when 10 years on treatment was assumed (the base case assumption being limited to 3 years), and when the upper limit of the HbA1c effect was used to define efficacy. The impact of longer duration of treatment was higher cost but, even with this, the generated ICER was low (€5896 per QALY gained), suggesting that even at the outside of plausible treatment limits, EQW would still be considered cost-effective. The time horizon result is expected, however, given the chronic nature of the disease, outcomes are better captured in longer time horizons, ideally life-time, so shorter horizons are not applicable. The result of the HbA1c analysis suggests that, even at the outside of the plausible limit of treatment effect, EQW would remain cost-effective with an ICER of €7752 per QALY, although no longer dominant.
In the base case analyses performed against IG, the model predicted that EQW resulted in better outcomes and higher costs than IG, with an estimated ICER of €12,084 per QALY gained. Higher pharmacy costs were partially offset by lower complications costs. This can, in part, be explained by the fact that the model predicted that IG-treated patients would have complications on average 3 months before those treated with EQW.
The model was robust across the majority of assumptions, with the cost per QALY gained being between €7867–€29,935 for the vast majority of simulations, under the assumed €30,000 per QALY cost-effectiveness threshold. The exception to this was the 10-year time horizon simulation.
There are a limited number of studies conducted in the Spanish setting with which to compare the outcome of these analyses. While not directly comparable, a previous analysis conducted by Goodall et al.Citation68 to estimate the cost-effectiveness of EBID vs IG resulted in a similar magnitude of cost-effectiveness ratio. In this analysis, EBID was projected to have an incremental cost-effectiveness ratio of €15,068 per QALY gained vs IGCitation69 compared against our current EQW estimate of €12,084 per QALY gained relative to IG.
PSA results suggest that, despite uncertainty, EQW is expected to be a cost-effective option, with nearly 100% probability of being cost-effective assuming a willingness-to-pay threshold of €30,000 per QALY gainedCitation70.
Limitations
As with any cost-effectiveness model, in the absence of life-time data, several assumptions had to be made in order to extrapolate the available short-term clinical trial figures. For example, within the model, short-term intermediate end-points (HbA1c, systolic blood pressure, lipids, and BMI) were used to project long-term outcomes such as death, cardiovascular, renal, and ocular complications. Given the chronic nature of T2DM and the pressing need to develop better interventions to treat the disease, it is not practical to fully evaluate these outcomes by the time of regulatory approval. Computer simulation modelling remains the best option currently available to estimate the clinical and economic consequences of therapeutic interventions in the medium- to long-term. No model can claim to be perfectly accurate, but the IMS CORE Diabetes Model is one of the few models currently available with published validations that demonstrate the reliability of outcomesCitation26,Citation27.
There remain a number of limitations regarding both specific parameters included in these analyses and the general application of DURATION trial data to a country-specific analysis. For the sake of consistency, some non-significant changes in treatment effect parameters were included in the modelling analyses. However, extensive sensitivity analyses were undertaken to identify the role of each treatment effect parameter. A further potential limitation is that, at this stage in the clinical development process, the optimum treatment duration of EQW is unclear. Additional research will best inform this issue, but at the moment a pragmatic evidence-based approach to treatment duration was assumed and the impact was fully explored in sensitivity analyses. The results should, however, be viewed in context of the broader data limitations, in that data from a series of global heterogeneous trial populations were applied in an analysis pertaining to a Spanish population. Full disclosure of the characteristics of patients included in the trials does, however, allow readers to assess the generalizability of the analysis findings to their own patient populations.
Diabetes is a chronic and progressive disease and many T2DM patients will eventually need daily injections of insulinCitation71. A common starting regimen is with long acting insulin such as insulin glargine, but some patients will eventually require short-acting insulin injection before mealsCitation72. This element was not considered in the current set of simulations, since data were not available to inform an accurate estimation of long-term expected use of short-acting insulin. Longer-term clinical data for EQW regarding efficacy and safety and duration of treatment effect would improve the current modelling analysis.
Conclusions
This analysis indicated that, in a Spanish setting, EQW would be considered a dominant treatment option vs EBID and a cost-effective treatment option vs insulin glargine in T2D patients with a BMI ≥ 30 kg/m2 assuming a threshold of €30,000 per QALY gained.
Transparency
Declaration of funding
This study was funded by Eli Lilly and company Limited.
Declaration of financial/other relationships
TF and GC serve as paid consultants for IMS Health. KN is an employee of and has received sponsorship from Eli Lilly Finland, and owns stock in the company. TD and MA are employees of and have received sponsorship from Eli Lilly Spain, and own stock in the company. JC has no conflicts of interest.
References
- World Health Organisation (WHO). European Health for all database. American Diabetes Association, 2003. http://data.euro.who.int/hfadb. Accessed July 10, 2011
- Hogan P, Dall T, Nikolov P. Economic costs of diabetes in the US in 2002. Diabetes Care 2003;26:917-32
- Harris MI, Flegal KM, Cowie CC, et al. Prevalence of diabetes, impaired fasting glucose, and impaired glucose tolerance in U.S. adults. The Third National Health and Nutrition Examination Survey, 1988–1994. Diabetes Care 1998;21:518-24
- National Diabetes Fact Sheet. Centers for Disease Control and Prevention. http://www.cdc.gov/diabetes/pubs/factsheet11.htm?loc=diabetes-statistics. Accessed July 2012
- Molnar D. The prevalence of the metabolic syndrome and type 2 diabetes mellitus in children and adolescents. Int J Obes Relat Metab Disord 2004;28(3 Suppl):S70-4
- Mooy JM, Grootenhuis PA, de VH, et al. Prevalence and determinants of glucose intolerance in a Dutch caucasian population. The Hoorn Study. Diabetes Care 1995;18:1270-3
- Pinhas-Hamiel O, Zeitler P. The global spread of type 2 diabetes mellitus in children and adolescents. J Pediatr 2005;146:693-700
- Soriguer F, Goday A, Bosch-Comas A, et al. Prevalence of diabetes mellitus and impaired glucose regulation in Spain: the [email protected] Study. Diabetologia 2012;55:88-93
- Eurostat. Public Health Portal. http://epp.eurostat.ec.europa.eu/. Accessed July 20, 2011
- Almdal T, Scharling H, Jensen JS, et al. The independent effect of type 2 diabetes mellitus on ischemic heart disease, stroke, and death: a population-based study of 13,000 men and women with 20 years of follow-up. Arch Intern Med 2004;164:1422-6
- Roper NA, Bilous RW, Kelly WF, et al. Excess mortality in a population with diabetes and the impact of material deprivation: longitudinal, population based study. BMJ 2001;322:1389-93
- Ballesta M, Carral F, Olveira G, et al. Economic cost associated with type II diabetes in Spanish patients. Eur J Health Econ 2006;7:270-5
- Ballesta M, Carral F, Olveira G, et al. Economic cost associated with type II diabetes in Spanish patients. Eur J Health Econ 2006;7:270-5
- Mata M, Antonanzas F, Tafalla M, et al. [The cost of type 2 diabetes in Spain: the CODE-2 study]. Gac Sanit 2002;16:511-20
- Oliva J, Lobo F, Molina B, et al. Direct health care costs of diabetic patients in Spain. Diabetes Care 2004;27:2616-21
- Gaede P, Vedel P, Larsen N, et al. Multifactorial intervention and cardiovascular disease in patients with type 2 diabetes. N Engl J Med 2003;348:383-93
- The UK Prospective Diabetes Study Group. Intensive blood-glucose control with sulphonylureas or insulin compared with conventional treatment and risk of complications in patients with type 2 diabetes (UKPDS 33). Lancet 1998;352:837-53
- Clarke PM, Gray AM, Briggs A, et al. Cost-utility analyses of intensive blood glucose and tight blood pressure control in type 2 diabetes (UKPDS 72). Diabetologia 2005;48:868-77
- United Kingdom Prospective Diabetes Study Group. Cost effectiveness analysis of improved blood pressure control in hypertensive patients with type 2 diabetes: UKPDS 40. BMJ 1998;317:720-6
- Gray A, Raikou M, McGuire A, et al. Cost effectiveness of an intensive blood glucose control policy in patients with type 2 diabetes: economic analysis alongside randomised controlled trial (UKPDS 41). United Kingdom Prospective Diabetes Study Group. BMJ 2000;320:1373-8
- White JR, Jr. Economic considerations in treating patients with type 2 diabetes mellitus. Am J Health Syst Pharm 2002;59(9 Suppl):S14-17
- Wagner EH, Sandhu N, Newton KM, et al. Effect of improved glycemic control on health care costs and utilization. JAMA 2001;285:182-9
- Exenatide (Byetta) Summary of Product Characteristics. 2012. http://www.ema.europa.eu/docs/en_GB/document_library/EPAR_-_Product_Information/human/000698/WC500051845.pdf. Accessed October 9, 2012
- Blevins T PJMJeal DURATION-5: exenatide once weekly resulted in significantly greater improvement in glycemic control with less nausea than exenatide twice daily in patients with type 2 diabetes. Am Diabetes Assoc Annu Meet 2010;Abstract 0008-LB
- Drucker DJ, Buse JB, Taylor K, et al. Exenatide once weekly versus twice daily for the treatment of type 2 diabetes: a randomised, open-label, non-inferiority study. Lancet 2008;372:1240-50
- Bergenstal RM, Wysham C, MacConell L, et al. Efficacy and safety of exenatide once weekly versus sitagliptin or pioglitazone as an adjunct to metformin for treatment of type 2 diabetes (DURATION-2): a randomised trial. Lancet 2010;376:431-9
- Diamant M, Van GL, Stranks S, et al. Once weekly exenatide compared with insulin glargine titrated to target in patients with type 2 diabetes (DURATION-3): an open-label randomised trial. Lancet 2010;375:2234-43
- Palmer AJ, Roze S, Valentine WJ, et al. The CORE Diabetes Model: projecting long-term clinical outcomes, costs and cost-effectiveness of interventions in diabetes mellitus (types 1 and 2) to support clinical and reimbursement mecision-making. Curr Med Res Opin 2004;20:5-26
- Palmer AJ, Roze S, Valentine W, et al. Validation of the CORE Diabetes Model against epidemiological and clinical studies. Curr Med Res Opin 2004;20:S27-S40
- Drucker DJ, Buse JB, Taylor K, et al. Exenatide once weekly versus twice daily for the treatment of type 2 diabetes: a randomised, open-label, non-inferiority study. Lancet 2008;372:1240-50
- Clarke P, Gray A, Holman R. Estimating utility values for health states of type 2 diabetic patients using the EQ-5D (UKPDS 62). Med Decis Making 2002;22:340-9
- Tengs TO, Wallace A. One thousand health-related quality-of-life estimates. Med Care 2000;38:583-637
- Wasserfallen JB, Halabi G, Saudan P, et al. Quality of life on chronic dialysis: comparison between haemodialysis and peritoneal dialysis. Nephrol Dial Transplant 2004;19:1594-9
- Tengs TO, Wallace A. One thousand health-related quality-of-life estimates. Med Care 2000;38:583-637
- Sharma S, Oliver-Fernandez A, Bakal J, et al. Utilities associated with diabetic retinopathy: results from a Canadian sample. Br J Ophthalmol 2003;87:259-61
- Lansingh VC, Carter MJ. Use of Global Visual Acuity Data in a time trade-off approach to calculate the cost utility of cataract surgery. Arch Ophthalmol 2009;127:1183-93
- Lloyd A, Nafees B, Gavriel S, et al. Health utility values associated with diabetic retinopathy. Diabet Med 2008;25:618-24
- Redekop WK, Stolk EA, Kok E, et al. Diabetic foot ulcers and amputations: estimates of health utility for use in cost-effectiveness analyses of new treatments. Diabetes Metab 2004;30:549-56
- Currie CJ, Morgan CL, Poole CD, et al. Multivariate models of health-related utility and the fear of hypoglycaemia in people with diabetes. Curr Med Res Opin 2006;22:1523-34
- Bagust A, Beale S. Modelling EuroQol health-related utility values for diabetic complications from CODE-2 data. Health Econ 2005;14:217-30
- Lopez BJ, Oliva J, Antonanzas F, et al. [A proposed guideline for economic evaluation of health technologies]. Gac Sanit 2010;24:154-70
- Buse JB, Drucker DJ, Taylor KL, et al. DURATION-1: exenatide once weekly produces sustained glycemic control and weight loss over 52 weeks. Diabetes Care 2010;96:1301-10
- Blevins 5, Pullman J, Malloy J, et al. DURATION 5: exenatide once weekly resulted in greater improvements in glycemic control compared with exenatide twice daily in patients with type 2 diabetes. J Clin Endocrinol Metab 2011;96:1301-10
- Diamant M, Van GL, Stranks S, et al. Once weekly exenatide compared with insulin glargine titrated to target in patients with type 2 diabetes (DURATION-3): an open-label randomised trial. Lancet 2010;375:2234-43
- Drucker DJ, Buse JB, Taylor K, et al. Exenatide once weekly versus twice daily for the treatment of type 2 diabetes: a randomised, open-label, non-inferiority study. Lancet 2008;372:1240-50
- Clarke PM, Gray AM, Briggs A, et al. A model to estimate the lifetime health outcomes of patients with Type 2 diabetes: the United Kingdom Prospective Diabetes Study (UKPDS) Outcomes Model (UKPDS no. 68). Diabetologia 2004;47:1747-59
- UKPDS Group. U.K. Prospective Diabetes Study 16. Overview of 6 years' therapy of type II diabetes: a progressive disease. Diabetes 1995;44:1249-58
- Ministerio de Sanidad. Estrategia en Diabetes del SNS. Sanidad 2007. Ministerio de Sanidad y Consumo, 2007
- International Diabetes Federation. Global guidelines for type 2 diabetes: Chapter 9: glucose control: oral therapy. 2005
- American Diabetes Association. Standards of medical care in diabetes. Diabetes Care 2006;29(1 Suppl):S4-S42
- Costi M, Dilla T, Reviriego J, et al. Clinical characteristics of patients with type 2 diabetes mellitus at the time of insulin initiation: INSTIGATE observational study in Spain. Acta Diabetol 2010;47:169-75
- Clarke P, Gray A, Holman R. Estimating utility values for health states of type 2 diabetic patients using the EQ-5D (UKPDS 62). Med Decis Making 2002;22:340-9
- Matza LS, Boye KS, Yurgin N, et al. Utilities and disutilities for type 2 diabetes treatment-related attributes. Qual Life Res 2007;16:1251-65
- Buys LM, Elliot ME. Osteoarthritis. In: DiPiro JT, Talbert RL, Yee GC, Matzke GR, Wells B, Posey LM, eds. Pharmacotherapy: a pathophysiologic approach. 8th edn. New York: McGraw-Hill, 2011
- Exenatide (Byetta) Summary of Product Characteristics. 2012. http://www.ema.europa.eu/docs/en_GB/document_library/EPAR_-_Product_Information/human/000698/WC500051845.pdf. Accessed October 9, 2012
- Exenatide once weekly (Bydureon) Summary of Product Characteristics. 2011. http://www.ema.europa.eu/docs/en_GB/document_library/EPAR_Product_Information/human/002020/WC500108241.pdf. Accessed October 4, 2012
- WHO. DDD for insulin glargine. http://www.whocc.no/atc_ddd_index/?code=A10AE04. Accessed October 9, 2012
- Diamant M, Van GL, Stranks S, et al. Once weekly exenatide compared with insulin glargine titrated to target in patients with type 2 diabetes (DURATION-3): an open-label randomised trial. Lancet 2010;375:2234-43
- Owens DR. Blood glucose self-monitoring in type 1 and type 2 diabetes: reaching a multidisciplinary cocensus. Diabetes and Primary Care 2004;6(1)
- Clarke P, Gray A, Legood R, et al. The impact of diabetes-related complications on healthcare costs: results from the United Kingdom Prospective Diabetes Study (UKPDS Study No. 65). Diabet Med 2003;20:442-50
- Boye KS, Matza LS, walters K, et al. Utilities and disutilities for attributes of injectable treatments for Type 2 Diabetes. Eur J Health Econ 2011;12:219-30
- Matza LS, Boye KS, Yurgin N, et al. Utilities and disutilities for type 2 diabetes treatment-related attributes. Qual Life Res 2007;16:1251-65
- Bagust A, Beale S. Modelling EuroQol health-related utility values for diabetic complications from CODE-2 data. Health Econ 2005;14:217-30
- Buse JB, Drucker DJ, Taylor KL, et al. DURATION-1: exenatide once weekly produces sustained glycemic control and weight loss over 52 weeks. Diabetes Care 2010;33:1255-61
- Diamant M, Van GL, Stranks S, et al. Once weekly exenatide compared with insulin glargine titrated to target in patients with type 2 diabetes (DURATION-3): an open-label randomised trial. Lancet 2010;375:2234-43
- Bergenstal RM, Wysham C, MacConell L, et al. Efficacy and safety of exenatide once weekly versus sitagliptin or pioglitazone as an adjunct to metformin for treatment of type 2 diabetes (DURATION-2): a randomised trial. Lancet 2010;376:431-9
- Kothari V, Stevens RJ, Adler AI, et al. UKPDS 60: risk of stroke in type 2 diabetes estimated by the UK Prospective Diabetes Study risk engine. Stroke 2002;33:1776-81
- Goodall G, Costi M, Timlin L, et al. [Cost-effectiveness of exenatide versus insulin glargine in Spanish patients with obesity and type 2 diabetes mellitus]. Endocrinol Nutr 2011;58:331-40
- Goodall G, Costi M, Timlin L, et al. [Cost-effectiveness of exenatide versus insulin glargine in Spanish patients with obesity and type 2 diabetes mellitus]. Endocrinol Nutr 2011;58:331-40
- Sacristan JA, Oliva J, Del Llano J, et al. What is an efficient health technology in Spain? Gac Sanit 2002;16:334-43
- National Institute for Health and Clinical Excellence. Clinical guidelines CG87. Type 2 Diabetes - newer agents (partial update of CG66). 5-1-2009.
- Canadian Diabetes Association. Canadian Diabetes Association 2008 clinical practice guidelines for the prevention and management of diabetes in Canada. Can J Diabetes 2008;32(Suppl 1):S1-201