Abstract
Objective:
The objective of the study was to conduct a systematic review of utility weight estimates relevant to economic models for wet age-related macular degeneration (wAMD).
Methods:
A systematic literature search of PubMed, Embase, the Cochrane Library, and EconLit was performed (January 1995–December 2010) and then updated (October 2010–May 2012; February 2012–July 2013) identifying articles reporting utilities in patients with wAMD and visual impairment. Extracted studies were also assessed for compliance with the NICE reference case.
Results:
Of 2415 articles identified from the searches, 212 articles were reviewed in full, and 17 selected for data extraction. Most studies used time trade-off (TTO) techniques to estimate utilities; other methods included standard gamble, EuroQoL Health Questionnaire 5 Dimensions (EQ-5D); Short-Form 6D Health Status Questionnaire (SF-6D); and Health Utilities Index Mark III (HUI3). Correlation between utility estimates and visual acuity (VA) differed between the instruments. Time trade-off methods were more sensitive to VA changes than standard gamble methods. HUI3 estimates were most highly correlated with VA changes, followed by TTO; no trend was observed between VA and EQ-5D or SF-6D utility weights. Six of the 17 studies complied with the NICE reference case.
Conclusions:
Several instruments have been used to elicit utilities from patients with wAMD. Because TTO methods were more sensitive to VA changes than standard gamble and HUI3 estimates were most highly correlated with VA changes, TTO and HUI3 may be suitable methods for economic evaluations in these patients. The EQ-5D and SF-6D were poor indicators of the impact of VA on HRQL.
Introduction
Wet age-related macular degeneration (wAMD) is a debilitating, progressive disease that leads to loss of the patient’s central field of vision and has a profound impact on their visual acuity (VA)Citation1. With progressive visual impairment, functionality, independence, and overall health-related quality-of-life (HRQL) are erodedCitation2. Early treatment can prevent severe vision loss and can improve and maintain VA, thus enabling patients to maintain HRQL, and avoiding the significant cost burden associated with visual impairment.
In many major healthcare markets, access to new interventions for wAMD is determined on the basis of cost-effectiveness. Patient benefit in these evaluations is commonly measured in terms of quality-adjusted life-years (i.e., the number of years of life in a given health state multiplied by the utility weight for that health state). Various methods have been used to estimate utility weights for wAMD. The objective of this study was to conduct a systematic review of utility-weight estimates relevant to economic models for wAMD.
Methods
Search strategy
A systematic literature search (January 1995–July 2013) of PubMed, Embase, the Cochrane Library, and EconLit was conducted to identify articles reporting utility weights in patients with wAMD and visual impairment. This formed part of a larger review of economic models and studies of cost and resource use. This paper focuses only on the utility review.
Search terms included terms related to wAMD and visual impairment; terms for utility studies, economic analyses, and resource-use and cost studies; and terms for interventions (relevant only for economic models), including aflibercept (vascular endothelial growth factor [VEGF] Trap-Eye, Eylea, Regeneron Pharmaceuticals, Inc., Tarrytown, NY), ranibizumab (Lucentis, Genentech USA, Inc., South San Francisco, CA), pegaptanib (Macugen, Eyetech, Inc., Bridgewater, NJ), bevacizumab (Avastin, Genentech USA, Inc., South San Francisco, CA), verteporfin (Visudyne, Novartis AG, Basel, Switzerland), photodynamic therapy (PDT), and laser photocoagulation ().
Table 1. Search terms.
The search was restricted to articles published between January 1995 and July 2013, and to studies conducted in humans. The search excluded studies conducted in animals and publications of the following types: comments, editorials, letters, or case reports.
In addition, the following conference websites were also searched from 2008 onward for relevant abstracts: American Academy of Ophthalmology; European Society of Ophthalmology; The National Eye Institute (National Institutes of Health); and International Society for Pharmacoeconomics and Outcomes Research’s (ISPOR) Research Digest.
Websites of the following organizations were also searched for health technology assessment (HTA) documentation relating to age-related macular degeneration (AMD): the UK’s National Institute for Health and Care Excellence (NICE) (http://www.nice.org.uk/); the Canadian Agency for Drugs and Technology in Health (http://www.cadth.ca/index.php/en/home); and the German Institute for Quality and Efficiency in Health Care (http://www.iqwig.de/projects-results.915.en.html). The utility-weight collection collated by Tufts New England Medical Center’s Catalogue of Preference Scores (https://research.tufts-nemc.org/cear/search/search.aspx) was also searched for relevant utility weights.
Study selection
The articles identified from each literature search were screened in two phases by one reviewer, using pre-defined inclusion and exclusion criteria. Phase 1 involved reviewing all the titles and abstracts to determine whether to include or exclude them, and Phase 2 involved reviewing the full-text articles to determine their inclusion or exclusion for data extraction based on the presence or absence of utility weights associated with wAMD. Specifically, articles were included in the overall review if they met all of the following inclusion criteria:
Reported patients with wAMD (including patients with submacular haemorrhage secondary to AMD);
Studies performed in Europe and the US;
Either utility studies for wAMD or VA health states or relevant adverse events; economic analyses of wAMD treatments, including economic models and analyses alongside clinical trials; or resource-use and cost studies (e.g., cost-of-illness estimates) relevant to wAMD, visual impairment, or any of the following adverse events: severe intraocular inflammation; retinal break and detachment; Stage 3 or 4 macular holes; endophthalmitis; traumatic injury to lens or lens damage; uveitis; vitreous haemorrhage; and
For economic analyses only, investigated aflibercept, ranibizumab, pegaptanib, bevacizumab, verteporfin PDT, or laser photocoagulation.
Articles were excluded if they met at least one of the following exclusion criteria:
Article was not a publication type of interest (i.e., was a review, letter, comment, or editorial article that discussed costs but in which cost estimates were not evidence-based);
Reported patients with any of the following: dry AMD (studies that did not report the type of AMD or that included mixed populations of wAMD and dry AMD were included); AMD of undefined stage or type; polypoidal choroidal vasculopathy; retinal vein occlusion-related macular oedema; chronic cystoid macular oedema; idiopathic macular telangiectasia; choroidal neovasculariztion (CNV) secondary to causes other than AMD; diabetic macular oedema; or neovascular secondary to central exudative chorioretinopathy;
For economic analyses, studies that did not include any of the interventions in the inclusion criteria list; utility, resource-use, and cost studies were not subject to inclusion and exclusion criteria for study interventions; or
For economic analyses and cost studies, articles outside of the US and Europe.
For the purposes of this manuscript, which focuses on utility studies, another level of review was applied in which the following articles were excluded:
Economic analyses;
Resource and cost studies;
Studies performing evaluations using the Short-Form 36-Item Health Survey (SF-36), in which no utility data were presented;
Utility studies with mixed populations of patients in which results for sub-groups of patients with wAMD were not presented separately; or
Studies for which only an abstract was available (although posters, which included more information, were included).
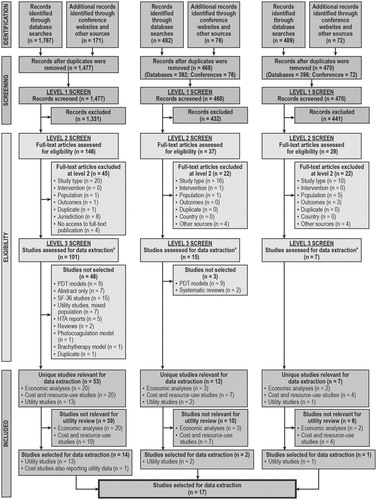
The inclusion and exclusion processes were documented fully, and a Preferred Reporting Items for Systematic reviews and Meta-Analyses (PRISMA) flow chart was completedCitation3 ().
Figure 1. Preferred Reporting Items for Systematic Reviews and Meta-Analyses (PRISMA) flow diagram of the literature search results and review process.
All relevant utility-weight estimates identified were tabulated to summarise the method of elicitation, study population, health-state descriptions, and results, and quality-control checks, verifying the summarised data against the source articles to confirm correct extraction, were performed by an independent quality-control specialist on all the extracted data.
Methodological compliance with NICE reference case
For each identified article, methodological compliance with NICE requirements was assessed with reference to Sections 5.3.1, 5.3.9, 5.3.10, and 5.3.12 of the methods guide, which state that:
For the reference case, the measurement of changes in health-related quality-of-life should be reported directly from patients and the utility of these changes should be based on public preferences using a choice-based method. The EuroQoL Health Questionnaire 5 Dimensions (EQ-5D) is the preferred measure of health-related quality-of-life in adults. When EQ-5D data are not available, these data can be estimated by mapping other health-related quality-of-life measures or health-related benefits observed in the relevant clinical trial(s) to EQ-5D. In some circumstances the EQ-5D may not be the most appropriate. To make a case that the EQ-5D is inappropriate, qualitative empirical evidence on the lack of content validity for the EQ-5D should be provided, demonstrating that key dimensions of health are missingCitation4.
Results
Overall summary of results
In the original review (conducted in 2010), of 1477 articles identified, 146 full-text articles were reviewed, and 13 articles were selected for data extraction. A further article, which reported costs, also reported utility data and was selected for data extraction (). From the 2012 review update, of 468 articles identified, 37 full-text articles were reviewed, and data were extracted from two articles reporting utility values (). From the 2013 review update, of 470 articles identified, 29 full-text articles were reviewed, and data were extracted from one article reporting utility values (). Thus, utility data were extracted from a total of 17 articles. presents the PRISMA flow chart, which details the number of articles identified in the literature search and documents the screening process.
Types of instruments used
Most studies used time trade-off (TTO) techniques to estimate utility weightsCitation5–15; values were elicited from physicians, patients, and the general public. Brown et al.Citation7,Citation8, Finger et al.Citation13, and Lee et al.Citation16 reported utility weights elicited from physicians and patients using standard-gamble methods.
Bansback et al.Citation6, Boland et al.Citation17, Czoski-Murray et al.Citation11, Espallargues et al.Citation12, Finger et al.Citation13, Lotery et al.Citation18, Pauleikhoff et al.Citation19, Sahel et al.Citation20, Soubrane et al.Citation21, and Butt et al.Citation15 reported utility estimates measured in patients using at least one of the following questionnaires: EuroQoL Health Questionnaire 5 Dimensions (EQ-5D); Short-Form 6D Health Status Questionnaire (SF-6D); and Health Utilities Index Mark III (HUI3).
Link between visual acuity and utility
Several of the identified studies measured the utility in patients with differing VA, as elicited from patients, physicians, and the general public. In general, physicians provided higher utility estimates compared with patients and the general population with both TTO and standard-gamble methods (). One study also reported that patients provided lower utilities than the general public, although the study did not elicit values from physiciansCitation15.
Figure 2. Utility estimates from time trade-off methods. Visual acuity ranges were converted to the LogMAR scale, and utility estimates were plotted against the centre of the visual acuity range. Data from Butt et al.Citation15 have not been included here because data from Butt et al.Citation15 are individual patient data, whereas data reported in this figure are mean scores of a population. Data from Aspinall et al.Citation5; Brown et al.Citation7–10; Czoski-Murray et al.Citation11; Espallargues et al.Citation12; Stein et al.Citation14. BCVA, best-corrected visual acuity; Gen, general; LogMAR, logarithm of the minimal angle of resolution.
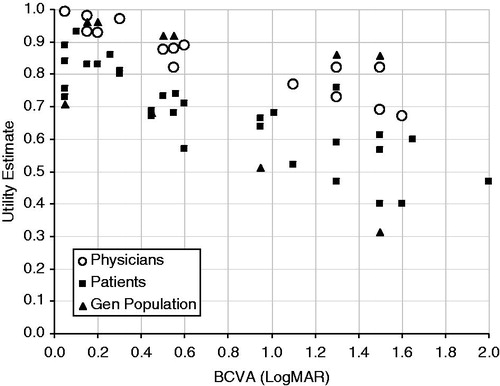
Figure 3. Utility estimates from standard-gamble methods. Visual acuity ranges were converted to the LogMAR scale, and utility estimates were plotted against the centre of the visual acuity range. Data from Brown et al.Citation7,Citation8; Lee et al.Citation16. BCVA, best-corrected visual acuity; LogMAR, logarithm of the minimal angle of resolution.
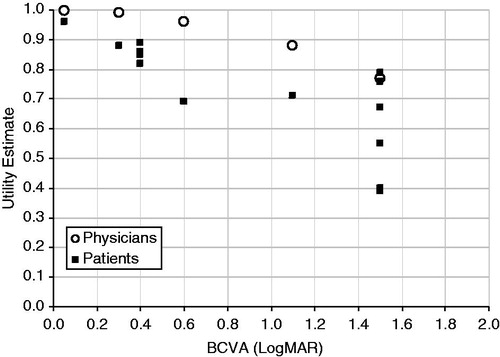
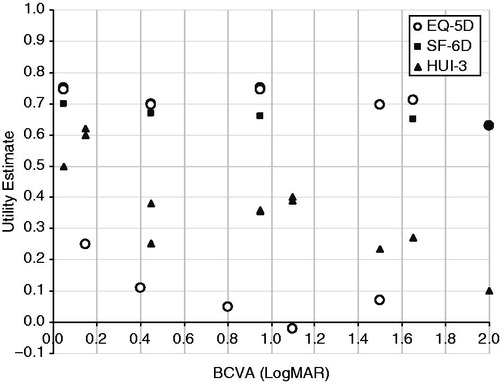
Figure 4. Utility estimates from EQ-5D, SF-6D, and HUI3 (all in patients). Visual acuity ranges were converted to the LogMAR scale, and utility estimates were plotted against the centre of the visual acuity range. Note that data reported by Lotery et al.Citation18 reported utility decrements; these have been subtracted from the mean utility estimate for control patients (0.77) in order to present utility weights in the figure (these data are the lower set of EQ-5D values in the figure). Data from Butt et al.Citation15 have not been included here because data from Butt et al.Citation15 are individual patient data, whereas data reported in this figure are mean scores of a population. Data from Czoski-Murray et al.Citation11; Espallargues et al.Citation12; Lotery et al.Citation18; Sahel et al.Citation20. BCVA, best-corrected visual acuity; EQ-5D, EuroQoL Health Questionnaire 5 Dimensions; Gen, general; HUI3, Health Utilities Index Mark III; LogMAR, logarithm of the minimal angle of resolution; SF-6D, Short-Form 6D Health Status Questionnaire; SST-VPVS, Submacular Surgery Trials Vision Preference Value Scale.
The correlation between utility estimates and VA differed between the different instruments used to measure utility (). Time trade-off methods were more sensitive to VA changes than standard-gamble methodsCitation7,Citation8. One identified study supported this finding, reporting a significant correlation between VA and TTO values (p = 0.02)Citation13.
There did not appear to be a correlation between utility estimated using EQ-5D and best-corrected visual acuity (BCVA) according to four studiesCitation11,Citation12,Citation15,Citation18. In the study by Espallargues et al.Citation12, HUI3 estimates were most highly correlated with VA (Pearson’s correlation: −0.34; p < 0.01), followed by TTO (Pearson’s correlation: −0.21; p < 0.01) and visual analogue scale (VAS) methods (Pearson’s correlation: −0.14; p < 0.05); no significant linear trend was observed between VA and the three-level EQ-5D (Pearson’s correlation: −0.09; p > 0.05) or SF-6D (Pearson’s correlation: −0.13; p > 0.05) utility weights.
Another study reported utility estimates measured in patients using the EQ-5D, and HRQL measured using the National Eye Institute Visual Function Questionnaire (NEI-VFQ-25), and the Hospital Anxiety and Depression Scale (HADS)Citation18. The study found no relationship between severity of vision loss and EQ-5D scores, HADS depression or anxiety sub-scale scores, or NEI-VFQ-25 summary scores.
One study investigated the association between VA and four utility values measured (EQ-5D, SF-6D, TTO, and VAS) in 60 patients with wAMDCitation15. No association was reported between VA and any of the four values measured (p > 0.2).
One UK study elicited utility values from 108 healthy participants who were required to wear contact lenses that had been modified to mimic three AMD health statesCitation11. Utility values were valued at baseline (before lens wearing) and in each of the three health states using TTO anchored at full health and immediate death. Participants were asked to choose between their current health state and each health state. Results were compared with TTO, HUI3, and EQ-5D data collected from patients with AMD in the study by Espallargues et al.Citation12. There was no relationship between VA and EQ-5D scored (regression coefficient was not statistically significant [−0.027]). However, the same study showed a significant association between VA and TTO values from the healthy participants (p < 0.001), which was found to be much stronger than the relationship between VA and HUI3, EQ-5D, and TTO values from patients with AMDCitation11. The regression coefficient for TTO values by VA, adjusted for age, for simulated patients was −0.368 (p < 0.01); for TTO values for patients with AMD, it was −0.036 (p = NS); for HUI3 values for patients with AMD, it was −0.109 (p < 0.01); and for EQ-5D values for patients with AMD, it was −0.027 (p = NS). The TTO values were found to be very different between simulated patients and real AMD patients; for the total group, the TTO value for simulated patients was 0.55 (95% confidence interval [CI], 0.511–0.589) and for real AMD patients was 0.665 (95% CI 0.623–0.707).
Compliance of utility studies with NICE requirements
The utility studies were evaluated for their methodological compliance with NICE requirements. Of the 17 studies identified, six complied with the NICE reference case as listed in Citation12,Citation13,Citation17–19,Citation21.
Table 2. Compliance of utility estimates with the NICE reference case.
Discussion
The current systematic literature review identified a total of 17 articles reporting utility estimates specific to patients with AMD (wAMD or dry AMD) that were published for the US and Europe between January 1995 and July 2013. According to data obtained from the articles included in this review, the HUI3 estimates were the most highly correlated with VA changes, and values elicited by TTO also showed a strong correlation with VA. However, evidence from four identified studies suggests that there is no correlation between a decrease in VA and a decrease in HRQL, as measured by the EQ-5D.
Two similar reviews have been conducted to identify articles reporting utility values in patients with wAMD. One systematic review, published in 2006, identified utility and cost-utility articles in the area of wAMD, dry AMD, and diabetic retinopathyCitation22. However, this review was very narrow in its scope, focusing only on articles published between January 2004 and January 2006. Another systematic review, conducted in 2010, identified seven articles reporting utility estimates in patients with wAMDCitation23. Those seven articles were identified in our literature searches, but only three of those were selected for data extraction. The review by Tosh et al.Citation23 reported that, in patients with AMD, the EQ-5D distinguished between patients with and without the condition; however, it was unable to distinguish between severity levels and did not correlate well with other measures, as seen in the current study. As in our study, Tosh et al.Citation23 found that the HUI3 did distinguish according to severity and correlated well with other measures. Tosh et al.Citation23 also reported that the SF-6D was able to distinguish according to severity and correlated with other measures, but these results were only based on one study. Our review, which had a wider evidence base for the SF-6D data, reported no relationship with severity of visual impairment.
The current review was a systematic literature review conducted to meet the standards that NICE outlines in its single technology appraisal submission templateCitation24. The review identified literature from four databases (PubMed, Embase, the Cochrane Library, and EconLit), as well as searching grey literature from the websites of relevant conferences and professional bodies. Articles were not restricted by language; all languages were considered. However, as with all literature reviews, both the current review and the data identified had certain limitations. First, this review focused primarily on Europe and the US only. The literature search was not restricted based on country, but articles related to countries outside those of interest were excluded from the review at the screening stage. Another limitation, as with similar reviews involving searches of literature databases, was that any articles that were not indexed in PubMed, Embase, EconLit, or the Cochrane Library would not have been initially identified. There was also great heterogeneity in the types of studies identified and instruments used. As such, it was difficult to summarise findings across all studies identified.
A range of instruments has been used to elicit utility values from patients with wAMD. Based on the articles identified in this review, estimates obtained using the HUI3 were most highly correlated with VA, followed by TTO methods. As such, the HUI3 or TTO methods may be suitable methods for use in economic evaluations of patients with wAMD. However, there appeared to be no significant trend between VA and EQ-5D or SF-6D utility weights, and these instruments appear to be poor indicators of VA. Although EQ-5D is the instrument currently recommended by NICE for use in economic evaluations, previous manufacturer submissions in wAMD for approved technologies have used methods other than the EQ-5D (TTO methods for photodynamic therapyCitation25, and HUI3 and TTO for ranibizumab and pegaptanibCitation26). Further refinements of the EQ-5D instrument could be investigated to improve its applicability to conditions such as wAMD. Indeed, a new version of the EQ-5D has been developed incorporating five levels rather than threeCitation27. Tosh et al.Citation23 speculated that such amendments may improve the EQ-5D’s ability to demonstrate differences in utility between people with milder severities of visual impairment. Although the descriptive system for the EQ-5D-5L has been validated, no valuation set currently exists to derive utilities; until this is available, a validated mapping function available from EuroQoL may be used to derive utility values for the EQ-5D-5L from the existing EQ-5D-3L. Although early research from one study that included the EQ-5D-5L reported no correlation with VA, the study did report a more marked difference between EQ-5D and patient TTO utilitiesCitation15 than that reported in the study using the EQ-5D-3LCitation12. Additional dimensions may also be added to improve the relevance of the EQ-5D for certain conditions because the current version does not capture the impact of wAMD on activities of daily living that depend on clear central vision (e.g., reading, writing, driving, recognising people)Citation12. Tosh et al.Citation23 commented that there is an ongoing study looking at the effects of developing an additional dimension to detect the influence of visual impairment on HRQL. Positive results of the study could potentially lead to improvements in the EQ-5D for future use in measuring utilities in wAMD and, hence, improve the correlation between utility and VA.
Conclusions
The results of this review cannot lead to a definitive recommendation as to which utility measure to use in economic analyses within wAMD. However, we postulate that there are shortcomings with the EQ-5D, as it has been demonstrated that neither the EQ-5D-3L or -5L are able to discriminate between differing VA levels in wAMD or to describe any decline in HRQL as VA deteriorates. Other utility measures that include vision-specific dimensions may be more appropriate for use in wAMD (e.g., HUI3). Conversely, condition-specific utility instruments may not be suitable, as derived utilities would not be comparable across different medical conditions.
Transparency
Declaration of funding
This study was conducted by RTI Health Solutions and sponsored by Bayer Health Care Pharmaceuticals.
Declaration of financial/other relationships
Dr Pearson, Dr Rycroft, Mr Irving, and Ms Ainsworth are full-time employees of RTI Health Solutions. Dr Wittrup-Jensen is a full-time employee of Bayer Pharma AG. JME Peer Reviewers on this manuscript have no relevant financial relationships to disclose.
Acknowledgements
No assistance in the preparation of this article is to be declared.
References
- World Health Organisation. Priority eye diseases: age related macular degeneration. Geneva: World Health Organisation (WHO), 2013. http://www.who.int/blindness/causes/priority/en/index8.html. Accessed March 6, 2013
- Mitchell J, Bradley C. Quality of life in age-related macular degeneration: a review of the literature. Health Qual Life Outcomes 2006;4:97
- Moher D, Liberati A, Tetzlaff J, et al. Preferred reporting items for systematic reviews and meta-analyses: the PRISMA statement. J Clin Epidemiol 2009;62:1006–12
- National Institute for Health and Care Excellence (NICE). Guide to the methods of technology appraisal. NICE, 2013. London, UK. http://www.nice.org.uk/media/D45/1E/GuideToMethodsTechnologyAppraisal2013.pdf. Accessed August 13, 2013
- Aspinall PA, Hill AR, Dhillon B, et al. Quality of life and relative importance: a comparison of time trade-off and conjoint analysis methods in patients with age-related macular degeneration. Br J Ophthalmol 2007;91:766–72
- Bansback N, Czoski-Murray C, Carlton J, et al. Determinants of health related quality of life and health state utility in patients with age related macular degeneration: the association of contrast sensitivity and visual acuity. Qual Life Res 2007;16:533–43
- Brown GC, Brown MM, Sharma S. Difference between ophthalmologists’ and patients’ perceptions of quality of life associated with age-related macular degeneration. Can J Ophthalmol 2000;35:127–33
- Brown GC, Sharma S, Brown MM, et al. Utility values and age-related macular degeneration. Arch Ophthalmol 2000;118:47–51
- Brown MM, Brown GC, Sharma S, et al. Quality of life with visual acuity loss from diabetic retinopathy and age-related macular degeneration. Arch Ophthalmol 2002;120:481–4
- Brown GC, Brown MM, Sharma S, et al. The burden of age-related macular degeneration: a value-based medicine analysis. Trans Am Ophthalmol Soc 2005;103:173–84, discussion 184–6
- Czoski-Murray C, Carlton J, Brazier J, et al. Valuing condition-specific health states using simulation contact lenses. Value Health 2009;12:793–9
- Espallargues M, Czoski-Murray CJ, Bansback NJ, et al. The impact of age-related macular degeneration on health status utility values. Invest Ophthalmol Vis Sci 2005;46:4016–23
- Finger R, Hoffmann AE, Fenwick EK, et al. Patients’ preferences in treatment for neovascular age-related macular degeneration in clinical routine. Br J Ophthalmol 2012;96:997–1002
- Stein JD, Brown MM, Brown GC, et al. Quality of life with macular degeneration: perceptions of patients, clinicians, and community members. Br J Ophthalmol 2003;87:8–12
- Butt T, Dunbar HM, Morris S, et al. Patient and public preferences for health states associated with AMD. Optom Vis Sci 2013;90:855–60
- Lee BS, Kymes SM, Nease RF Jr, et al. The impact of anchor point on utilities for 5 common ophthalmic diseases. Ophthalmology 2008;115:898–903
- Boland MRS, Vingerling J, Groot M. The burden of age-related macular degeneration in the Netherlands. Poster presented at 14th International Society for Pharmacoeconomics and Outcomes Research annual European congress, Madrid, Spain, 5--8 November 2011
- Lotery A, Xu X, Zlatava G, et al. Burden of illness, visual impairment and health resource utilisation of patients with neovascular age-related macular degeneration: results from the UK cohort of a five-country cross-sectional study. Br J Ophthalmol 2007;91:1303–7
- Pauleikhoff D, Scheider A, Wiedmann P, et al. [Neovascular age-related macular degeneration in Germany. Encroachment on the quality of life and the financial implications.] Ophthalmologe 2009;106:242–51
- Sahel JA, Bandello F, Augustin A, et al; MICMAC Study Group. Health-related quality of life and utility in patients with age-related macular degeneration. Arch Ophthalmol 2007;125:945–51
- Soubrane G, Cruess A, Lotery A, et al. Burden and health care resource utilization in neovascular age-related macular degeneration: findings of a multicountry study. Arch Ophthalmol 2007;125:1249–54
- Hollands H, Sharma S. Update on utilities and cost-utility analyses. Curr Opin Ophthalmol 2006;17:223–7
- Tosh J, Brazier J, Evans P, et al. A review of generic preference-based measures of health-related quality of life in visual disorders. Value Health 2012;15:118–27
- National Institute for Health and Care Excellence (NICE). Specification for manufacturer/sponsor submission of evidence. NICE, 2012. London, UK. http://www.nice.org.uk/media/F02/9F/SpecificationForManufacturerSponsorSubmissionOfEvidenceJune2012.doc. London, UK. Accessed March 6, 2013
- National Institute for Health and Care Excellence (NICE). Guidance on the use of photodynamic therapy for age-related macular degeneration. Technology appraisal 68. NICE, 2003. London, UK. http://www.nice.org.uk/nicemedia/live/11512/32728/32728.pdf. Accessed August 8, 2013
- National Institute for Health and Care Excellence (NICE). Ranibizumab and pegaptanib for the treatment of age-related macular degeneration. Technology appraisal 155. NICE, 2008. London, UK. http://www.nice.org.uk/nicemedia/live/12057/41719/41719.pdf. Accessed August 8, 2013
- Herdman M, Gudex C, Lloyd A, et al. Development and preliminary testing of the new five-level version of EQ-5D (EQ-5D-5L). Qual Life Res 2011;20:1727–36