
Abstract
Objective:
Evaluate the cost-effectiveness of primary vs secondary prophylaxis (PP vs SP) with pegfilgrastim to reduce the risk of febrile neutropenia (FN) in Non-Hodgkin’s Lymphoma (NHL) patients receiving myelosuppressive chemotherapy from a US payer perspective.
Methods:
A Markov model was used to compare PP vs SP with pegfilgrastim in a cohort of patients receiving six cycles of cyclophosphamide, vincristine, doxorubicin, and prednisone (CHOP) or CHOP plus rituximab (CHOP-R) chemotherapy. Model inputs, including efficacy of pegfilgrastim in reducing risk of FN and costs, were estimated from publicly available sources and peer-reviewed publications. Incremental cost-effectiveness was evaluated in terms of net cost per life-year saved (LYS), per quality-adjusted life-year (QALY) gained, and per FN event avoided over a lifetime horizon. Deterministic and probabilistic analyses were performed to assess sensitivity and robustness of results.
Results:
Lifetime costs for PP were $5000 greater than for SP; however, PP was associated with fewer FN events and more LYs and QALYs gained vs SP. Incremental cost-effectiveness ratios (ICERs) for PP vs SP for CHOP were $13,400 per FN event avoided, $29,500 per QALY gained, and $25,800 per LYS. CHOP-R results were similar ($15,000 per FN event avoided, $33,000 per QALY gained, and $28,900 per LYS). Results were most sensitive to baseline FN risk, cost per FN episode, and odds ratio for reduced relative dose intensity due to prior FN event. PP was cost-effective vs SP in 85% of simulations at a $50,000 per QALY threshold.
Limitations:
In the absence of NHL-specific data, estimates for pegfilgrastim efficacy and relative risk reduction of FN were based on available data for neoadjuvant TAC in patients with breast cancer. Baseline risks of FN for CHOP and CHOP-R were assumed to be equivalent.
Conclusions:
PP with pegfilgrastim is cost-effective compared to SP with pegfilgrastim in NHL patients receiving CHOP or CHOP-R.
Introduction
Febrile neutropenia (FN) is a serious side-effect of chemotherapy and often results in significant morbidity, mortality, and costsCitation1–4. FN is also associated with sub-optimal delivery of chemotherapy and reduced relative dose intensity (RDI), which adversely affects long-term cancer outcomes and survivalCitation5–7. FN is a surrogate marker for infection during chemotherapy and is characterized by an absolute neutrophil count (ANC) < 1000/mm3 and a single temperature of >38.3°C (101°F) or a sustained temperature of ≥38°C (100.4°F) for more than 1 hCitation1,Citation8. Risk of FN is dependent on both patient-specific factors (e.g., type of cancer, disease stage, co-morbid conditions, and age) and the myelotoxicity of the chemotherapy regimen receivedCitation1. Once an episode of FN occurs, the risk of FN increases in subsequent chemotherapy cyclesCitation9.
The American Society of Clinical Oncology (ASCO) and the National Comprehensive Cancer Network (NCCN) recommend the use of granulocyte-colony stimulating factors (G-CSFs) as primary prophylaxis (PP) when the overall FN risk is greater than 20% following myelosuppressive chemotherapy, and secondary prophylaxis (SP) following FN or a dose-limiting neutropenic eventCitation10,Citation11.
Pegfilgrastim is a G-CSF indicated to decrease the incidence of infection, as manifested by FN, in patients with non-myeloid malignancies receiving myelosuppressive chemotherapy associated with a clinically significant incidence of FNCitation12. Pegfilgrastim, the pegylated form of filgrastim, is cleared via a neutrophil-mediated system and requires only a single dose administered subcutaneously once per chemotherapy cycleCitation13–15.
The chemotherapy regimens of cyclophosphamide, doxorubicin, vincristine, prednisone (CHOP), and CHOP plus rituximab (CHOP-R) are used in clinical practice to treat Non-Hodgkin’s Lymphoma (NHL). NCCN guidelines classify CHOP as high-risk of FN (FN risk > 20%)Citation11,Citation16,Citation17. Although NCCN guidelines classify CHOP-R as intermediate risk of FN (FN risk 10–20%), published studies suggest that CHOP-R may be associated with a higher FN risk than CHOPCitation18.
The cost-effectiveness of PP vs SP with pegfilgrastim has been examined by Ramsey et al.Citation19 in breast cancer patients receiving adjuvant docetaxel/doxorubicin/cyclophosphamide (TAC) chemotherapy. Results indicate that the cost-effectiveness of pegfilgrastim as PP may be equivalent or superior to other commonly used supportive care interventions for women with breast cancer. The cost-effectiveness of PP compared to SP with pegfilgrastim in US clinical practice has not been evaluated in NHL patients using cycle-specific FN risk over a lifetime horizon. Therefore, we developed an economic model to evaluate the cost-effectiveness of PP vs SP with pegfilgrastim in the reduction of FN risk from a US payer perspective in a hypothetical cohort of NHL patients receiving CHOP or CHOP-R chemotherapy.
Methods
Model overview
The economic model was constructed in Microsoft Excel 2007 and compares PP with pegfilgrastim to SP with pegfilgrastim over a lifetime horizon. PP is defined as pegfilgrastim administration with the first cycle and every subsequent cycle of chemotherapy, while SP is defined as administration of pegfilgrastim following the first FN episode for all subsequent chemotherapy cycles. The model structure incorporates the assumption that six cycles of chemotherapy were received at 21-day intervalsCitation20,Citation21. The model target population is a hypothetical cohort of NHL patients aged 66 years receiving chemotherapy with either CHOP or CHOP-R. All analyses were performed from the payer perspective and include direct healthcare costs only. All cost estimates were adjusted to 2012 US dollars using the medical care component of the US Consumer Price Index.
Base-case analyses examined the cost-effectiveness of PP vs SP with pegfilgrastim for CHOP and CHOP-R. Cost-effectiveness was assessed in terms of incremental cost per FN event avoided, incremental cost per life-year saved (LYS), and incremental cost per quality-adjusted life-year (QALY) gained. QALYs and LYS were discounted at 3% annually; since all treatments and FN-related events occur during the first year of the model, the number of FNs and all treatment and FN-related costs were not discounted. Sensitivity analyses were performed to assess how changes in key model parameters and parameter uncertainty impact cost-effectiveness results.
Model structure
The model structure comprises two components: a decision tree that tracks the initial chemotherapy cycle and associated FN events (cycle length = 3 weeks), and a Markov model consisting of two phases (). The first phase of the Markov model tracks FN events in chemotherapy cycles 2–6 (cycle length = 3 weeks). The second phase of the Markov model (cycle length = 1 year) tracks 20-year cancer-related survival; after 20 years, patients are assumed to have general population mortality rates.
Figure 1. Model Structure: (a) Decision Tree; (b) Markov1; and (c) Markov2.
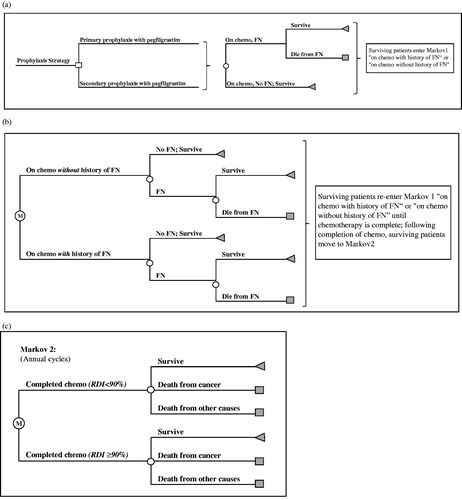
Patients receive chemotherapy in Cycle 1 (), where they are at risk of FN, and are subject to FN-related mortality. Survivors are assumed to enter the first phase of the Markov model, in either the ‘on chemotherapy with history of FN’ or ‘on chemotherapy without history of FN’ health states (). Patients are at risk of FN and FN-related mortality until the chemotherapy cycles are complete, at which point they enter the second phase of the Markov model (). Those entering the second phase of the Markov model are distributed into two categories based on RDI of chemotherapy received: RDI ≤ 90% and RDI > 90%. Previously published studies have examined RDI at thresholds ranging from 65–90%Citation5,Citation22,Citation23. The RDI threshold of 90% was selected for the purposes of the model for consistency with Lyman et al.Citation18, and Bosly et al.Citation23 suggest that an RDI ≤ 90% has an adverse impact on mortality in NHL patients. The probabilities of RDI ≤ 90% and RDI > 90% depend on whether or not an FN event occurred during chemotherapy (i.e., occurrence of an FN event is more likely to result in RDI ≤ 90%)Citation5. Transitions between the Markov states, which are defined by survival, death from NHL, and death from other causes, are assumed to occur yearly.
Model estimation
Base-case parameter values () were obtained from publicly available data and peer-reviewed publications.
Table 1. Model inputs for base-case analysis.
FN risk
The probability of FN in chemotherapy cycle 1 was obtained from Ösby et al.Citation20. Due to an absence of data, the baseline FN risk of CHOP-R was assumed equivalent to CHOP. The relative risks (RR) of FN in subsequent cycles of chemotherapy (e.g., cycles 2–6), with and without a history of FN (RR = 9.09 and RR = 0.21, respectively), were obtained from Whyte et al.Citation24. These RRs are based on neoadjuvant breast cancer data reported by von Minckwitz et al.Citation9, which is the only known study that reports individual cycle-specific FN events.
Pegfilgrastim efficacy
Data on FN risk with and without G-CSF for breast cancer patients receiving neoadjuvant TAC chemotherapy were used to estimate the RR of FN with pegfilgrastim, owing to the absence of placebo-controlled trials reporting the efficacy of pegfilgrastim in NHL patients. The RR of FN of pegfilgrastim vs no G-CSF (RR = 0.21) was calculated by dividing the FN risk for TAC with pegfilgrastim (0.07)Citation9 by the average FN risk with TAC in the absence of G-CSF (0.34)Citation25. The risk of FN in each subsequent cycle was calculated by first multiplying the baseline cycle 1 probability by the relative efficacy of pegfilgrastim; this value was then multiplied by the cycle 2+ risk reduction (0.21). For patients with a history of FN, the product was further multiplied by the FN history risk multiplier (9.09).
Mortality
In the model, the risk of death is assumed to be from FN only (and not from cancer or other causes) during the 18 weeks of chemotherapy. The FN case-fatality rate for NHL (8.9%) was obtained from Kuderer et al.Citation2. Upon completion of chemotherapy, mortality is based on NHL-specific annual probabilities of death dependent upon time since diagnosis according to data obtained from the Surveillance, Epidemiology, and End Results (SEER) databaseCitation26. Mortality estimates for Years 1–5 since diagnosis were obtained directly from SEER; values for subsequent years were extrapolated by fitting the available data to an exponential curve and applying the resulting constant annual mortality from year 5 to year 20. Twenty-year survivors are subject to the same all-cause mortality rates as the general population; these all-cause background risks of death were estimated from 2007 US life tablesCitation27.
Relative dose intensity (RDI)
Following completion of chemotherapy, stratification was based on the RDI of chemotherapy received, which is dependent upon history of FN. Estimates of the probabilities of RDI ≤ 85% for NHL patients with and without a history of FN (45% and 36%, respectively) were obtained from Pettengell et al.Citation5. Since there were no available data in the literature reporting the probabilities of low RDI ≤ 90% stratified by FN history, we assumed that the findings from Pettengell et al.Citation5 using the 85% threshold would also apply to the 90% threshold.
The hazard ratio (HR) for mortality was calculated based on data provided by Bosly et al.Citation23; this estimate is specific to NHL patients receiving CHOP chemotherapy. Bosly et al.Citation23 provide a HR = 0.48 for average RDI ≤ 90% vs > 90%. For the purposes of the model, the reciprocal was used (HR = 2.083). It should be noted that the probabilities of death from NHL obtained from SEER represent a population consisting of those with RDI > 90% and RDI ≤ 90%. In the model, separate annual probabilities of death were estimated for these two sub-groups, such that the weighted average was equal to the overall mortality probabilities obtained from SEER. The HR for mortality for RDI ≤ 90% was applied to the annual probabilities of death estimated from SEER for those with RDI ≤ 90%.
Utility values
In the calculation of QALYs, life years were adjusted by utility values that reflect quality-of-life during and following CHOP or CHOP-R chemotherapy, and FN and FN-related hospitalization. The base-case utility estimate for NHL patients receiving chemotherapy was obtained from Doorduijn et al.Citation28 and Uyl-de-Groot et al.Citation29, and is based on the European Quality of Life 5-Dimension (EQ-5D) questionnaire. The utility associated with FN hospitalization was estimated as an average of Brown and HuttonCitation30 and Brown et al.Citation31 (estimates of 0.42 and 0.24, respectively, in breast cancer patients), which were obtained from surveys of oncology nurses in the US and UK, respectively, using the standard gamble technique. In the model, this value is applied for the duration of FN hospitalization (10.7 days)Citation2. Patients were also assigned post-chemotherapy long-term utilities in the first year and for subsequent years. Consistent with Lyman et al.Citation18 these estimates were obtained from Uyl-de-Groot et al.Citation29 and are also based on the EQ-5D questionnaire. These long-term utility values were subsequently multiplied by age-specific EQ-5D utilities obtained from Hanmer et al.Citation32.
Costs
In the model, pegfilgrastim is assumed to be administered once per chemotherapy cycle, and one complete blood count (CBC) is also assumed to be performed the day before each cycle. The cost of pegfilgrastim reflects the average sales price (ASP) effective July 1, 2012, through September 30, 2012, which was obtained from the Centers for Medicare & Medicaid Services 2012 ASP Drug Pricing FileCitation33. The administration cost of pegfilgrastim and a CBC were estimated using the mid-points of the fee ranges (range of non-Medicare charges) from the MAG Mutual 2012 Physician’s Fee & Coding GuideCitation34, which were considered appropriate for estimating costs to a US payer for these services. Specifically, the administration cost of pegfilgrastim was estimated as the mid-point of the fee range for current procedural terminology (CPT) code 96372 (subcutaneous or intramuscular injection); the cost of CBC was calculated by summing the mid-points of the fee ranges for CPT codes 36415 (collection of venous blood by venipuncture) and 85025 (CBC, automated and automated differential count).
FN cost estimates were estimated for consistency with Lyman et al.Citation3,Citation18. The per-episode FN hospitalization cost was adjusted by 10% to account for additional physician feesCitation18,Citation35. In the model, the post-hospitalization cost, reflecting ambulatory services, is calculated as 20% of the initial hospitalization costCitation18,Citation36,Citation37. The percentage of FN events requiring hospitalization was obtained from Weycker et al.Citation38. Costs of FN events not requiring hospitalization were assumed to be 39% of the initial FN hospitalization costCitation18,Citation36. All cost estimates were adjusted to 2012 US dollars using the medical care component of the US Consumer Price Index (US Bureau of Labor Statistics).
Chemotherapy cost estimates include drug acquisition and infusion costs. Chemotherapy dosing schedules for CHOP and CHOP-R were obtained from Ösby et al.Citation20 and Balducci et al.Citation21, respectively. The dosing schedule for the CHOP regimen was cyclophosphamide 750 mg/m2 on day 1, vincristine 1.4 mg/m2 (maximum 2 mg) on day 1, doxorubicin 50 mg/m2 on day 1, and prednisone 50 mg/m2 orally days 1–5 every 21 daysCitation20. The dosing schedule for the CHOP-R regimen was cyclophosphamide 750 mg/m2 on day 1, doxorubicin 50 mg/m2 on day 1, vincristine 1.4 mg/m2 on day 1, prednisone 100 mg/day on days 1–5, plus rituximab (375 mg/m2); CHOP-R was also assumed to be administered every 21 daysCitation21. Chemotherapy drug acquisition costs were obtained from the Centers for Medicare & Medicaid Services 2012 ASP Drug Pricing FileCitation33, and infusion costs were calculated using the mid-points of the fee ranges from the 2012 MAG Mutual Physician’s Fee & Coding GuideCitation34. Costs of long-term treatment of NHL were excluded from the model.
Model analyses
Model outputs include total costs, number of FN events, life-years, and QALYs for PP and SP with pegfilgrastim. Cost-effectiveness was estimated for the CHOP and CHOP-R chemotherapy regimens separately, and was evaluated in terms of the incremental net cost per FN event avoided, incremental cost per LYS, and incremental cost per QALY gained. If a more costly strategy provides no additional benefit (i.e., is both more costly and less effective) compared to an alternative strategy), it is said to be ‘dominated’. If a more costly strategy provides additional benefit, the two strategies are compared by dividing the additional cost (i.e., incremental cost) by the additional (i.e., incremental) benefit. Per recommendations of the US Panel on Cost-Effectiveness in Health and Medicine, all outcomes were discounted at a rate of 3% per yearCitation39. However, since all treatments and FN-related events occur during the first year of the model, the number of FNs and all treatment and FN-related costs were not discounted.
Deterministic (one-way) sensitivity analyses were performed to assess how changes in key model parameters affect cost-effectiveness results. Parameters were varied using 95% confidence intervals, standard errors (SEs), and plausible ranges derived from published literature. Results of the deterministic sensitivity analysis are presented visually in the form of a tornado diagram.
Uncertainty in cost-effectiveness results was also assessed by performing a probabilistic sensitivity analysis (PSA) using a second-order Monte Carlo simulation. Uncertainty in key model parameters (e.g., efficacy, baseline and relative risks of FN, RDI parameters, costs and utilities) was characterized by probability distributions around each of their base-case values; parameters of these distributions were derived from published literature where available, and plausible ranges when the published study did not report confidence intervals or ranges ().
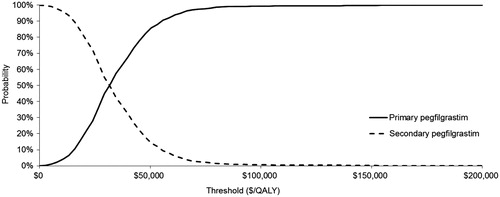
A random number generator was used to draw parameter sets from each distribution, and these sets were run through the model to generate estimates of cost and effectiveness for each treatment strategy. The process of drawing parameters and running the model was repeated 1000 times. Cost per QALY was then calculated for each set of parameter values as in the base case. Results are presented graphically in the form of a scatterplot of incremental QALYs and costs associated with each parameter set, and cost-effectiveness acceptability curves (CEAC), which show the fraction of the 1000 simulations in which PP and SP were incrementally cost-effective over a range of ICER thresholds.
Results
Base-case results are presented in . In all analyses, the expected cost for PP was ∼$5000 higher than for SP; however, PP was also associated with fewer total FN events and additional LYS and QALYs gained relative to SP. Total costs of SP with pegfilgrastim were $26,563 for CHOP and $53,936 for CHOP-R, while total costs for PP with pegfilgrastim were $31,491 and $59,454, respectively. SP with pegfilgrastim was associated with 0.48 total FN events, 3.28 (3.83 undiscounted) total QALYs, and 3.91 (4.53 undiscounted) total life-years. PP with pegfilgrastim was associated with 0.11 total FN events, 3.44 (4.03 undiscounted) total QALYs, and 4.10 (4.76 undiscounted) total life-years. The ICERs for PP vs SP for CHOP were $13,400 per FN event avoided (i.e., the net cost of preventing one case of FN after accounting for cost offsets), $25,800 per LYS, and $29,500 per QALY gained. ICERs for CHOP-R were slightly higher ().
Table 2. Base-case model results*.
Results of the deterministic sensitivity analysis () indicate that the modeled ICERs were most sensitive to baseline FN risk, cost per FN episode, and odds ratio for reduced RDI due to prior FN event. The ICERs when the odds ratio for low RDI owing to an FN event was assumed to be 1.0 were $42,800 and $47,900 for CHOP and CHOP-R, respectively. displays a plot of 1000 simulations of incremental costs and QALYs for PP compared to SP for CHOP. displays the cost-effectiveness acceptability curves showing the probabilities that PP and SP are cost-effective at different cost per QALY thresholds for CHOP. The probabilities that PP is cost-effective at thresholds of $50,000 and $100,000 per QALY for CHOP were 85% and 99%, respectively.
Figure 2. Deterministic sensitivity analysis (cost per QALY; (a) CHOP and (b) CHOP-R). FN, febrile neutropenia; G-CSF, granulocyte colony stimulating factor. The vertical axis represents the base-case ICER, the horizontal bars represent the difference between the base-case ICER and the ICER generated when the model is run using the high and low values of the plausible range, and the entire length of each horizontal bar represents the magnitude of variation in cost-effectiveness results. Citation1Range based on 95% CI calculated based on estimated SE from Ösby et al.Citation20; 2range estimated for consistency with Lyman et al.Citation18; 3range based on 95% CI calculated based on estimated SE from Pettengell et al.Citation5; 4range based on 95% CI reported in Whyte et al.Citation24; 5range based on 95% CI calculated based on estimated RR and SE from data in von Minckwitz et al.Citation9 and Nabholtz et al.Citation25; 6plausible range (±10%); 7range based on 95% CI reported in Whyte et al.Citation24; 8plausible range; percentage of initial FN hospitalization costs varied from 0–10%; 9plausible range (assumed SE of 5% of base-case value); 10(a) range estimated for consistency with Lyman et al.Citation18; varies to 25% and 70% of initial FN hospitalization cost based on Weycker et al.Citation36 and (b) range based on 95% CI calculated based on estimated SE from Havrilesky et al.44.
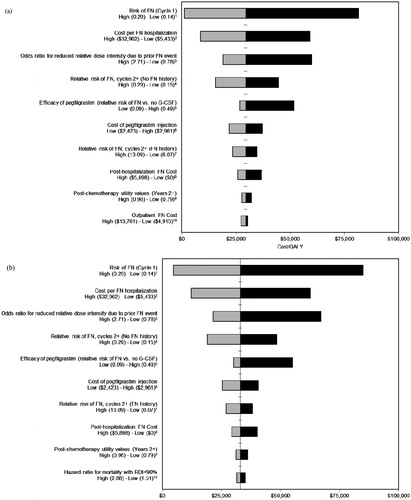
Figure 3. Scatterplot of incremental costs and QALYs for PP compared to SP (CHOP). QALY, quality-adjusted life-year; WTP, willingness-to-pay.
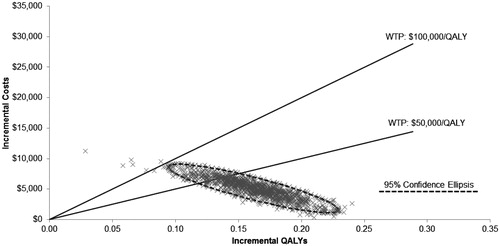
Figure 4. Cost-effectiveness acceptability curves for primary and secondary prophylaxis with pegfilgrastim (CHOP).
Discussion
Administration of G-CSFs for reducing FN risk depends on a variety of clinical factors. ASCO recommends PP for patients at high-risk of FN based on their age, medical history, disease characteristics, and myelotoxicity of the chemotherapy regimen receivedCitation10. SP may provide clinical benefits for patients experiencing neutropenia in prior cycles of chemotherapy (where prophylaxis was not administered), or in situations where a reduced chemotherapy dose may impact cancer-related outcomes (particularly disease-free or overall survival)Citation10. However, PP may not only provide these clinical benefits, but also lead to a reduction in FN-related morbidity, mortality, and costs by reducing the occurrence of first FNCitation1–4.
This economic model evaluated the cost-effectiveness of PP vs SP with pegfilgrastim in the reduction of FN risk from a US payer perspective in a hypothetical cohort of NHL patients receiving CHOP or CHOP-R using cycle-specific risks of FN and examining the impacts of FN on RDI. Results of our base-case analyses suggested that PP is associated with ICERs of ∼$29,500 per QALY and $33,000 per QALY relative to SP in NHL patients receiving the CHOP or CHOP-R chemotherapy regimens, respectively. Commonly cited willingness-to-pay threshold values used to establish cost-effectiveness in the US are $50,000 per QALYCitation40 and $100,000 per QALYCitation41. Based on these willingness-to-pay thresholds, results of our base-case analyses indicated that PP with pegfilgrastim should be considered cost-effective relative to SP. Even if FN history was assumed to have no impact on the probability of reduced RDI, PP with pegfilgrastim would still be considered cost-effective relative to SP at a willingness-to-pay threshold of $50,000 per QALY for CHOP and CHOP-R.
In a cost-effectiveness study by Ramsey et al.Citation19, of early-stage breast cancer patients receiving neoadjuvant TAC, the ICER for PP vs SP with pegfilgrastim was reported to be $48,000 per FN episode avoided, $110,000 per LYS, and $116,000 per QALY gained. Ramsey et al.Citation19 assumed a baseline FN risk of 24.6%, compared to 21% in the current study. Further, FN risk was modeled over the course of chemotherapy (i.e., across all chemotherapy cycles), whereas, in the current study, chemotherapy cycle-specific FN risks were incorporated. In the Ramsey et al. study, no effect of FN on long-term cancer survival was assumed, but a scenario analysis examined the potential long-term survival benefits of pegfilgrastim associated with achieving optimal chemotherapy dose intensity in addition to the benefits of avoiding FN-related mortality; the ICER fell from $116,000/QALY gained to $74,000 per QALY gained when the long-term survival benefits were included. Ramsey et al.Citation19 was the only previous study identified that examined the cost-effectiveness of PP vs SP with pegfilgrastim. Our study is the first evaluating the cost-effectiveness of PP compared to SP with pegfilgrastim using cycle-specific FN risk over a lifetime horizon in a population of NHL patients.
Results from this study should be interpreted in light of several limitations. In the absence of data available for NHL, breast cancer data for neoadjuvant TAC were employed for several parameters (e.g., pegfilgrastim efficacy, RR of FN in cycles 2+ vs cycle 1, and RR of FN based on FN history). In the model, the baseline risk of FN in cycle 1 was assumed to be the same for CHOP-R and CHOP. Survival statistics were extrapolated from years 5–20 to capture long-term NHL survival. Finally, the HR for RDI mortality in Bosly et al.Citation23 was calculated assuming RDI cut-offs of <90%, whereas the parameters obtained from Pettengell et al.Citation5used a threshold of 85%. Although only RDI < 90% was included in the multivariate model provided by Bosly et al.Citation23, unadjusted results also suggested shorter overall survival for those with RDI < 85%. Modeling mortality as a function of RDI < 90% only, and applying this hazard ratio to patients with RDI < 85% may have under-estimated the complete effect of reduced RDI. Evidence from other tumor types also confirms the negative association between RDI < 85% and overall survivalCitation42,Citation43.
While ASCO and NCCN recommend use of PP when the overall FN risk is greater than 20%, the results from this study suggest the clinical benefit of treating NHL patients on CHOP and CHOP-R with PP pegfilgrastim can be translated into economic benefits. Assuming the commonly accepted willingness-to-pay thresholds of $50,000 and $100,000 per QALY, PP with pegfilgrastim was found to be cost-effective compared to SP with pegfilgrastim.
Transparency
Declaration of funding
This study was funded by Amgen, Inc., Thousand Oaks, CA.
Declaration of financial/other relationships
Richard Barron is an employee of Amgen Inc. and owns stock in Amgen Inc. No other persons affiliated with this study own stock in Amgen Inc. Amgen Inc. markets both filgrastim (registered trade name NEUPOGEN®) and pegfilgrastim (registered trade name Neulasta®). Douglas C. A. Taylor, Kelly Fust, Michelle E. Skornicki, Gregory Hill, and Dr Milton C. Weinstein were paid consultants to Amgen Inc. at the time the study was conducted. Dr Gary Lyman is Principal Investigator on a research grant to Duke University from Amgen. JME Peer Reviewers on this manuscript have no relevant financial relationships to disclose.
| Abbreviations: | ||
| ANC, | = | Absolute neutrophil count; |
| ASCO, | = | American Society of Clinical Oncology; |
| ASP, | = | Average sales price; |
| CBC, | = | Complete blood count; |
| CEAC, | = | Cost-effectiveness acceptability curve; |
| CHOP, | = | Cyclophosphamide, vincristine, doxorubicin, and prednisone; |
| CHOP-R, | = | Cyclophosphamide, vincristine, doxorubicin, and prednisone plus rituximab; |
| CI, | = | Confidence interval; |
| CPT, | = | Current procedural terminology; |
| EQ-5D, | = | European Quality of Life–5 Dimension; |
| FN, | = | Febrile neutropenia; |
| G-CSF, | = | Granulocyte-colony stimulating factor; |
| HR, | = | Hazard ratio; |
| ICER, | = | Incremental cost-effectiveness ratio; |
| LYs, | = | Life-years; |
| LYS, | = | Life-year saved; |
| NCCN, | = | National Comprehensive Cancer Network; |
| NHL, | = | Non-Hodgkin’s Lymphoma; |
| PP, | = | Primary prophylaxis; |
| PSA, | = | Probabilistic sensitivity analysis; |
| QALY, | = | Quality-adjusted life-year; |
| RDI, | = | Relative dose intensity; |
| RR, | = | Relative risk; |
| SE, | = | Standard error; |
| SEER, | = | Surveillance, Epidemiology, and End Results; |
| SP, | = | Secondary prophylaxis; |
| TAC, | = | Docetaxel/doxorubicin/cyclophosphamide; |
| UK, | = | United Kingdom; |
| US, | = | United States |
Acknowledgments
The authors thank Seval Ozer-Deniz, MA, and Michael Maschio, MSc, for providing assistance with the conduct of the study. The authors also thank Anju Parthan, PhD, for her contributions in preparing the first draft and final revision of this paper.
Related Research Data
References
- Crawford J, Dale DC, Lyman GH. Chemotherapy-induced neutropenia: risks, consequences, and new directions for its management. Cancer 2004;100:228-37
- Kuderer NM, Dale DC, Crawford J, et al. Mortality, morbidity, and cost associated with Febrile Neutropenia in adult cancer patients. Cancer 2006;106:2258-66
- Caggiano V, Weiss RV, Rickert TS, et al. Incidence, cost, and mortality of neutropenia hospitalization associated with chemotherapy. Cancer 2005;103:1916-24
- Schilling MB, Parks C, Deeter RG. Costs and outcomes associated with hospitalized cancer patients with neutropenic complications: a retrospective study. Exp Therapeut Med 2011;2:859-66
- Pettengell R, Schwenkglenks M, Leonard R, et al. Neutropenia occurrence and predictors of reduced chemotherapy delivery: results from the INC-EU prospective observational European neutropenia study. Support Care Cancer 2008;16:1299-309
- Lyman GH, Dale DC, Crawford J. Incidence and predictors of low dose-intensity in adjuvant breast cancer chemotherapy: a nationwide study of community practices. J Clin Oncol 2003;21:4524-31
- Wildiers H, Reiser M. Relative dose intensity of chemotherapy and its impact on outcomes in patients with early breast cancer or aggressive lymphoma. Crit Rev Oncol Hematol 2011;77:221-40
- United States Department of Health & Human Services, National Institutes of Health, National Cancer Institute. Common Terminology Criteria for Adverse Events (CTCAE). Published: May 28, 2009 (v4.03: June 14, 2010)
- von Minckwitz G, Kummel S, du Bois A, et al. Pegfilgrastim +/- ciprofloxacin for primary prophylaxis with TAC (docetaxel/doxorubicin/cyclophosphamide) chemotherapy for breast cancer. Results from the GEPARTRIO study. Ann Oncol 2008;19:292-8
- Smith TJ, Khatcheressian J, Lyman GH, et al. 2006 update of recommendations for the use of white blood cell growth factors: an evidence-based clinical practice guideline. J Clin Oncol 2006;24:3187-205
- National Comprehensive Cancer Network (NCCN), Inc. Clinical Practice Guidelines in Oncology: Myeloid Growth Factors Version 1.2012. Available from: http://www.nccn.org/professionals/physician_gls/f_guidelines.asp#supportive. Accessed 1 August 2012
- Amgen, Inc. Neulasta (pegfilgrastim) [prescribing information]. Thousand Oaks, CA: Amgen, Inc.; 2011. http://pi.amgen.com/united_states/neulasta/neulasta_pi_hcp_english.pdf. Accessed August 28, 2011
- Green MD, Koelbl H, Baselga J, et al. A randomized double-blind multicenter phase III study of fixed-dose single-administration pegfilgrastim versus daily filgrastim in patients receiving myelosuppressive chemotherapy. Ann Oncol 2003;14:29-35
- Holmes FA, O'Shaughnessy JA, Vukelja S, et al. Blinded, randomized, multicenter study to evaluate single administration pegfilgrastim once per cycle versus daily filgrastim as an adjunct to chemotherapy in patients with high-risk stage II or Stage III/IV breast cancer. J Clin Oncol 2002;20:727-31
- Vogel CL, Wojtukiewicz MZ, Carroll RR, et al. First and subsequent cycle use of pegfilgrastim prevents febrile neutropenia in patients with breast cancer: a multicenter, double-blind, placebo-controlled phase III study. J Clin Oncol 2005;23:1178-84
- Blayney DW, LeBlanc ML, Grogan T, et al. Dose-intense chemotherapy every 2 weeks with dose-intense cyclophosphamide, doxorubicin, vincristine, and prednisone may improve survival in intermediate- and high-grade lymphoma: a phase II study of the Southwest Oncology Group (SWOG 9349). J Clin Oncol 2003;21:2466-73
- Watanabe T, Tobinai K, Shibata T, et al. Phase II/III Study of R-CHOP-21 versus R-CHOP-14 for untreated indolent B-Cell non-hodgkin’s lymphoma: JCOG 0203 Trial. J Clin Oncol 2011;29:3990-8
- Lyman G, Lalla A, Barron R, et al. Cost-effectiveness of pegfilgrastim versus 6-day filgrastim primary prophylaxis in patients with non-Hodgkin’s lymphoma receiving CHOP-21 in United States. Curr Med Res Opin 2009;25:401-11
- Ramsey SD, Liu Z, Boer R, et al. Cost-effectiveness of primary versus secondary prophylaxis with pegfilgrastim in women with early-stage breast cancer receiving chemotherapy. Value Health 2009;12:217-25
- Ösby E, Hagberg H, Kvaloy S, et al. CHOP is superior to CNOP in elderly patients with aggressive lymphoma while outcome is unaffected by filgrastim treatment: results of a Nordic Lymphoma Group randomized trial. Blood 2003;101:3840-8
- Balducci L, Al-Halawani H, Charu V, et al. Elderly cancer patients receiving chemotherapy benefit from first-cycle pegfilgrastim. Oncologist 2007;12:1416-24
- LePage E, Gisselbrecht C, Haioun C, et al. Prognostic significance of received relative dose intensity in non-Hodgkin's lymphoma patients: application to LNH-87 protocol. Ann Oncol 1993;4:651-6
- Bosly A, Bron D, Van Hoof A, et al. Achievement of optimal average relative dose intensity and correlation with survival in diffuse large B-cell lymphoma patients treated with CHOP. Ann Hematol 2008;87:277-83
- Whyte S, Cooper KL, Stevenson MD, et al. Cost-Effectiveness of granulocyte colony-stimulating factor prophylaxis for febrile neutropenia in breast cancer in the United Kingdom. Value Health 2011;14:465-74
- Nabholtz JM, Falkson C, Campos D, et al. Docetaxel and doxorubicin compared with doxorubicin and cyclophosphamide as first-line chemotherapy for metastatic breast cancer: results of a randomized, multicenter, phase III trial. J Clin Oncol 2003;21:968-75
- National Cancer Institute/Surveillance, Epidemiology, and End Results (SEER) database (SEER*Stat 6.5.1). Kaplan-Meier method, Survival Sessions, No adjustment for heterogeneity. Available from: http://seer.cancer.gov/seerstat/. Accessed February 25, 2009
- Arias E. United States life tables, 2007. National vital statistics reports; vol 59 no 9. Hyattsville, MD: National Center for Health Statistics, 2011
- Doorduijn JK, Buijt I, Van Der Holt B, et al. Economic evaluation of prophylactic granulocyte colony stimulating factor during chemotherapy in elderly patients with aggressive non-Hodgkin's lymphoma. Haematologica 2004;89:1109-17
- Uyl-de-Groot CA, Hagenbeek A, Verdonck LF, et al. Cost-effectiveness of ABMT in comparison with CHOP chemotherapy in patients with intermediate- and high-grade malignant non-Hodgkin's lymphoma (NHL). Bone Marrow Transplant 1995;16:463-70
- Brown RE, Hutton J. Cost-Utility model comparing docetaxel and paclitaxel in advanced breast cancer patients. Anti-Cancer Drugs 1998;9:899-907
- Brown RE, Hutton J, Burrel A. Cost effectiveness of treatment options in advanced breast cancer in the UK. Pharmacoeconomics 2001;19:1091-102
- Hanmer J, Lawrence WF, Anderson JP, et al. Report of nationally representative values for the non-institutionalized US adult population for 7 health-related quality-of-life scores. Med Decis Making 2006;26:391-400
- Centers for Medicare and Medicaid Services. 2012 Medicare Average Sales Price Drug Pricing File (Released June 7, 2012 for Quarter 3). Available from: http://www.cms.gov/Medicare/Medicare-Fee-for-Service-Part-B-Drugs/McrPartBDrugAvgSalesPrice/2012ASPFiles.html. Accessed 25 July 2012
- Physician's Fee & Coding Guide 2012. Atlanta, GA: MAG Mutual Healthcare Solutions, Inc; 2012
- Doan QV, Gleeson M, Kim J, et al. Economic burden of cardiovascular events and fractures among patients with end-stage renal disease. Curr Med Res Opin 2007;23:1561-9
- Weycker D, Malin J, Edelsberg J, et al. Cost of neutropenic complications of chemotherapy. Ann Oncol 2008;19:454-60
- Timmer-Bonte JN, Adang EM, Smit HJ, et al. Cost-effectiveness of adding granulocyte colony-stimulating factor to primary prophylaxis with antibiotics in patients with small-cell lung cancer. J Clin Oncol 2006;24:2991-7
- Weycker D, Edelsberg J, Kartashov A, et al. Risk and healthcare costs of chemotherapy-induced neutropenic complications in women with metastatic breast cancer. Chemotherapy 2012;58:8-18
- Gold MR, Siegel JE, Russell LB, et al. Cost-effectiveness in health and medicine. Oxford: Oxford University Press, 1996
- Grosse SD. Assessing cost-effectiveness in healthcare: history of the $50,000 per QALY threshold. Expert Rev Pharmacoecon Outcomes Res 2008;8:165-78
- Cutler DM, Rosen AB, Vijan S. The value of medical spending in the United States, 1960-2000. N Engl J Med 2006;355:920-7
- Chirivella I, Bermejo B, Insa A, et al. Optimal delivery of anthracycline-based chemotherapy in the adjuvant setting improves outcome of breast cancer patients. Breast Cancer Res Treat 2009;114:479-84
- Hanna RK, Poniewierski MS, Laskey RA, et al. Predictors of reduced relative dose intensity and its relationship to mortality in women receiving multi-agent chemotherapy for epithelial ovarian cancer. Gynecol Oncol 2013;129:74-80
- Havrilesky LJ, Hanna RK, Poniewierski R, et al. Relationship between relative dose intensity and mortality in women receiving combination chemotherapy for stage III-IV epithelial ovarian cancer. J Clin Oncol 29: 2011 (suppl; abstr 5084)