
Abstract
Objective:
Molecular monitoring of chronic myeloid leukemia (CML) has been associated with improved clinical outcomes during tyrosine kinase inhibitor therapy (TKI), yet recent studies have demonstrated its use is far below published guidelines. This study sought to determine frequencies of molecular monitoring and its impact on resource utilization and medical costs.
Methods:
A retrospective US claims administrative database (IMS LifeLink Health Plan Claims and Truven Health Analytics MarketScan databases, 11/2007–06/2012) was used to analyze the economic impact of qPCR testing in CML patients on first-line TKIs during the initial 12-months of treatment.
Results:
One thousand two hundred and five adult CML patients met the sample selection criteria. Among these, 41.0% had no qPCR tests, 31.9% had 1–2 tests, and 27.1% had 3–4 tests; 88.9% were initiated on imatinib; 47.7% were female. Patients in the 3–4 tests cohort incurred 44% (p < 0.001) fewer in-patient (IP) admissions than patients in the 0-tests cohort. Adjusted all-cause IP cost was $5663 (p = 0.005) lower for the 3–4 tests cohort than the 0-tests cohort. Adjusted progression-related IP cost was $4132 (p = 0.013) lower for the 3–4 tests cohort than the 0-tests cohort. Adjusted medical service cost was $5997 (p = 0.049) lower for the 3–4 tests cohort than the 0-tests cohort.
Limitations:
Claims databases did not include information on the primary cause of hospitalizations.
Conclusions:
Among CML patients in two large claims databases, nearly three-quarters did not receive adequate molecular monitoring per published guidelines. Those who were more frequently monitored incurred lower medical service costs, with the majority of the difference in costs being related to disease progression. These findings underscore the clinical and economic values of molecular monitoring in CML.
Introduction
Molecular monitoring by quantitative polymerase chain reaction (qPCR) is used to assess the BCR-ABL mRNA transcript levels in the blood of chronic myeloid leukemia (CML) patients during therapy. The production of BCR-ABL transcripts, resulting from a t(9;22) chromosomal translocation generating the Philadelphia chromosome, leads to aberrant tyrosine kinase activity, which causes the pathogenesis of CML. In 2001, the first tyrosine kinase inhibitor (TKI), imatinib, was approved for the treatment of patients newly diagnosed with Philadelphia chromosome positive (Ph+) CML in chronic phase (CP) and in 2004 qPCR was used to detect CML patients who were unresponsive to the drugCitation1. Today, regular molecular monitoring allows physicians to detect patients who are unresponsive to TKIs early in their treatment, who do not achieve optimal response or who are in relapse.
Guidelines developed by the National Comprehensive Cancer Network (NCCN) and by the European LeukemiaNet (ELN) recommend molecular monitoring every 3 months using the International Scale (IS); however, they differ in their recommendation after a patient achieves major molecular response (MMR) or complete cytogenetic response (CCyR)Citation2,Citation3. The ELN proposes to monitor every 3–6 months after MMR is achievedCitation2, while the NCCN suggests that molecular monitoring can be decreased to one test every 3–6 months after the patient has achieved and maintained CCyR for at least 3 yearsCitation3. Despite these recommendations, several studies have demonstrated that patients are inadequately monitoredCitation4–7. A 2013 retrospective cohort analysis of 402 CML patients noted an average of 2.1 qPCR tests per year, with only 12% tested every 3 months during the first year of therapyCitation5.
Frequent qPCR testing is essential to attain optimal outcomes. Nearly 25% of CML patients treated with imatinib fail to respond or relapseCitation8. Patients that do not respond well to imatinib can be identified by qPCR testing and switched to alternative therapies. On June 28, 2006 and October 29, 2007 dasatinib and nilotinib were approved by the US Food and Drug Administration (FDA), respectively, for the treatment of adult Ph+ CML patients who are refractory to prior therapyCitation9–11. In 2012, three other medications were approved by the FDA for use in refractory CML patientsCitation12–15.
Regular qPCR testing according to published guidelines has been associated with better clinical outcomes. A recent studyCitation5 analyzed the average frequency of molecular monitoring per year and its impact on disease progression and survival. The authors demonstrated that higher frequency of molecular monitoring was associated with a lower rate of disease progression and longer progression-free survival. The demonstrated clinical benefits also imply that there could be a reduction of the economic burden of CML with frequent qPCR testingCitation16, as disease progression would be expected to be delayed and complications minimizedCitation17–19. However, to the best of our knowledge, there is no prior study estimating the impact of the frequency of molecular monitoring on costs and resource utilization. This study was conducted to evaluate the healthcare resource utilization (HRU) and costs related to frequency of qPCR testing in a real-world setting.
Patients and methods
Data sources
Two large US administrative claims databases, IMS LifeLink Health Plan Claims database and the Truven Health Analytics MarketScan® databases, were combined to increase sample size. The databases contain data for individuals from all census regions of the US, composed primarily of medical claims (physician and facility), pharmacy claims, and enrollment records. The IMS LifeLink Health Plan Claims database contains data from January 1997 to June 2012, including combined claims for >100 healthcare plans, representing ∼42 million covered lives annually. The Truven Health Analytics MarketScan® databases contains data from January 2000 to December 2011, including combined claims for >130 employers that sponsor private health insurance, representing ∼40 million covered lives annually. In addition, the MarketScan Medicare Supplemental and Coordination of Benefits (Medicare Supplemental) database profiles the healthcare experience of retirees with Medicare supplemental insurance paid for by employers. The compiled data are de-identified and comply with the patient confidentiality requirements of the Health Insurance Portability and Accountability Act (HIPAA).
Study design
A retrospective cohort study design was used to compare CML patients with 0, 1–2, and 3–4 tests over the 12 months following the initiation of first-line TKI therapy. Patients aged ≥18 years were included if they had ≥2 independent diagnoses for CML (International Classification of Diseases, 9th Revision, Clinical Modification [ICD-9-CM]:205.1x) and had at least one prescription fill for any TKI as first-line therapy on or after October 29, 2007, the date when both nilotinib and dasatinib had FDA approval for use in resistant/intolerant CML. Patients had to have at least one CML diagnosis prior to or on the date of the first TKI prescription—which is defined as the index date. Patients from the IMS LifeLink Health Plan database were excluded from the study if they were over 65 years old, given that there are no Medicare supplemental data available for them, and, as such, their information is incomplete.
Patients with a hematopoietic stem cell transplant, or any medical claim associated with a clinical trial, were excluded (ICD-9 CM: V70.7). Patients diagnosed with CML remission (ICD-9 CM 205.11), CML relapse (ICD-9 CM 205.12), metastatic cancer, or undergoing chemotherapy (including interferon therapy) prior to or on the index date were also excluded from the analysis. Hydroxyurea therapy prior to TKI use was permitted.
Patients in the study sample had to have continuous healthcare coverage for ≥6 months before and 12 months after the index date. The baseline period was defined as the 6-month period preceding the index date, while the study period was defined as the 12-month period after the index date.
Frequency of molecular monitoring
The frequency of qPCR testing was calculated as the total number of qPCR tests over the 12-month period following the index date. Only procedure codes (CPT codes: 83891, 83894, 83896, 83898, 83902, 83912, and 83913) that were recorded at least 30 days apart were considered as separate tests. Patients were categorized into cohorts based on whether they had 0, 1–2, or 3–4 tests. According to the guidelinesCitation2,Citation3, patients should receive four tests per year. Because the purpose of the study was to assess whether monitoring according to guidelines is associated with better outcomes than monitoring less frequently, only patients with ≤4 tests over the first year of treatment were included. It is possible that some patients received more than four tests during the study period. These patients who were tested more often than recommended in the guidelines (reasons not available in the claims databases) were excluded from this study as they may present unusual profiles.
Patient characteristics
Patient baseline characteristics were compared between the three cohorts using Fisher’s exact tests for binary variables and Kruskal Wallis tests for continuous variables. Baseline characteristics included demographics, the observed duration of CML (i.e., time between the first observed CML diagnosis in the database and the index date) and CML disease complexity (mild, moderate, or severe), which was defined using a cancer complexity algorithm developed by Darkow et al.Citation20. This algorithm reflects the difficulty of managing a patient’s disease with a particular set of conditions, and is commonly used in claims databases analyses of CML as a potential HRU and cost confounding factorCitation21–23.
Other characteristics evaluated during the 6-month baseline period included comorbidities, identified based on the presence of claims associated with an exhaustive list of conditions defined by the US Agency for Healthcare Research and QualityCitation24. Only comorbidities with a prevalence of at least 5% in each cohort were reported. The Charlson Comorbidity Index (CCI)Citation25, an indicator of overall comorbidity profileCitation26, was also reported.
Healthcare resource utilization and costs
HRU was assessed for each cohort during the study period including the following categories: the number of (1) IP admissions, (2) emergency room (ER) visits, (3) outpatient (OP) visits, and (4) other medical services (e.g., laboratory, radiology, and other ancillary services). HRU was compared using unadjusted and adjusted incidence rate ratios (IRRs), estimated using Poisson regressions. Multivariate Poisson regressions adjusted for potential confounding factors, including the following list of covariates: age, gender, region of residence, type of health plan, data source (Truven Health Analytics MarketScan vs IMS LifeLink Health Plan), TKI prescription fill on the index date (imatinib, nilotinib, or dasatinib), year of the index date, CML severity (mild, moderate, or severe), baseline HRU (IP admissions, ER visits, OP visits, and other medical services), and CML-related comorbidities (cytopenias and other non-hematologic events).
Medical service costs were measured from a managed care perspective and were inflation-adjusted to 2012 USD, using the CPI medical component. Cost categories analyzed included: IP costs, ER visit costs, OP visit costs, other medical service costs, pharmacy costs, medical costs (the sum of IP, OP, ER, and other medical services), and total medical service costs (the sum of medical costs and pharmacy costs).
Progression-related IP costs were defined as the costs of IP admissions with a diagnosis of acute myeloid leukemia or acute lymphoid leukemia, and/or having chemotherapies during hospitalization or 30 days within hospital discharge.
Statistical significance of the unadjusted cost differences between cohorts was tested using Wilcoxon rank-sum tests. Adjusted cost differences were estimated using multivariate generalized linear models with a normal distribution, adjusting for potential confounding factors, including the same list of covariates listed previously in the HRU analyses. As a sensitivity analysis of the cost differences between cohorts, the number of oncology OP visits not due to routine molecular monitoring during the study period was also included as a potential confounding factor in the multivariate regression models. This sensitivity was performed to isolate the impact of more frequent physician monitoring (overall) vs that of more frequent qPCR testing.
Results
Patient characteristics
The inclusion criteria were met by 1205 CML patients treated with TKI. Of these, 494 (41.0%) had 0 qPCR tests, 384 (31.9%) had 1–2 qPCR tests, and 327 (27.1%) had 3–4 qPCR tests during the observation period. Cohorts were well balanced in terms of gender (p = 0.7447), but patients with fewer tests were older (p < 0.001). The mean ages were 57, 53, and 51 years old for the 0, 1–2, and 3–4 tests cohorts, respectively; 48.0%, 46.4%, and 49.2% were female (Supplementary Table 1).
The median time between patients’ first observed diagnosis of CML and the index date was 15, 14, and 13 days, for the 0, 1–2, and 3–4 tests cohorts, respectively (p = 0.4507).
No statistically significant differences were observed between the three cohorts in terms of comorbidities, with the exception of cardiovascular disease and hypertension, which were more frequent in the 0 test cohort at baseline (16.0% vs 11.7% vs 7.3%; p = 0.0008 and 40.1% vs 32.0% vs 34.9%; p = 0.0421, respectively).
During the baseline period, the average total medical service cost was statistically different between cohorts. The 0 test cohort had the highest total medical service costs of $12,663 annually, followed by the 3–4 tests cohort with $11,904, and by the 1–2 tests cohort with $11,398 (p = 0.0051).
Healthcare resource utilization and cost
During the 12-month study period, patients in the 0 test cohort were observed to have more IP admissions and ER visits as compared to the 1–2 tests and the 3–4 tests cohorts, but to have fewer outpatient and other medical services. The 0, 1–2, and 3–4 tests cohorts had an average of 0.33, 0.28, and 0.17 IP admissions per-patient-per-year and an average of 0.67, 0.52, and 0.47 ER visits per-patient-per-year, respectively (). Results of the ER, OP, and other medical visits are not reported.
Figure 1. Comparison of IP admissions between cohorts. The 0, 1–2, and 3–4 tests cohorts had an average of 0.33, 0.28, and 0.17 IP admissions per-patient-per-year. IP, in-patient admissions; IRR, incidence rate ratio.
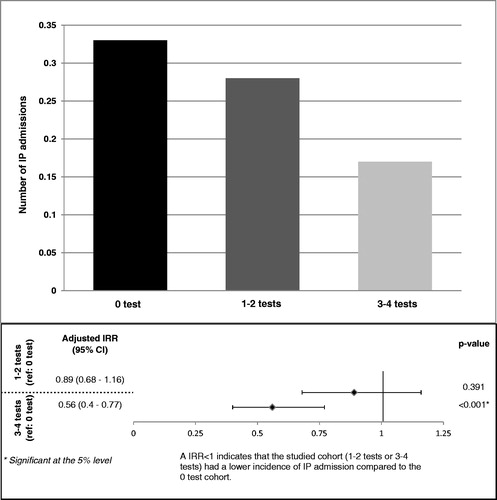
Once adjusted for potential confounding factors, patients with 3–4 tests had 44% fewer IP admissions (0.56 [0.40; 0.77]; p < 0.0001) and 25% fewer ER visits (0.75 [0.61; 0.92]; p = 0.005), than patients with 0 test (). The difference in IP admissions between the 0 test and 1–2 test cohorts was not statistically significant. Patients with 1–2 tests experienced fewer ER visits (0.82 [0.68; 0.99]; p = 0.043) than patients with 0 test. These results indicate that receiving more frequent molecular monitoring decreases the chance of being hospitalized and admitted to an emergency room.
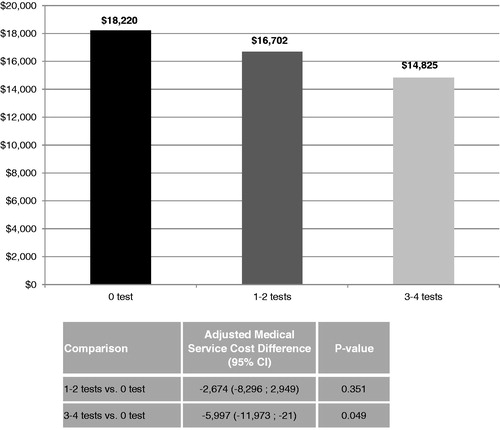
This analysis also found that the medical costs were inversely related to the number of tests. The average medical cost for the 0 test cohort was $1518 higher than the 1–2 tests cohort ($18,220 vs $16,702, p < 0.001), and was $3394 higher than the 3–4 tests cohort ($18,220 vs $14,825, p < 0.001). With adjustment of potential confounding factors, there was a difference in medical service costs of $5997 (p = 0.049) between the 0 and 3–4 tests cohorts, suggesting that frequent molecular monitoring results in a lower economic burden of CML (). The adjusted difference in medical cost between the 0 and 1–2 tests cohorts did not reach statistical significance.
Figure 2. Comparison of medical service costs between cohorts. The average medical cost for the 0 test cohort was $1518 higher than the 1–2 tests cohort ($18,220 vs $16,702, p < 0.001), and was $3394 higher than the 3–4 tests cohort ($18,220 vs $14,825, p < 0.001). With adjustment of potential confounding factors, there was a difference in medical service costs of $5997 (p = 0.049) between the 0 and 3–4 tests cohorts.
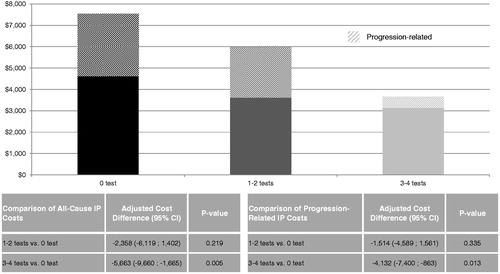
Further analysis suggested that these initial cost differences were mostly driven by IP costs. Once adjusted for potential confounding factors, the IP cost difference between the 0 and 3–4 tests cohorts was $5663 (p = 0.005), which represents ∼94% of the difference of medical service costs between cohorts. However, the IP costs between the 0 and 1–2 tests cohorts was not statistically significant (difference = $2358; p = 0.219) (). The adjusted progression-related IP cost was $4132 lower for the 3–4 tests cohort than the 0 test cohort, suggesting that ∼73% ($4132/$5663) of the observed difference of all-cause IP costs between the 3–4 tests cohort and the 0 test cohort could be attributable to disease progression.
Figure 3. Comparison of all-cause and progression-related IP costs between cohorts. Once adjusted for potential confounding factors, the IP cost difference between the 0 and 3–4 tests cohorts was $5663 (p = 0.005). The IP costs difference between the 0 and 1–2 tests cohorts was not statistically significant (difference = $2358; p = 0.219). The progression-related IP cost difference between the 0 and 3–4 tests cohorts was $4132 (p = 0.013). The progression-related IP costs difference between the 0 and 1–2 tests cohorts was not statistically significant (difference = $1514; p = 0.335). CI, confidence interval; IP, in-patient admissions.
The results from the sensitivity analysis adjusting for the number of oncology OP visits not due to routine molecular monitoring during the study period were consistent with the above results.
Discussion
Using data from two large US administrative claims databases, this study compared HRU and costs among CML patients receiving 0, 1–2, or 3–4 qPCR tests over the 12-month period following the initiation of TKI therapy. Among 1205 selected CML patients, 41.0% had 0 qPCR tests, 31.9% had 1–2 qPCR tests, and 27.1% had 3–4 qPCR tests. Both unadjusted and adjusted results suggested that patients with 3–4 tests incurred fewer IP admissions, ER visits, and lower IP and medical service costs compared to patients with no qPCR tests. The progression-related IP costs were also significantly lower among the 3–4 qPCR tests cohort than the 0 qPCR test cohort. Furthermore, a sensitivity analysis that controlled for the number of oncology OP visits not due to routine molecular monitoring corroborates the findings. Although a similar trend was observed between patients with 1–2 tests vs 0 test, most of the differences were not statistically significant.
Despite the fact that the NCCN and the ELN recommend frequent molecular monitoringCitation2,Citation3, the low rate of patients with 3–4 qPCR tests is consistent with the findings of recent studiesCitation4,Citation5. A chart review study found that, during the 18 months following TKI initiation, 20% of CML patients never received molecular monitoring, and less than 50% of patients were considered to be appropriately monitored, as suggested by guideline recommendationsCitation4. Another study also confirmed the extent of under-monitoring, with only 12% of the CML patients tested every 3 months and 32% never tested for molecular response during the first year of TKI therapyCitation5.
The current study suggested that patients with more frequent qPCR tests incurred lower progression-related IP costs. These findings are consistent with the results a recent studyCitation5 demonstrating that higher frequency of molecular monitoring is associated with a lower risk of progression or mortality. Patients with an average of 3–4 qPCR tests per year were shown to have a 91% lower hazard of disease progression than patients without qPCR tests. The risk of progression or death was 2.7% among patients with 3–4 qPCR tests per year compared to 17.0% among patients without qPCR tests (p = 0.001). The authors observed a significant decrease in the risk of disease progression as the frequency of molecular testing increased, suggesting that close molecular monitoring allowed earlier identification of TKI non-response and, thus, permitted treatment corrections. Patients who progress require more intensive treatment and a closer follow-up from the physician, which, in turn, generates high expenditures. Thus, while decreasing the risk of disease progression in CML patients, frequent molecular testing may provide a clear economic benefit.
However, a concern for any new testing is the potential increase in medical costs. No previous studies have evaluated the costs associated with qPCR testing in CML. We found that more frequent testing correlated with lower medical costs. In addition, we found that patients with 3–4 qPCR tests were less likely to be hospitalized or to have emergency room visits when compared to patients without any molecular testing. Accordingly, the IP costs were significantly higher in the 0 test cohort. As a result, even though the estimated costs of molecular monitoring were $830 per year for the 3–4 tests cohort, the difference in medical service costs between this cohort and the 0 test cohort resulted in a net benefit of $5997.
This study has several limitations, some inherent to retrospective analyses and some particular to this study’s design. First, retrospective analyses on claims data have the common limitation that claims databases may contain inaccuracies or omissions in coded procedures, diagnoses, or pharmacy claims. Since these inaccuracies should have occurred at random, we expected them to affect all cohorts similarly. Second, since our study was not an analysis of randomized subjects, unmeasured confounders could have biased the comparisons. Third, claims databases do not include information on the primary cause of IP admissions; therefore, although we observed fewer IP admissions in more frequently monitored cohorts, the exact reasons of these hospitalizations were unknown. One hypothesis, based on the findings of Goldberg et al.Citation5, was that these hospitalizations may be related to disease progression. However, no ICD-9 code is specifically designated for disease progression. As a proxy, we defined progression-related IP admissions based on existence of an ICD-9 diagnosis code of acute hematologic condition, and/or chemotherapies during hospitalization or within 30 days of hospital discharge. Fourth, in the time period the claim database encompasses, there were no specific procedure codes identifying qPCR tests. Because multiple codes can be recorded within a few days for a same test, only those that were recorded at least 30 days apart were considered as separate tests. Fifth, it is difficult to isolate the impact of more frequent physician monitoring (overall) vs that of more frequent qPCR testing. Hence, we performed a sensitivity analysis, where we controlled for the number of oncology OP visits not due to routine molecular monitoring. These results were consistent with the findings of the main analysis, suggesting that qPCR monitoring may have an independent impact on hospitalizations and medical service costs. Sixth, claims databases do not include information on patients’ Sokal score, an indicator of CML severity that may have an impact on HRU and costs. Finally, the current study did not analyze traditional cytogenetic tests. Evaluating the impact of traditional cytogenetic tests on healthcare resource utilization and costs would be an interesting topic for future studies.
Conclusion
This retrospective study suggested that, among CML patients initiating first-line TKIs, those with 3–4 qPCR tests a year incurred fewer IP admissions, ER visits, and lower IP and medical service costs as compared to patients with no test, where the progression-related IP costs accounted for the majority of the IP cost differences. These findings underscore the importance of molecular monitoring in CML patients.
Transparency
Declaration of funding
This study was sponsored by Novartis Pharmaceuticals Corporation.
Declaration of financial/other relationships
AG, KD, and EQW are employees of Analysis Group, Inc., which has received consultancy fees from Novartis Pharmaceuticals Corporation. LC is an employee of Novartis Pharmaceuticals Corporation. SLG receives research funding from Ariad Pharmaceuticals, Bristol Myers Squibb, and Novartis Oncology.
http://www.hcup-us.ahrq.gov/reports/ComorbiditySoftwareDocumentationFinal.pdf
Download PDF (36.3 KB)Acknowledgments
We thank Ana Bozas, an employee of Analysis Group Inc., who contributed to the preparation and editing of the manuscript, funded by Novartis Pharmaceuticals Corporation.
Previous presentation
This study was presented at the 2013 ASCO Annual Meeting, Chicago, Illinois, May 31–June 4, 2013.
References
- Branford S, Rudzki Z, Parkinson I, et al. Real-time quantitative PCR analysis can be used as a primary screen to identify patients with CML treated with imatinib who have BCR-ABL kinase domain mutations. Blood 2004;104:2926-32
- Baccarani M, Deininger M, Rosti G, et al. European LeukemiaNet recommendations for the Management of Chronic Myeloid Leukemia: 2013. Blood 2013;122:872-84
- Network NCC. Clinical Practice Guidelines in Oncology: Chronic Myelogenous Leukemia (v 4.2013). 2013. http://www.nccn.org/professionals/physician_gls/pdf/cml.pdf. Accessed 4 Sep 2013
- Chen L, Guérin A, Xie J, et al. Monitoring and switching patterns of patients with chronic myeloid leukemia treated with imatinib in community settings: a chart review analysis. Curr Med Res Opin 2012;28:1831-9. http://www.ncbi.nlm.nih.gov/pubmed/23127201. Accessed 4 Sep 2013
- Goldberg SL, Chen L, Guerin A, et al. Association between molecular monitoring and long-term outcomes in chronic myelogenous leukemia patients treated with first line imatinib. Curr Med Res Opin 2013;29:1075-82. http://www.ncbi.nlm.nih.gov/pubmed/23738923. Accessed 4 Sep 2013 September 4, 2013
- Pasquini R, Cortes JE, Kantarjian HM, et al. Paper: survey of the frontline treatment and management of Chronic Myeloid Leukemia (CML) in a real-word setting: The 3rd Annual Update of the Worldwide Observational Registry Collecting Longitudinal Data on Management of Chronic Myeloid Leukem. In: 53rd ASH Annual Meeting and Exposition. San Diego, CA; 2011. https://ash.confex.com/ash/2011/webprogram/Paper40024.html. Accessed 4 Sep 2013
- Bollu V, Quintas-Cardama A, Flamm M, et al. Resource utilization and perceptions of major molecular response in chronic myeloid leukemia (CML): results of a Delphi panel study. Value Health 2011;14:A156-A157
- De Lavallade H, Apperley JF, Khorashad JS, et al. Imatinib for newly diagnosed patients with chronic myeloid leukemia: incidence of sustained responses in an intention-to-treat analysis. J Clin Oncol Official J Am Soc Clin Oncol 2008;26:3358-63. http://www.ncbi.nlm.nih.gov/pubmed/18519952. Accessed 4 Sep 2013
- Corporation NP. Gleevec™ (imatinib mesylate) (drug label). 2003. http://www.accessdata.fda.gov/drugsatfda_docs/label/2003/021588lbl.pdf. Accessed 4 Sep 2013
- Corporation NP. Tasigna® (nilotinib) Capsules (drug label). 2007. http://www.accessdata.fda.gov/drugsatfda_docs/label/2007/022068lbl.pdf. Accessed 4 Sep 2013
- Company B-MS. SPRYCEL™ (dasatinib) Tablets (drug label). 2007. http://www.accessdata.fda.gov/drugsatfda_docs/label/2006/021986lbl.pdf. Accessed 4 Sep 2013
- Pharmaceuticals A. ICLUSIG® (ponatinib) tablets (drug label). 2012. http://www.accessdata.fda.gov/drugsatfda_docs/label/2012/203469lbl.pdf. Accessed 4 Sep 2013
- USA TP. SYNRIBO™ (omacetaxine mepesuccinate) for Injection (drug label). 2012. http://www.accessdata.fda.gov/drugsatfda_docs/label/2012/203585lbl.pdf. Accessed 4 Sep 2013
- Inc. P. BOSULIF® (bosutinib) tablets (drug label). 2012. http://www.accessdata.fda.gov/drugsatfda_docs/label/2012/203341lbl.pdf. Accessed 4 Sep 2013
- Jain P, Kantarjian H, Cortes J. Chronic myeloid leukemia: overview of new agents and comparative analysis. Curr Treat Opt Oncol 2013;14:127-43. http://www.ncbi.nlm.nih.gov/pubmed/23572291. Accessed 4 Sep 2013
- Redaelli A, Stephens JM, Laskin BL, et al. The burden and outcomes associated with four leukemias: AML, ALL, CLL and CML. Exp Rev Anticancer Ther 2003;3:311-29. http://www.ncbi.nlm.nih.gov/pubmed/12820775. Accessed 4 Sep 2013
- Martinelli G, Iacobucci I, Soverini S, et al. Monitoring minimal residual disease and controlling drug resistance in chronic myeloid leukaemia patients in treatment with imatinib as a guide to clinical management. Hematol Oncol 2006;24:196-204. http://www.ncbi.nlm.nih.gov/pubmed/16988930. Accessed 4 Sep 2013
- Press RD, Galderisi C, Yang R, et al. A half-log increase in BCR-ABL RNA predicts a higher risk of relapse in patients with chronic myeloid leukemia with an imatinib-induced complete cytogenetic response. Clin Cancer Res Official J Am Assoc Cancer Res 2007;13:6136-43. http://clincancerres.aacrjournals.org/content/13/20/6136.short. Accessed 4 Sep 2013
- Soverini S, Martinelli G, Rosti G, et al. ABL mutations in late chronic phase chronic myeloid leukemia patients with up-front cytogenetic resistance to imatinib are associated with a greater likelihood of progression to blast crisis and shorter survival: a study by the GIMEMA Working Party on Chr. J Clin Oncol Official J Am Soc Clin Oncol 2005;23:4100-9. http://jco.ascopubs.org/content/23/18/4100.short. Accessed 4 Sep 2013
- Darkow T, Henk HJ, Thomas SK, et al. Treatment interruptions and non-adherence with imatinib and associated healthcare costs: a retrospective analysis among managed care patients with chronic myelogenous leukaemia. PharmacoEconomics 2007;25:481-96
- Wu EQ, Guerin A, Yu AP, et al. Retrospective real-world comparison of medical visits, costs, and adherence between nilotinib and dasatinib in chronic myeloid leukemia. Curr Med Res Opin 2010;26:2861-9. http://www.ncbi.nlm.nih.gov/pubmed/21062136. Accessed 4 Sep 2013
- Guérin A, Chen L, Wu EQ, et al. A retrospective analysis of therapy adherence in imatinib resistant or intolerant patients with chronic myeloid leukemia receiving nilotinib or dasatinib in a real-world setting. Curr Med Res Opin 2012;28:1155-62. http://www.ncbi.nlm.nih.gov/pubmed/22738777. Accessed 4 Sep 2013
- Guérin A, Wu EQ, Bollu VK, et al. The economic burden of pleural effusions in patients with chronic myeloid leukemia treated with tyrosine kinase inhibitors. J Med Econ 2013;16:125-33. http://www.ncbi.nlm.nih.gov/pubmed/22587385. Accessed 4 Sep 2013
- Elixhauser A, Steiner C, Kruzikas D. Comorbidity Software Documentation. 2004. HCUP Methods Series Report # 2004-1. ONLINE February 6, 2004. U.S. Agency for Healthcare Research and Quality. Available: http://www.hcupus.ahrq.gov/toolssoftware/comorbidity/comorbidity.jsp. Accessed 4 Sep 2013
- Quan H, Sundararajan V, Halfon P, et al. Coding algorithms for defining comorbidities in ICD-9-CM and ICD-10 administrative data. Med Care 2005;43:1130-9. http://www.ncbi.nlm.nih.gov/pubmed/16224307. Accessed 4 Sep 2013
- Schneeweiss S, Maclure M. Use of comorbidity scores for control of confounding in studies using administrative databases. Int J Epidemiol 2000;29:891-8