
Abstract
Objectives:
The goal of this study is to determine the cost-effectiveness of MIRISK VP, a next generation coronary heart disease risk assessment score, in correctly reclassifying and appropriately treating asymptomatic, intermediate risk patients.
Study design:
A Markov model was employed with simulated subjects based on the Multi-Ethnic Study of Atherosclerosis (MESA). This study evaluated three treatment strategies: (i) practice at MESA enrollment, (ii) current guidelines, and (iii) MIRISK VP in MESA.
Methods:
The model assessed patient healthcare costs and outcomes, expressed in terms of life years and quality-adjusted life years (QALYs), over the lifetime of the cohort from the provider and payer perspective. A total of 50,000 hypothetical individuals were used in the model. A sensitivity analysis was conducted (based on the various input parameters) for the entire cohort and also for individuals aged 65 and older.
Results:
Guiding treatment with MIRISK VP leads to the highest net monetary benefits when compared to the ‘Practice at MESA Enrollment’ or to the ‘Current Guidelines’ strategies. MIRISK VP resulted in a lower mortality rate from any CHD event and a modest increase in QALY of 0.12–0.17 years compared to the other two approaches.
Limitations:
This study has limitations of not comparing performance against strategies other than the FRS, the results are simulated as with all models, the model does not incorporate indirect healthcare costs, and the impact of patient or physician behaviors on outcomes were not taken into account.
Conclusions:
MIRISK VP has the potential to improve patient outcomes compared to the alternative strategies. It is marginally more costly than both the ‘Practice at MESA Enrollment’ and the ‘Current Guidelines’ strategies, but it provides increased effectiveness, which leads to positive net monetary benefits over either strategy.
Introduction
Cardiovascular disease ranks as the leading cause of disease and death in the US. It is responsible for one in six deaths annually and affects over 82,600,000 people, only half of whom are above the age of 60Citation1. Coronary heart disease (CHD) is the most prevalent and costly form of cardiovascular diseaseCitation2. In the US, Medicare, managed care plans, and other third-party payers bear a significant burden of the cost associated with CHD. In 2010 alone, the direct medical costs associated with CHD amounted to $35.7 billion, and they are expected to increase significantly—almost quadrupling from 2010 to 2030Citation3.
Although the burden of CHD is high due to the prevalence and costs (both direct and indirect), there is significant potential for reduction in incidence. Most heart disease cases are preventableCitation4–6. A recent summary of studies shows that a large proportion of CHD cases can be better controlled if identified and addressed properlyCitation7. The American Heart Association adopted a strategic goal for 2020, ‘to improve the cardiovascular health of all Americans by 20% while reducing deaths from cardiovascular disease by 20%’ (p. 973), because of the ample empirical support in the literature for establishing cardiovascular healthCitation8. To achieve this objective, improved risk assessment for cardiovascular events to guide targeted, early intervention could be a significant step in reducing CHD-related healthcare costs.
Unfortunately, the majority of CHD risk assessments are inaccurateCitation9–12. One study demonstrated that roughly 66% of patients who received risk scores had their true risk level under-estimatedCitation13. In addition, up to 40% of myocardial infarctions occurred in individuals determined to be of ‘intermediate risk’Citation14. The most commonly used method of determining CHD risk is the Framingham Risk Score (FRS). The FRS incorporates clinical characteristics such as smoking habits, cholesterol levels, blood pressure, age, and sex to calculate the 10-year risk of a CHD eventCitation15. The FRS does not include newer biomarkers like hsCRP, HbA1c, troponin, total cholesterol/HDL-cholesterol ratio, etc., as well as family history, comorbidities, and socioeconomic factors, thus it misses multiple pathways of disease development and progression. Characteristics incorporated into the FRS represent population trends and do not precisely predict an individual patient’s risk. Not only does the FRS tend to under-estimate an individual’s true risk score, because the risk assessment is expressed over a 10-year timeframe, it may fail to motivate patients to make lifestyle changes and adhere to medical treatmentCitation16.
The MIRISK VP test (Aviir, Inc., Irvine, CA) is a personalized, algorithm-based, risk prediction test that aims to improve upon risk assessment in several ways. The MIRISK VP test is based on blood-based biomarkers to assess a wide range of pathways that have been implicated in the development of vulnerable plaque, one of the main causes of acute coronary syndromesCitation17,Citation18. The MIRISK VP test also combines the biomarker data with conventional CHD risk factors, and presents patients and physicians with a shorter 5-year absolute risk of myocardial infarction or hospitalized angina on a scale of 0–100%Citation19. Analytical and clinical validation of the test have been presented elsewhereCitation20.
The aim of the current study is to investigate, from the provider and payer (both public and private) perspectives, the clinical and health economic impact in quality adjusted life years (QALY) of the MIRISK VP test over the lifetime of a population of patients who do not have a history of a cardiovascular event yet are being evaluated for CHD risk, and who have already been determined to be of ‘intermediate risk’ by other risk assessment methods. These individuals are facing a decision regarding interventions to manage their CHD risk. Under these circumstances, as in any evaluation of interventional effectiveness in a potentially chronic disease, QALYs take on a particular significance as a means of accounting for survival in the context of the individual’s quality-of-life and the potential manifestations of the disease.
Methods
Study design
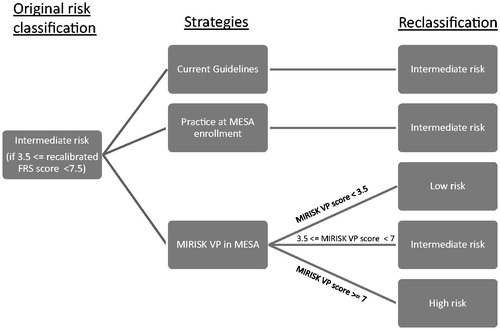
To evaluate the clinical and economic impact of the MIRISK VP test, we analyzed the cost-effectiveness of using it to guide therapy compared to two other relevant treatment strategies referred to as: ‘Practice at MESA Enrollment’ and ‘Current Guidelines’. All three strategies were evaluated on the intermediate category of risk, as identified by a re-calibrated version of the Framingham Risk score for CHD (accounting for event rates in the MESA cohort within a 5-year horizon). The ‘Practice at MESA Enrollment’ strategy evaluates the effect of maintaining the baseline patient treatment, for the intermediate risk population, as described in the MESA case-cohort sample. The ‘Current Guidelines’ strategy evaluates the effect of full adherence and implementation of the guidelines published on the prevention of CHD (ATP III and JNC7) for individuals at intermediate risk of CHD in a MESA-like cohortCitation21–25. Specifically, this approach entailed lifestyle advice and counseling; statin therapy initiation or intensification based on the patient’s risk category with a low-density lipoprotein cholesterol (LDL-C) target of 90 mg/dL for high risk individuals, 130 mg/dL target for intermediate risk individuals, and 160 mg/dL target for low risk individuals; and anti-hypertensive medication initiation or intensification based on the patient’s risk category with a target of 140 mm Hg systolic blood pressure for low and intermediate risk individuals, and a target of 130 mm Hg systolic blood pressure for high risk individuals. ‘Use of MIRISK VP in MESA’ evaluates the effect of treating, according to the same guidelines, intermediate risk individuals reclassified by MIRISK VP into a new risk category consistent with the test’s performance in the MESA cohortCitation19. The ‘Use of MIRISK VP in MESA’ strategy was the only one that included reclassification of these intermediate risk category individuals to either high or low risk categories, consistent with the validation performance of MIRISK VP in the MESA validation studyCitation19. Unlike the other two strategies where treatment guidelines only for the intermediate risk category were looked at, all three risk category guidelines were considered with the ‘Use of MIRISK VP in MESA’ strategy because individuals were reclassified by the test into those categories (). The treatment of the ‘Current Guidelines’ and ‘Practice at MESA Enrollment’ intermediate risk individuals was based on the guidelines being applied to the intermediate risk category.
Figure 1. Reclassification of intermediate risk group by strategy.
A state transition model was developed and populated considering the states of: healthy, first CHD event, subsequent CHD event, and mortality (non-CHD or CHD-related). The various transitions along with the potential transition probabilities for the model are shown in . The sum of all probabilities leaving a particular state must be equal to one. For example, after the first CHD event, the residual probability of survival is one minus the probability of mortality that is non-CHD-related.
Figure 2. Markov model flow diagram. Flow diagram demonstrating the three treatment strategies outlined for a patient at intermediate risk of coronary heart disease (CHD): Current Guidelines; Current Practice at MESA; or MIRISK VP in MESA.
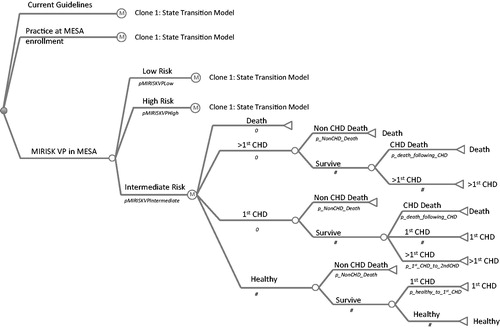
Markov model structure
During each fixed time interval (a 1-year interval was used in this analysis), individuals at any given state can move to another state, remain in the same state, or die. This represents a basic Markov model and the probability of transition between the states is assumed to follow the Markovian (first-order) principle, where the probability of transition is independent of both the states previously visited and the length of time spent in the particular state. The model assesses patient healthcare costs and outcomes, expressed in terms of life years and QALY, over the lifetime of the cohort, achieved by running the cohort of individuals through the model until the cohort is exhausted. The simulations were run with TreeAge Pro 2009 (Tree-Age Software, Williamstown, MA). A cohort of 50,000 hypothetical individuals was used for each of the three strategies at the reference model values, while the sensitivity analysis used a cohort of 20,000 individuals for each of the 500 runs with model parameter sampling.
Model inputs and data sources
Cost, effectiveness of treatment, and utilities, summarized in , were based on the literature while the reclassification rates of MIRISK VP were based on its validation study in the MESA cohortCitation19.
Table 1. Data included in the Markov modela.
Table 2. Baseline demographics of study sample and cohort with CHD risk between 3.5–7.5% (5-year intermediate risk population based on a calibrated Framingham CHD risk score).
The MESA cohort had 6814 participants 45–84 years old, self-identified as White, African-American, Hispanic, or ChineseCitation26. All participants were free of cardiovascular disease at study entry (2000–2002) and gave informed consent, although 1083 denied use of their samples for commercial purposes. The MIRISK VP validation was based on a sample of 675 subjects with complete clinical and biomarker data, selected as a case-cohort design from MESA, a study representative of the US population segment of interest in terms of age and ethnicity. The serum samples for the MIRISK VP validation study were collected at baseline under controlled pre-analytical processes and stored at −80°C until tested. Weighted average follow-up time for the cohort was 5.4 years (minimum 5 years). All incident CHD events (n = 222) from adjudicated medical records were selected (defined as the ‘All CHD’ outcome in MESA)Citation27. These included definite or probable MI (either abnormal cardiac biomarkers, evolving Q waves, or a combination of chest pain with ST-T evolution or new left bundle branch block ECG changes), resuscitated cardiac arrest, fatal CHD (MI within the prior 28 days, chest pain within 72 h, or a history of CHD, and no known non-cardiac cause of death), definite angina (chest pain symptoms with 70% or greater obstruction on coronary angiography, or evidence of ischemia by stress test or resting ECG), and probable angina (physician diagnosis) if accompanied by revascularization.
Event rates and transition probability calculation
To determine the transition probabilities, particularly as a function of age and sex, data from the MESA case-cohort sample of subjects were used to provide estimates of the probabilities of going from a reclassified state using the MIRISK VP test to a first CHD event. A total of 237 individuals (129 males; 108 females) were identified as intermediate risk by the calibrated FRS in the MESA case-cohort sampleCitation19 (Table 2). A Cox proportional hazard regression model with appropriate cohort weighting was used with these cohorts to estimate the hazard function for the risk of CHD adjusting for age and sexCitation28. The Kaplan-Meier method was used to determine the baseline survivor function which was combined with the Cox model to estimate the requisite transition probabilities. Sex-specific transition probabilities were used in the model only in those cases when the age–sex strata Cox regression coefficients were statistically significant at the 0.05 level (males in the intermediate risk and females in the reclassified low risk categories), otherwise the average transition probability for the cohort was used for both sexes.
Other parameters of the model including utilities, costs, and various outcome rates were populated using the values given in . Costs were discounted at 3% per year.
Mortality for non-CHD causes was based on US mortality tables by age and sex categoriesCitation29. The mortality rate after a CHD event was based on results reported previouslyCitation25. The effect of mortality rate on the results was evaluated through a one-way sensitivity analysis.
Key outcomes of the analyses
The goal of this study was to evaluate the MIRISK VP test relative to the practice at MESA enrollment and the current guidelines applied in MESA strategies. The comparison was based on the clinical outcome of survival (overall life expectancy and QALY) and cost functions. The latter included total costs, and both incremental cost-effectiveness ratio (ICER) per QALY and net monetary benefit (NMB), because ICER and NMB represent different ways of looking at the differential cost effectiveness.
Sensitivity analyses
A probabilistic sensitivity analysis was conducted using a range of values selected at random from various probability distributions. In addition, univariate sensitivity analyses were conducted for the variables: disutility (separately for men and women), MIRISK VP test price, anti-hypertensive medication cost, adherence probability, first year cost of a CHD, and cost of statin medication. The ranges are shown in .
Table 3. Probabilistic and univariate sensitivity analysis parameters and ranges.
The same Markov modeling with a separate sensitivity analysis was used for only those individuals who were 65 years and older given that they represent a higher risk group for CHD events.
Results
The model indicates that overall survival is highest in the MIRISK VP test group (98.5% survival at cohort exhaustion) compared to the ‘Current Guidelines’ group (98.2%) or the ‘Practice at MESA Enrollment’ group (98.0%). These differences are statistically significant (p < 0.001) by Monte Carlo simulation of the exact sampling distribution. The significant differences in survival were also maintained under conditions set forth in the sensitivity analyses (), where no one variable influenced the results, indicating model robustness. The cost, QALYs, ICER, and NMB analyses are provided in .
Table 4. Clinical effectiveness of strategies at the end of the simulation. Number of individuals in each category at the end of the simulation.
Table 5. Itemized total costs, life expectancy, QALYs, ICERs, and net monetary benefits within the base model (reference values) and under a sensitivity analysisa.
The MIRISK VP test strategy resulted in a higher total lifetime cost ($3735) than the practice at MESA enrollment strategy. The MIRISK VP strategy showed a slightly higher average QALY of 0.12–0.17 years and a longer life expectancy from 0.48–0.6 months than the other two groups with a higher NMB of $4421–$5403. Using the ‘Practice at MESA Enrollment’ as the reference strategy, MIRISK VP has a more than 3-fold lower ICER compared to the ‘Current Guidelines’ strategy ($22,895/QALY vs $71,456/QALY).
An evaluation of the 65 years and older sub-group indicated very similar outcomes for the MIRISK VP test strategy as for the full cohort group with a lower mortality rate (0.9%) after the first CHD with the MIRISK VP test strategy compared to the ‘Current Guidelines’ (1.3%) and the ‘Practice at MESA Enrollment’ (1.4%); the respective mortality rates for the full cohort group are 1.1%, 1.6%, and 1.7%. For the 65 years and older sub-group, the QALY average ∼0.12–0.15 higher for the MIRISK VP test strategy vs 0.12–0.17 QALY with the full cohort. In the 65 years and older sub-group, the MIRISK VP test strategy is more costly than the other two strategies ($10,836 vs $10,026 and $7725), nevertheless, the MIRISK VP test NMB is higher by $4222–$5528 compared to the other strategies.
The sensitivity analyses showed that the relative differences between the three strategies were maintained with respect to mean costs, total lifetime costs, quality adjusted years of survival, incremental cost/QALY and net monetary benefits (). This was true for both the entire cohort and the 65 years and older sub-group. However, the absolute numbers were lower for costs compared to the reference model, but higher for survival (total and quality adjusted). The significance of this is unclear.
The univariate sensitivity results are shown in . For all of the variables considered, MIRISK VP remained the most effective, although not the dominant strategy.
Table 6. Univariate sensitivity analyses.
Discussion
The goal of this study was to show the benefit of a test that identifies patients with coronary heart disease who would otherwise be considered at intermediate risk, but eventually experience a myocardial infarction. The identification of risk is expected to lead to better prevention or treatment, and, ultimately, better health outcomes. Our study focused on the clinical and economic impact of using the MIRISK VP test over a lifetime in a population of patients who do not have a history of a cardiovascular event, are being evaluated for risk for cardiovascular disease, have already been determined to be of ‘intermediate risk’ by other risk assessment methods, and are facing a decision regarding medical and other interventions to manage their CHD risk.
MIRISK VP integrates information from multiple biological pathways implicated in the development and progression of cardiovascular disease. It provides physicians with a useful tool to further evaluate the risk of intermediate-risk patients, as ACCF/AHA guidelines recommendCitation30. This type of risk assessment, which is orthogonal to classic risk factor assessment and management, can be integrated into the clinical care of all patients who are categorized as intermediate risk. This is consistent with the recommendations of the American College of Preventive Medicine, suggesting that biomarkers may be helpful in reclassifying intermediate risk individuals, thus enabling more favorable risk factor modification and greater focus on prevention, both of which could substantially reduce cardiovascular deathsCitation31,Citation32.
In addition, focusing on a 5-year rather than a 10-year horizon, as the MIRISK VP test does, may motivate patients to comply better with therapeutic interventions and guideline-based therapiesCitation16. Patient motivation is a key factor in statin therapy adherence, improvement of which could significantly impact clinical outcomesCitation33,Citation34.
The simulated models presented in this study provide patients, clinicians, third-party payers, and other financial stakeholders a valuable framework with which to evaluate the likely cost and effectiveness outcomes for real-life scenarios. From the provider and payer perspective, MIRISK VP can improve cost-effectiveness by better allocating resources, i.e., reducing unnecessary treatment for intermediate risk people who are actually at low risk while enabling more complex interventions only for those who are reclassified to high risk.
This study demonstrates potentially improved patient outcomes associated with the use of the MIRISK VP test to direct treatment decisions compared to treatments provided without such advanced testing. Specifically, the Markov model indicated that the MIRISK VP test may reduce the mortality rates of the patients after first and subsequent CHDs within the simulated cohort, and increase the NMB by ∼4000–6000 units. It also reduces the ICER compared to the ‘Current Guidelines’ strategy by ∼3-fold.
Overall, the rate of CHD event occurrence in the study population was low. Nevertheless, reductions in cardiovascular events occurred for patients reclassified with the MIRISK VP test to identify their more appropriate treatment. The difference in life expectancy between the three strategies of roughly 0.48–0.6 months is statistically significant, yet relatively small. One uncertainty that remains after this study of the value of serum biomarker monitoring is how this information can be integrated into ongoing treatment regimens for classical risk factors. Clarifying such uncertainty will entail studies investigating various intervention strategies with strict monitoring of the outcomes to determine the best use of these new data for the management of heart disease patients.
The modeling shows higher costs using the MIRISK VP test compared to the other two strategies, yet with desirable higher NMB and lower ICER. This study has several limitations. Results have been obtained for intermediate risk individuals as defined by a recalibrated FRS only, and it does not compare performance against other strategies incorporating net reclassification based on available risk scores such as the Reynolds score, SCORE, QRISK2, etc. Also, as with all models, the results are simulated and have not been confirmed in actual patients in a clinical setting. The model does not incorporate indirect healthcare costs (e.g., loss of productivity and caregiver burden associated with myocardial infarction). Incorporating those costs may affect the results. Furthermore, the potential benefits of the MIRISK VP test (increased compliance and behavioral changes that can result from patients having a better understanding of their CHD risk) were not incorporated into the model. In this era of the medical home and consumer-directed healthcare, the impact of patient behaviors on outcomes warrants further study. Similarly, the analysis did not take into account the expected changes in physician adherence to treatment regimens based on a patient’s MIRISK VP test result.
Conclusion
This analysis demonstrates that MIRISK VP has the potential to improve patient outcomes by showing the cost-effectiveness advantage of the MIRISK VP test compared to current guidelines and the practice at study enrollment using the MESA cohort characteristics. Although it is marginally more costly due to increased effectiveness than the ‘Practice at MESA Enrollment’ and the ‘Current Guidelines’ strategies, using the MIRISK VP test provides higher NMB. This analysis can help healthcare stakeholders make more informed decisions about how to efficiently manage healthcare resources.
Transparency
Declaration of funding
Funding for the study was provided by Aviir, Inc., Irvine, CA, USA.
Declaration of financial and other relationships
EH, MB, and CF are employees of Aviir, Inc. ML and KT are paid consultants to Aviir, Inc.
Acknowledgments
The authors thank Dr Matthew D. Solomon and Professor Nathan Wong for their critical review of the manuscript. The authors would also like to thank Mr Jason Moore for his review of the modeling assumptions and Mr Jean-Ezra Yeung for helping with the preparation of the manuscript.
References
- Go AS, Mozaffarian D, Roger VL, et al. Heart disease and stroke statistics – a 2013 update: a report from the American Heart Association. Circulation 2013;127:e6-245
- Druss BG, Marcus SC, Olfson M, et al. Comparing the national economic burden of five chronic conditions. Health Aff (Millwood) 2001;20:233-41
- Heidenreich PA, Trogdon JG, Khavjou OA, et al. Forecasting the future of cardiovascular disease in the United States: a policy statement from the American Heart Association. Circulation 2011;123:933-44
- Yusuf S, Hawken S, Ounpuu S, et al. Effect of potentially modifiable risk factors associated with myocardial infarction in 52 countries (the INTERHEART study): case-control study. Lancet 2004;364:937-52
- World Health Organization. Data and statistics. http://www.euro.who.int/en/health-topics/noncommunicable-diseases/cardiovascular-diseases/data-and-statistics. Accessed on November 15, 2013
- Center for Disease Control and Prevention. Preventable deaths from heart disease & stroke. http://www.cdc.gov/VitalSigns/pdf/2013-09-vitalsigns.pdf. Accessed on November 15th, 2013
- Capewell S, Ford ES, Croft JB, et al. Cardiovascular risk factor trends and potential for reducing coronary heart disease mortality in the United States of America. Bull WHO 2010;88:120-30
- Appel LJ. Empirical support for cardiovascular health: the case gets even stronger. Circulation 2012;125:973-4
- Chatellier G, Blinowska A, Menard J, et al. Do physicians estimate reliably the cardiovascular risk of hypertensive patients? Medinfo 1995;8:876-9
- Grover SA, Lowensteyn I, Esrey KL, et al. Do doctors accurately assess coronary risk in their patients? Preliminary results of the Coronary Health Assessment Study. BMJ 1995;310:975-8
- Friedmann PD, Brett AS, Mayo-Smith MF. Differences in generalists’ and cardiologists’ perceptions of cardiovascular risk and the outcomes of preventive therapy in cardiovascular disease. Ann Intern Med 1996;124:414-21
- Meland E, Laerum E, Stensvold I. Assessment of coronary heart disease risk, I: a postal inquiry among primary care physicians. Fam Pract 1994;11:117-21
- Montgomery AA, Fahey T, MacKintosh C, et al. Estimation of cardiovascular risk in hypertensive patients in primary care. Br J Gen Practice 2000;50:127-8
- Khot UN, Khot MB, Bajzer CT, et al. Prevalence of conventional risk factors in patients with coronary heart disease. JAMA 2003;290:898-904
- Wilson PW, D’Agostino RB, Levy D, et al. Prediction of coronary heart disease using risk factor categories. Circulation 1998;97:1837-47
- Hill S, Spink J, Cadilhac D, et al. Absolute risk representation in cardiovascular disease prevention: comprehension and preferences of health care consumers and general practitioners involved in a focus group study. BMC Public Health 2010;10:108
- Virmani R, Burke AP, Farb A, et al. Pathology of the vulnerable plaque. J Am Coll Cardiol 2006;47:C13--C18
- Naghavi M, Libby P, Falk E, et al. From vulnerable plaque to vulnerable patient: a call for new definitions and risk assessment strategies: part I. Circulation 2003;108:1664-72
- Cross DS, McCarty CA, Hytopoulos E, et al. Coronary risk assessment among intermediate risk patients using a clinical and biomarker based algorithm developed and validated in two population cohorts. Curr Med Res Opin 2012;28:1819-30
- Nolan N, Tee L, Vijayakumar S, et al. Analytical performance validation of a coronary heart disease risk assessment multi-analyte proteomic test. Expert Opin Med Diagn 2013;7:127-36
- Grundy SM, Cleeman JI, Merz CN, et al. Implications of recent clinical trials for the National Cholesterol Education Program Adult Treatment Panel III guidelines. Circulation 2004;110:227-39
- Pearson TA, Blair SN, Daniels SR, et al. AHA Guidelines for primary prevention of cardiovascular disease and stroke: 2002 update: Consensus Panel Guide to comprehensive risk reduction for adult patients without coronary or other atherosclerotic vascular diseases. Circulation 2002;106:388-91
- National Health, Lung, and Blood Institute. Third Report of the Expert Panel on Detection, Evaluation, and Treatment of High Blood Cholesterol in Adults (Adults Treatment Panel III). http://www.nhlbi.nih.gov/guidelines/cholesterol/. Accessed October 16, 2013
- National Health, Lung, and Blood Institute. The Seventh Report of the Joint National Committee on Prevention, Detection, Evaluation, and Treatment of High Blood Pressure (JNC 7). http://www.nhlbi.nih.gov/guidelines/hypertension/. Accessed October 16, 2013
- van Kempen BJ, Spronk S, Koller MT, et al. Comparative effectiveness and cost-effectiveness of computed tomography screening for coronary artery calcium in asymptomatic individuals. J Am Col Cardiol 2011;58:1690-701
- Bild DE, Bluemke DA, Burke GL. Multi-Ethnic Study of Atherosclerosis: objectives and design. Am J Epidemiol 2002;156:871-81
- Luepker RV, Apple FS, Christenson RH, et al. Case definitions for acute coronary heart disease in epidemiology and clinical research studies: a statement from the AHA Council on Epidemiology and Prevention; AHA Statistics Committee; World Heart Federation Council on Epidemiology and Prevention; the European Society of Cardiology Working Group on Epidemiology and Prevention; Centers for Disease Control and Prevention; and the National Heart, Lung, and Blood Institute. Circulation 2003;108:2543-9
- Venables WN, Ripley BD. Modern applied statistics with S. 4th ed. New York, NY: Springer, 2002
- World Health Statistics. Life tables for WHO Member States. WHO, 2012. http://www.who.int/whois/database/life_tables.cfm. Accessed February 1, 2013
- Greenland P, Alpert JS, Beller GA, et al. 2010 ACCF/AHA guideline for assessment of cardiovascular risk in asymptomatic adults: executive summary. JACC 2010;56:2182-99
- Lim LS, Haq N, Mahmood S, et al. Atherosclerotic cardiovascular disease screening in adults: American College of Preventive Medicine Position Statement on Preventive Practice. Am J Prev Med 2011;40:381.e1-10
- Farley TA, Dalal MA, Mostashari F, et al. Deaths preventable in the U.S. by improvements in use of clinical preventive services. Am J Prev Med 2010;38:600-9
- Goldman DP, Joyce GF, Karaca-Mandic P. Varying pharmacy benefits with clinical status: the case of cholesterol-lowering therapy. Am J Manag Care 2006;12:21-8
- Lardizabal JA, Deedwania PC. Benefits of statin therapy and compliance in high risk cardiovascular patients. Vasc Health Risk Manag 2010;6:843-53
- Adabag AS, Therneau TM, Gersh BJ, et al. Sudden death after myocardial infarction. JAMA 2008;300:2022-9
- Nyman JA, Barleen NA, Dowd BE, et al. Quality-of-life weights for the US population: self-reported health status and priority health conditions, by demographic characteristics. Med Care 2007;45:618-28
- Pletcher MJ, Earnshaw SR, Auer R, et al. Abstract 11670: using the coronary calcium score to guide statin therapy: a cost-effectiveness analysis. Circulation 2012;126:A11670
- Consumer Reports Health. Evaluating statin drugs to treat: high cholesterol and heart disease: comparing effectiveness, safety and price. Consumer Reports. http://www.consumerreports.org/health/resources/pdf/best-buy-drugs/StatinsUpdate-FINAL.pdf. Accessed February 1, 2013
- Hong SH, Wang J, Tang J. Dynamic view on affordability of fixed-dose combination antihypertensive drug therapy. Am J Hypertension 2013;26:879-87