
Abstract
Background:
Through a retrospective database analysis, this study seeks to provide an understanding of the utilization of SMBG by insulin therapy and diabetes type and to estimate healthcare costs of blood glucose monitoring in the UK diabetes population.
Methods:
Data were obtained from the IMS LifeLink Electronic Medical Record-Europe (EMR-EU) Database, a longitudinal database containing anonymized patient records from physician–practice data systems of office-based physicians in the UK. Depending on the insulin types used for type 1 and type 2 diabetes, patients were sub-categorized into one of four insulin regimen groups (basal, bolus, pre-mixed, or basal-bolus). Frequency of blood glucose testing was assessed descriptively throughout the 12-month post-index period, and generalized linear models were used to evaluate the effect of baseline characteristics, including insulin type, on the likelihood of blood glucose test utilization. Healthcare resource utilization and costs for all-cause services were assessed by insulin type.
Results:
This study identified 8322 type 1 and type 2 diabetes patients with two insulin pharmacy records between January 1, 2009 and December 31, 2010. After applying study inclusion and exclusion criteria, a total of 2676 (32.2%) insulin-treated diabetes mellitus patients in the UK were identified, with the number of pharmacy blood glucose test strips averaging 771.1 (median 600). The glucose testing frequency was lowest among basal-only insulin patients and pre-mixed insulin patients (mean = 576.2 [median = 450] and mean = 599.5 [median = 500], respectively; non-significantly different) compared to other insulin types.
Conclusion:
Although the data did not capture the glucose frequency comprehensively, it varied significantly by insulin types, and was higher than what is recommended in the guidelines for patients with type 2 diabetes.
Background
Globally, 346 million people were estimated to have diabetes in 2011, and this number will more than double by 2030 according to the latest estimates by the World Health OrganizationCitation1,Citation2. Similar to the global trends, in the UK, the prevalence of diabetes rose from 3.6% in 2005–2006 to 4.5% in 2010–2011Citation3. In excess of 2.6 million people have been diagnosed with diabetes, and it is believed that this will increase to more than 4 million by 2025Citation4. As such, the National Health Service (NHS) recognizes diabetes as a high profile clinical area.
Adequate glycemic control is essential in postponing, or in some instances preventing, the serious complications that are universally associated with diabetes such as heart disease, peripheral vascular disease, vision loss, and kidney failureCitation5. The most standard procedure for tracking glycemic control is by measuring HbA1c, which gives an average of the blood glucose over the previous 3 months. However, HbA1c level does not inform patients about their blood glucose on a daily basis. A more judicious estimate can be obtained by direct testing, which is done by finger or other skin prick to obtain a small amount of blood, putting that sample on a testing strip, and viewing the result with a pocket-sized meter. This type of testing can be done at all times of day, including prior to or following exercise as well as before or after eating, to monitor any changes in blood glucose levels resulting from activity or food intake.
It is well documented that self-management by the diabetes patient is one of the most difficult and time-consuming management regimens of any lifelong illnessCitation6–9. Patients must perform blood glucose monitoring, take multiple medications, adhere to strict diet plans, and exercise on a regular basisCitation10,Citation11. Diabetes patients who use insulin improve glycemic control and lessen hypoglycemia by allowing for self-regulation in insulin dosage based on their blood glucose meter readingsCitation10,Citation11. Key professional and patient organizations, including the National Institute for Health and Clinical Excellence (NICE), have long recognized self-monitoring of blood glucose (SMBG) to be an essential part of effective patient managementCitation12–15. This has been supported by an abundance of research that has consistently demonstrated that SMBG is a key contributor to good glycemic control among insulin-using patients with type 1Citation16,Citation17 and type 2 diabetesCitation18–20. SMBG is recommended four or more times daily for most patients with type 1 diabetes and at least once daily for persons with type 2 diabetesCitation16,Citation17,Citation21. SMBG, while an important component of diabetes management, exerts a significant burden both in terms of patient monitoring as well as in terms of economic consequences.
There has been some recent research on the satisfaction and frequency of SMBG in the UKCitation22,Citation23. A 2008 study found that, among patients with type 2 diabetes, those patients treated with insulin used SMBG at a greater frequency than those patients not treated with insulin (median 10-times per week vs 4-times per week; p < 0.01)Citation22. In a 2010 survey study, over 80% of patients reported a high satisfaction with the usefulness of SMBG and reported feeling more ‘in control’ of the management of their diabetesCitation23. Although these survey studies provided initial insights on the frequency of SMBG, only limited data are available from the UK. Through a retrospective database analysis, our study seeks to provide additional understanding of the utilization of SMBG by insulin therapy and diabetes type and to estimate healthcare costs of blood glucose monitoring in the UK diabetes population.
Methods
Data were obtained from the IMS LifeLink Electronic Medical Record-Europe (EMR-EU) Database, a longitudinal database containing anonymized patient records from physician–practice data systems of office-based physicians in the UK, France, and Germany. In the UK, data are collected from general practitioners (GPs); the patient is assigned to a single GP, who co-ordinates all of the patient’s care. The UK data has ∼4.2 million patient records from 1151 physicians in 218 practices; data are available from 1991.
Data in the LifeLink EMR-EU database include basic demographics (age and gender), medical diagnoses (in ICD-10-CM format), visit dates, and detailed physician-written prescription information, including the Anatomical Therapeutic Chemical (ATC) classification code, medication generic name, form, strength, pack size and pack price, prescribed quantity, and daily dose. The prescription information is linked to the ICD-10-CM medical diagnoses.
Inclusion criteria
To be selected into the study population, patients had to meet each of the following inclusion criteria:
At least two prescriptions for insulin (any type) during the period from January 1, 2009 through December 31, 2010 (‘index window’); the date of the first insulin record for each patient during the index window was considered the ‘index date’;
At least 6 months of recorded data prior to the index date (‘pre-index period’) and at least 12 months of recorded data following the index date (‘post-index period’). The pre-index period was used for describing baseline characteristics and the post-index period for the measurement of outcomes;
A diagnosis for type 1 or type 2 diabetes mellitus (DM) on the index date or in the 6-month pre-index period;
Persistent with any insulin therapy throughout the 12-month post-index period. A modified version of a persistence measure that has been implemented previously in insulin studies using claims databases was utilizedCitation24. Specifically, patients were considered persistent with insulin if they did not have a gap exceeding 90 days between two consecutive insulin prescriptions of any type at any time during the 12-month post-index period; and
At least one pharmacy record for blood glucose test strips during the 12-month follow-up period, to ensure SMBG behavior and utilization in the final cohort for analysis.
Exclusion criteria
Patients were removed from the study population if they met any of the following exclusion criteria:
Aged <4 years on the index date;
With prescriptions for more than one category of insulin (basal only, pre-mixed, basal-bolus, bolus only) within ±30 days of the index date (including the index date); and
With two different types of insulin at baseline (other than combination basal-bolus insulin) to avoid incorrectly attributing outcome behaviors to multiple insulin groups (misclassification).
Measurements
All data were reported for the aggregate population and by the four cohort classifications (i.e., basal only, pre-mixed, basal-bolus, bolus only). Unless otherwise specified, results for categorical measures were provided as the frequency (number of cases) and percentage of total patients observed in each category. For continuous variables, descriptive statistics (mean, standard deviation [SD], and median) were calculated. When necessary, continuous variables were categorized into intervals, with the distribution of patients (n, %) for each interval provided. p-Values using the Pearson chi-square test for categorical variables and the Wilcoxon rank-sum test for continuous variables were generated to evaluate differences in outcomes between cohorts; a p-value <0.05 was considered statistically significant. Statistical testing was conducted by index insulin therapy group, comparing basal only insulin patients to (1) pre-mixed insulin patients, (2) basal-bolus insulin patients, and (3) bolus only insulin patients. All analyses were based on observed, not projected, data.
Baseline patient demographics and clinical characteristics
Baseline patient characteristics were evaluated and included age, gender, diabetes mellitus type, body mass index (BMI), smoking status (never, current, former), and HbA1c status (good control [<7%], poor control [7–10%], very poor [>10%]).
Blood glucose testing
Frequency of blood glucose testing was monitored throughout the 12-month post-index period, including the index date, through the following means:
Evidence of laboratory/diagnostic tests, including records for blood glucose methods, blood glucose results, glucose tolerance tests, and self-monitoring of blood glucose; and
Evidence of pharmacy blood glucose test strips (prescriptions).
While each record for the laboratory/diagnostic test was counted as one incidence of blood glucose testing, the quantities dispensed of blood glucose strips through pharmacy records were used to assess utilization (e.g., a pharmacy order of 50 blood glucose test strips was counted as 50 tests, based on the quantity field on the record). Laboratory/diagnostic blood glucose testing records were accounted for separately from blood glucose test strip utilization through the pharmacy.
Healthcare resource utilization and costs for all-cause services
Because the EMR-EU database contains direct data only on utilization of services and prescription medications provided by a particular physician member of the panel, patient utilization of services provided by other physicians and through inpatient hospitals must be inferred from the data on referrals.
As full cost information is not available in the EMR-EU database, unit costs were identified and applied to the most commonly used resources to obtain the total direct costs in the UK. Direct costs are available in the EMR-EU database for prescription medications written by the patient’s general practitioner; those medications prescribed by specialists or in the inpatient setting are not captured. Direct costs for physician and outpatient clinic visits were estimated by multiplying the number of visits during the patient’s follow-up period by the unit cost (unit costs derived from the National Schedule of Reference Costs for the UK; available at http://www.pssru.ac.uk). Direct costs for inpatient hospitalizations were estimated by multiplying the number of hospital referrals during the patient’s follow-up period by the unit cost for an elective and non-elective inpatient stay.
Healthcare costs were reported for pharmacy services, physician/outpatient clinic visits, and inpatient admissions over the 12-month post-index period, and pharmacy costs are broken down further into blood glucose test strips, insulin therapy, oral anti-diabetic (OAD) medications, and all other pharmacy records. For insulin cost calculations, one pack per prescription was applied to mirror clinical reality.
Multivariate analyses
Generalized linear models were used to evaluate the effect of baseline characteristics, including insulin type, on the likelihood of blood glucose test utilization, specifically to assess whether glucose testing differences in the four insulin type cohorts persisted after controlling for observed demographic and clinical characteristics. Four separate regression analyses were conducted for each of the index insulin therapy/insulin type groups individually. The covariates that were included as independent variables in the models were age group, gender, diabetes mellitus type, BMI, smoking status, HbA1c status, new or continuous insulin therapy, diabetes-related complications, and all-cause total costs during the 6-month pre-index period.
Results
Patient identification
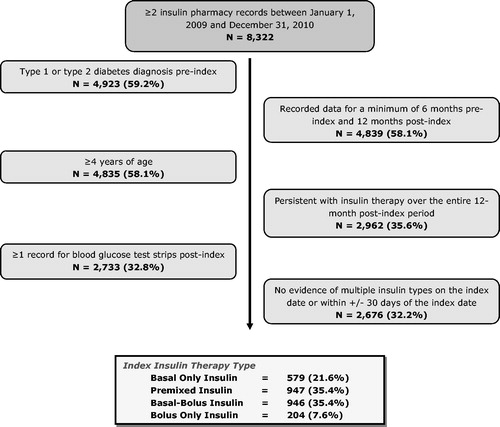
In this study, 8322 patients were identified with two insulin pharmacy records between January 1, 2009 and December 31, 2010; after applying study inclusion and exclusion criteria, a total of 2676 (32.2%) insulin-treated diabetes mellitus patients in the UK were identified. Patients were stratified into four cohort classifications (basal only, pre-mixed, basal-bolus, bolus only); 35.4% of patients used pre-mixed insulin, another 35.4% were classified as basal-bolus insulin users, and <10% of patients were bolus only insulin. shows the patient selection process.
Figure 1. Identification of the Diabetes Mellitus UK study sample, by reason.
Demographics and clinical characteristics
The average age of the aggregate cohort was 54.1 years (median = 57 years), with more males than females (57.6% vs 42.4%). The average BMI among those patients with available data (56.4%) was 30.8 kg/m2 (median = 30 kg/m2), with half of these patients (50.6%) qualifying as obese. Of the 50.3% of patients with smoking status information, ∼40% were former smokers and another 40% had never smoked. About two-thirds (67.6%) of patients had HbA1c data; 69.6% of these patients had a status of borderline control (i.e., between 53 mmol/mol (7%) and 86 mmol/mol (10%)), while only 11.3% were listed as having good control (<53 mmol/mol (<7%)).
Baseline characteristics of the four cohorts are shown in . Compared to basal only insulin patients, a greater proportion of patients on pre-mixed insulin had good or borderline control, as evidenced by HbA1c status (p = 0.004). When comparing basal only insulin patients to basal-bolus insulin patients, the former were significantly older (median 63 years vs 48 years; p < 0.001) and more likely to be female (44.9% vs 39.5%; p = 0.039) and to be obese (56.3% vs 40.4%; p < 0.001). Additionally, a greater proportion of basal only insulin patients had an HbA1c status of poor control (p < 0.001). Similar results were found for age when comparing basal only insulin patients and bolus only insulin patients (p < 0.001). In this comparison, however, there was no difference in HbA1c status between the two cohorts.
Table 1. Baseline characteristics of Iinsulin-treated diabetes patients.
In the aggregate population, a higher proportion of patients were diagnosed as type 2 diabetes (54.4% vs 45.6%).
Blood glucose testing over 12 months
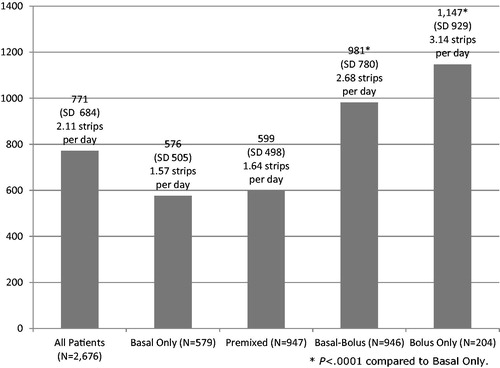
Blood glucose testing over the 12-month post-index period is presented in , with the number of pharmacy blood glucose test strips averaging 771.1 (median = 600). There was significantly fewer pharmacy blood glucose test strips among basal only insulin patients (mean = 576.2 [median = 450]) compared to basal-bolus insulin patients (mean = 981.1 [median = 801]; p < 0.001) and bolus only insulin patients (mean = 1146.7 [median = 1050]; p < 0.001); there was no difference in total test strips between basal only insulin patients and pre-mixed insulin patients. Fewer test strips were found among type 2 diabetes patients compared to type 1 diabetes patients (mean = 566.2 [median = 450] vs 1015.6 [median = 850]; p < 0.001).
Figure 2. Blood glucose test strips used over 12-months post-index.
All-cause healthcare costs over 12 months
All-cause total costs over 12 months post-index averaged £4973 (median = £3626) in the aggregate patient sample. Approximately 74.8% of the total costs were attributable to non-pharmacy services (mean = £3722 [median = £2400]). Among all pharmacy costs (mean = £1251 [median = £1101]), those for insulin therapy were a significant contributor, averaging £450 (median = £416). The total average cost for inpatient admissions was £1375, although the median was £0 due to fact that only a few patients were admitted to hospital during the post-index period.
Basal only insulin patients had significantly higher total costs vs pre-mixed insulin patients, basal-bolus insulin and bolus only insulin patients (). Compared to pre-mixed insulin patients, basal only insulin patients had significantly higher average all-cause pharmacy costs (£1216 [median = £1094] vs £1142 [median = £984]; p < 0.001), due primarily to the significantly higher costs for insulin therapy, which were 32% higher in the basal only insulin patients (). Conversely, basal only insulin patients had significantly lower average total all-cause pharmacy costs compared to basal-bolus insulin patients (£1395 [median = £1252]; p < 0.001), with basal-bolus insulin patients also having ∼72% higher costs for blood glucose test strips and over 42% higher costs for insulin therapy. Bolus only insulin patients had costs for blood glucose test strips that were twice as high as those for basal only insulin patients, but there was no difference between these cohorts in the average costs for insulin therapy. Physician visit and outpatient clinic visit costs were significantly higher among basal only insulin patients compared to pre-mixed insulin patients, basal-bolus insulin patients, and bolus only insulin patients (p < 0.01 for all comparisons).
Table 2. All-cause costs (GBP) over 12 months—mean (SD).
In summary, these data indicate that diabetes type differed significantly among patient cohorts, with basal only and pre-mixed insulin patients being primarily type 2, and basal-bolus and bolus only insulin patients diagnosed as type 1. Average blood glucose testing utilization, defined as the quantity dispensed on the pharmacy record, was lowest among basal only insulin patients, although there was no significant difference in utilization between these patients and pre-mixed insulin patients. All-cause total costs were highest among basal only insulin patients; depending on the index insulin therapy group, insulin therapy accounted for 28–43% of the all-cause total pharmacy costs, while 14–29% of the total all-cause pharmacy costs were attributable to the blood glucose test strips.
Factors associated with blood glucose testing
Similar results were found in the adjusted analysis of the aggregate population, with no differences found between basal only insulin patients and pre-mixed insulin patients, while basal-bolus insulin patients had 47% higher utilization, and bolus only insulin patients had 54% higher utilization compared to basal only insulin patients (). Age, diabetes type, continuous insulin use, and all-cause total medical care costs pre-index all impacted blood glucose testing utilization.
Table 3. Multivariate analysis of blood glucose testing utilization over 12 months post-index.
Patients with higher all-cause total costs pre-index had 8% higher utilization of testing. Pediatric patients and patients new to insulin therapy also had higher utilization, as should be expected. In the pre-mixed insulin cohort, both pediatric patients (53%) and elderly patients (28%) had significantly higher utilization of blood glucose testing, as did patients diagnosed with type 1 diabetes (28%), those new to insulin therapy (33%), and those with higher costs pre-index (11%). Similarly, utilization of blood glucose testing among basal-bolus insulin patients was influenced by age (both pediatric and the elderly), diabetes type, prior use of insulin therapy, and total pre-index medical costs, while blood glucose testing utilization among bolus only insulin patients was affected by diabetes type and all-cause total costs pre-index.
In summary, diabetes type and age had significant effects on utilization of blood glucose testing among all four index insulin therapy cohorts, as did (to a lesser extent) pre-index total healthcare costs. Prior use of insulin therapy also had a significant impact, but only among three of the four cohorts (bolus insulin only being the exception).
Discussion
This retrospective cohort study of blood glucose testing among insulin-treated diabetes patients in the UK indicates that the number of blood glucose test strips averaged 771.1 (2.11 strips per day) over the course of a 12-month period; this is similar to the previous US study where an overall mean utilization for pharmacy-based SMBG was 764.3 strips per yearCitation25. As a result, 28–43% of the total all-cause pharmacy costs were attributable to blood glucose test strips. This glucose testing frequency was primarily driven by basal-bolus insulin patients (mean = 981.1 [median = 801]) and bolus only insulin patients (mean = 1146.7 [median = 1050]) and type 1 diabetes patients; it was lowest among basal only insulin patients and pre-mixed insulin patients (mean = 576.2 [median = 450] and mean = 599.5 [median = 500] respectively; non-significantly different), and fewer test strips were found among type 2 diabetes patients compared to type 1 diabetes patients (mean = 566.2 [median = 450] vs 1015.6 [median = 850]; p < 0.001). Of note, basal only and pre-mixed insulin patients are primarily type 2, while basal-bolus and bolus only insulin patients are diagnosed as type 1. In the multivariate analysis, the similar patterns persisted as the glucose testing frequency was influenced by both insulin type and diabetes type. In addition, age (both pediatric and the elderly) and prior use of insulin therapy emerged as significant factors associated with glucose testing frequency.
Our UK study results differ somewhat from previous analyses conducted using Canadian and US dataCitation25,Citation26. In the US and Canadian studies, the pre-mixed insulin cohort exhibited the lowest utilization of blood glucose strips in both the descriptive and multivariate analyses. Differences in the costs of the blood glucose strips as a component of the total costs also was observed, although this most likely was due to the definition and calculation of all-cause total pharmacy costs among studies.
The previous UK studiesCitation22,Citation23, carried out by a survey, offered initial insights into the glucose testing behaviors in the UK. The weekly frequency of 10-times per week by insulin users (1.42 per day) found in Farmer et al.’sCitation22 study, significantly below what we have found in our study, might be attributable to the fact that it was a survey of 554 patients and could not benefit from a large number of observations actually recorded in an EMR dataset. Barnard et al.’sCitation23 study, also a survey study, concluded that 43% of survey participants performed glucose testing between 1–4-times a day. Because their survey questionnaire was developed to categorically assess the frequency (e.g., once a day, twice a day, more than 4-times a day, etc.), the average number of tests could not be obtained and compared with our study.
Belsey et al.Citation27 estimated the overall UK cost of SMBG at £171 million, of which the authors claim that £13M was unnecessary, given the current guidelines. Our study showed that the type 2 diabetes patients are testing glucose more than once a day (i.e., 1.57 times per day) Recently, Farmer et al.’sCitation22 meta-analysis (2008) of patients with type 2 diabetes treated with non-insulin concluded that evidence is not convincing for a clinically meaningful effect of clinical management by self-monitoring of blood glucose levels compared with management without self-monitoring. Additionally, the recent UK HTA assessment, where studies included adult patients with type 2 diabetes on any oral treatment or on a combination of regimens including lifestyle, oral agents, or once-daily basal insulin, concluded that SMBG is of limited clinical effectiveness in improving glycemic control in those on oral agents or diet alone, and therefore is unlikely to be cost-effective. Farmer et al.’sCitation22 survey study added a rather counter-intuitive observation that greater frequency of SMBG was associated with self-reports of one or more episodes of hypoglycemic events in the previous 6 months, suggesting that episodes of hypoglycemia were not accurately identified or treatment was not adjusted to avoid such morbidity.
SMBG is recognized as a core component of effective diabetes self-management. However, SMBG can pose a significant inconvenience and economic burden on the patient and the healthcare system. Our study highlights that glucose monitoring frequency varied significantly by insulin types, and the frequency is higher than what was recommended in the guidelines for patients with type 2, suggesting that there is potential to reduce the economic burden by reducing the frequency of SMBG in some patients.
Limitations
Although the UK EMR-EU data are rich, the results presented here must be viewed in light of some limitations associated with the LifeLink database. If an incorrect diagnosis was listed in the medical record, or the medical record was incomplete, then patients might have been misclassified, resulting in selection bias. The study also assumes that all information needed for case classification is present and not differential across the cohorts of interest.
As the evaluation of medical costs required the use of utilization data along with unit costs, it is likely that the results provided under-report both measures when the data were dependent on the picking up of referrals. Furthermore, although pharmacy costs were provided in the database, it is possible that the costs reported for therapies were low. Overall, the sample sizes in the cohorts were small, making statistical comparisons more difficult to interpret. Therefore, these data should be used primarily for descriptive purposes, and they should not be applied to or integrated into larger epidemiologic studies or economic models that require detailed data on healthcare utilization and medical costs.
Patients and physicians included in the database may not be fully representative of all patients and physicians in the UK, as data are collected only from physicians who have agreed to participate in the EMR-EU panel. Additional limitations of the dataset include (1) the inability to see data for patients who seek care outside the EMR practice setting, as their utilization will not be recorded in the database; (2) the inability to link data if a patient visits multiple physicians within the EMR-EU panel, as the patient will be assigned different identification numbers by each physician; and (3) the inability to track actual medication fills, as the prescription information only highlights those prescriptions written by the participating physician. Consequently, some prescriptions and treatments for a patient may not be captured in the data.
Conclusion
This study has provided valuable information regarding the frequency of SMBG among insulin-treated diabetes patients in the UK in aggregate and within four cohorts of insulin-treated patients. Further analyses may be warranted to investigate additional clinical and economic outcomes among this patient population.
Transparency
Declaration of funding
Funding for this study was provided by Novo Nordisk.
Declaration of financial/other relationships
IMS Consulting received consulting fees from Novo Nordisk for this study. Dr Lee has disclosed that he is an employee of IMS Consulting Group; and Dr Smith has disclosed that she was an employee of IMS Consulting Group during the time this study was conducted and submitted for publication. Drs Wolden and Chubb are employees of Novo Nordisk. JME Peer Reviewers on this manuscript have no relevant financial relationships to disclose.
Acknowledgments
The authors wish to acknowledge from IMS Consulting Group the assistance of Katharine Coyle in drafting and formatting some parts of the manuscript and Jennifer Korsnes for data analysis.
References
- World Health Organization. Diabetes Fact Sheet N 312. 2011. http://www.who.int/mediacentre/factsheets/fs312/en/. Accessed September 11, 2012
- World Health Organization. Media Centre Announcement World Diabetes Day 14 November 2012. http://www.who.int/mediacentre/events/annual/world_diabetes_day/en/. Accessed September 11, 2012
- National Health Service. Prescribing for Diabetes in England: 2005/6 to 2011/12. 2011. Leeds, UK: National Health Service. http://www.ic.nhs.uk/webfiles/publications/007_Primary_Care/Prescribing/diabetes20056to201112/Prescribing_for_Diabetes_in_England_20056_to_201112.pdf. Accessed October 1, 2012
- Diabetes UK. Diabetes in the UK 2010: Key statistics on diabetes. 2010. London, UK
- Clar C, Barnard K, Cummins E, et al. The economic burden of diabetes. Health Technol Assess 2010;14:1-140
- Beverly EA, Ritholz MD, Brooks KM, et al. A qualitative study of perceived responsibility and self-blame in type 2 diabetes: reflections of physicians and patients. J Gen Intern Med 2012;27:1180-7
- Zulman DM, Rosland AM, Choi H, et al. The influence of diabetes psychosocial attributes and self-management practices on change in diabetes status. Patient Educ Couns 2012;87:74-80
- Shigaki C, Kruse RL, Mehr D, et al. Motivation and diabetes self-management. Chronic Illn 2010;6:202-14
- Sevick MA, Trauth JM, Ling BS, et al. Patients with Complex Chronic Diseases: perspectives on supporting self-management. J Gen Intern Med 2007;22(3 Suppl):438-44
- IDF Clinical Guidelines Task Force. Global guideline for Type 2 diabetes. Brussels: International Diabetes Federation, 2005. http://www.idf.org/webdata/docs/IDF%20GGT2D.pdf. Accessed September 12, 2012
- Farmer AJ, Wade AN, French DP, et al. Blood glucose self-monitoring in type 2 diabetes: a randomized controlled trial. Health Technol Assesst 2009;13:1-72
- National Institute for Health and Clinical Excellence. Type 2 Diabetes Clinical Guidelines. 2009. London, UK. http://www.nice.org.uk/CG87. Accessed October 1, 2012
- American Diabetes Association. Standards of medical care in diabetes - 2009. Diabetes Care 2009;32(1 Suppl):S13-61
- Rodbard HW, Blonde L, Braithwaite SS, et al. American Association of Clinical Endocrinologists medical guidelines for clinical practice for the management of diabetes mellitus. Endocr Pract 2007;13(1 Suppl):3-68.
- Ceriello A, Colagiuri S. International Diabetes Federation guideline for management of postmeal glucose. Diabet Med 2008;25:1151-6
- The Diabetes Control and Complications Trial (DCCT) Research Group. The effect of intensive treatment of diabetes on the development and progression of long-term complications in insulin-dependent diabetes mellitus. N Engl J Med 1993;329:977-86
- Evans JM, Newton RW, Ruta DA, et al. Frequency of blood glucose monitoring in relation to glycaemic control: observational study with diabetes database. BMJ 1999;319:83-6
- Karter AJ, Ackerson LM, Darbinian JA, et al. Self-monitoring of blood glucose levels and glycemic control: the Northern California Kaiser Permanente Diabetes registry. Am J Med 2001;111:1-9
- Nathan DM, McKitrick C, Larkin M, et al. Glycemic control in diabetes mellitus: have changes in therapy made a difference? Am J Med 1996;100:157-63
- Goldstein DE, Little RR, Lorenz RA, et al. Tests of glycemia in diabetes. Diabetes Care 2004;27(1 Suppl):S91-3
- Karter AJ, Ferrara A, Darbinian JA, et al. Self-monitoring of blood glucose: language and financial barriers in a managed care population with diabetes. Diabetes Care 2000;23:477-83
- Farmer A, Balman E, Gadsby R, et al. Frequency of self-monitoring of blood glucose in patients with type 2 diabetes: association with hypolycaemic events. Curr Med Res Opin 2008;24:3097-104
- Barnard K, Young A, Waugh N. Self monitoring of blood glucose – a survey of diabetes UK members with type 2 diabetes who use SMBG. BMC Res Notes 2010;3:318
- Bonafede MM, Kalsekar A, Pawaskar M, et al. A retrospective database analysis of insulin use patterns in insulin-naïve patients with type 2 diabetes initiating basal insulin or mixtures. Patient Prefer Adherence 2010;4:147-56
- Yeaw J, Lee WC, Aagren A, et al. Cost of self-monitoring of blood glucose in the United States among patients on an insulin regimen for diabetes. J Manag Care Pharm 2012;18:21-32
- Yeaw J, Lee WC, Wolden ML, et al. Cost of self-monitoring of blood glucose in Canada among patients on an insulin regimen for diabetes. Diabetes Ther 2012;3(1):7
- Belsey JD, Pittard JB, Rao S, et al. Self blood glucose monitoring in type 2 diabetes. A financial impact analysis based on UK primary care. Int J Clin Pract 2009;63:439-48