
Abstract
Objective:
To compare healthcare resource utilization (HRU) and costs between patients with irritable bowel syndrome with constipation (IBS-C) or chronic constipation (CC) with and without evidence of treatment failure.
Methods:
Claims data from the Missouri Medicaid program were used to identify adults with IBS-C or CC treated for constipation. IBS-C patients were required to have ≥2 constipation therapy claims, and the index date was defined as the date of the first constipation therapy claim within 12 months after an IBS diagnosis. For CC, the index date was defined as the date of the first constipation treatment claim followed by a second claim for constipation treatment or diagnosis between 60 days and 12 months later. Indicators of treatment failure were: switch/addition of constipation therapy, IBS- or constipation-related inpatient/emergency admission, megacolon/fecal impaction, constipation-related surgery/procedure, or aggressive prescription treatments. Annual incremental HRU and costs (public payer perspective) were compared between patients with and without treatment failure. Incidence rate ratios (IRRs) and cost differences are reported.
Results:
In total, 2830 patients with IBS-C and 8745 with CC were selected. Approximately 50% of patients had ≥1 indicator of treatment failure. After adjusting for confounding factors, patients with treatment failure experienced higher HRU, particularly in inpatient days (IRR = 1.75 for IBS-C; IRR = 1.54 for CC) and higher total healthcare costs of $4353 in IBS-C patients and $2978 in CC patients. Medical service costs were the primary driver of the incremental costs associated with treatment failure, making up 71.3% and 67.0% of the total incremental healthcare costs of the IBS-C and CC samples, respectively.
Limitations:
Sample was limited to Medicaid patients in Missouri. Claims data were used to infer treatment failure.
Conclusion:
Treatment failure is frequent among IBS-C and CC patients, and sub-optimal treatment response with available IBS-C and CC therapies may lead to substantial HRU and healthcare costs.
Introduction
Irritable bowel syndrome with constipation (IBS-C) and chronic constipation (CC) are functional gastrointestinal disorders defined by persistent symptoms over an extended period of time with an absence of structural or biochemical causesCitation1. IBS is defined by symptoms of abdominal discomfort or pain associated with features of disordered defecationCitation2; IBS-C is one sub-type of IBS that is characterized by the presence of chronic or intermittent abdominal pain and discomfort in association with constipation-predominant bowel habits, including reduced stool frequency, hard and/or lumpy stool consistency, and/or difficult defecationCitation1,Citation2. CC is also defined by persistent symptoms of unsatisfactory defecation, including infrequent bowel movements, hard or lumpy stools, straining, and a sensation of incomplete rectal evacuation, although many patients also experience abdominal symptomsCitation1,Citation3.
Global prevalence of IBS-C is estimated at ∼5–6%, based on a recent meta-analysis of prevalence findings for IBS and a US population-based surveyCitation4,Citation5. The prevalence of CC in North America is estimated at 15% based upon the findings of a systematic review and a recent US population-based survey estimated the prevalence of CC at 11.2%Citation6,Citation7. Prevalence estimates for both IBS-C and CC vary depending on the diagnostic criteria used (e.g., Manning, Rome I, or Rome II criteria).
The abdominal and bowel symptoms of IBS-C and CC are chronic, impair patients’ quality-of-life, and may impose a substantial economic burden on patients and payersCitation2,Citation8–12. Since both diseases affect the digestive system and present with symptoms of visceral discomfort and unsatisfactory defecation, the therapeutic approaches for IBS-C and CC are similar. Management options usually involve lifestyle modifications (e.g., exercise and dietary adjustments) and treatment with over-the-counter (OTC) laxatives, bulking agents, and stool softenersCitation3,Citation8,Citation13. Prescription medications approved for the treatment of IBS-C and CC were limited and, at the time this study was conducted, the only prescription product approved by the Food and Drug Administration (FDA) for the treatment of IBS-C (for women only) and CC was lubiprostone. Since the conclusion of this analysis, linaclotide, a new prescription treatment for IBS-C and CC in adults, has been approved by the FDA. Other prescription products commonly used for the treatment of IBS-C and CC include lactulose and polyethylene glycolCitation8,Citation13.
Although past studies have examined the economic impact of IBS and constipation, information specific to IBS-C and CC is scarce. Most studies have only focused on overall IBSCitation14–17, not IBS sub-types, or constipation only rather than chronic constipationCitation18,Citation19. One study specific to IBS-C patients estimated incremental charges of IBS-C, but did not estimate costsCitation18. Two recent studies of IBS-C and CC have analyzed the economic burden specific to these conditions in terms of direct healthcare costs and found annual direct healthcare costs to be $3856 (in 2010 USD) higher for IBS-C patientsCitation11 and $3508 (in 2010 USD) higher for CC patientsCitation12 compared with age-, gender-, health plan type-, and region-matched controls in a managed care population.
Because there are few prescription treatment options available, OTC medications are the most commonly used treatment for IBS-C and CCCitation13. However, generally they are not reimbursed by insurance payers and are not recorded in administrative claims databases. Therefore, research on treatment patterns and outcomes associated with OTC use in clinical practice has been limited.
An understanding of treatment failure is important to optimize the care of patients with IBS-C or CC and identifying the associated economic consequences of treatment failure informs the need for new therapies and appropriate patient management. To date, no study has investigated the costs of treatment failure associated with either prescription or OTC treatments in the IBS-C or CC patient population. The objective of this study was to compare healthcare resource utilization (HRU) and costs between patients with IBS-C or CC initiating on prescription or OTC medications with and without evidence of treatment failure.
Methods
Data source
The data source for this analysis was the de-identified administrative claims database from Missouri Medicaid. The Missouri Medicaid database (01/01/1997–12/31/2010) contains complete medical and pharmacy dispensing claims for Medicaid-eligible enrollees during the covered years. Medical claims include both professional service and facility claims. Both OTC and prescription claims are available in the pharmacy data. Because the target population is often treated with OTC products, the availability of OTC treatment information in a claims database was an important factor in choosing the Medicaid database for this study.
During the study period, the Missouri Medicaid program covered a comprehensive list of OTC laxatives, bulking agents, and stool softeners for fee-for-service enrollees. Although OTC drugs generally do not require a physician’s prescription they are needed to obtain reimbursement by the Missouri Medicaid program.
Study design
This study used a retrospective cohort design methodology. Patients with IBS-C or CC were identified as two distinct samples and analyzed separately. Sub-group analyses were also conducted for both samples based on whether patients initiated treatment with OTC or prescription treatment on their index date. All sub-group analyses were conducted independently (i.e., no comparison between the OTC and prescription sub-groups). Patients who initiated treatment on a combination of an OTC and a prescription treatment were included in both sub-groups.
IBS-C patients
Patients were identified as having IBS-C if they had at least two independent claims with a diagnosis of constipation (ICD-9-CM code 564.0x) or constipation treatments and one claim with a diagnosis for IBS (ICD-9-CM code 564.1x) in their claims history. The first constipation therapy claim within 12 months after an IBS diagnosis was defined as the index date.
CC patients
Patients were classified as having CC if they had at least two independent claims with a diagnosis of constipation (ICD-9 CM code 564.0x) or constipation treatments that were more than 60 days apart but within 12 months of each other. For the CC sample, the index date was defined as the first constipation therapy followed by a second claim for constipation therapy or diagnosis at least 60 days but less than 12 months later. Patients in the CC sample were also required to have no diagnoses for IBS in the 6-month period preceding the index date.
Sample selection
In both samples, patients were selected if they: (1) were at least 18 years of age on their index date, (2) had continuous Medicaid eligibility for at least 6 months preceding and 12 months following the index date, (3) had no diagnoses for diarrhea (ICD-9 CM code 564.5x) or claims for anti-diarrheal treatments during the 6 months preceding the index date, and (4) had no inpatient stays lasting longer than 30 consecutive days during the 6 months preceding or 12 months following the index date. The baseline period was defined as the 6-month period preceding the index date; the study period was defined as the 12-month period following the index date. The full observation period between patients’ index date and end of continuous eligibility was also considered to estimate the treatment failure rates over a longer period of time.
For each sample (IBS-C and CC) and sub-group (OTC or prescription sub-group), patients were classified into two mutually exclusive cohorts based on whether or not they met the criteria for treatment failure during the study period. Because claims databases do not include clinical indicators of treatment response that can precisely identify treatment failure nor reasons for therapy change, surrogate indicators suggesting clinical treatment failure were developed in conjunction with clinical experts and were used as proxies. Patients with IBS-C or CC often switch if the therapy is not well tolerated or switch or augment therapies when their symptoms are not well controlledCitation8,Citation20. Some physicians may also prescribe more aggressive prescription therapies such as colchicine, misoprostol, or rifaximin if patients cannot find relief with traditional therapiesCitation21,Citation22. In some cases, patients may develop even more severe conditions such as a fecal impaction or megacolonCitation23,Citation24. Severe IBS-C or CC can require medical diagnostic tests such as defecography, transit time tests, and radiologic proceduresCitation23. In unusual circumstances, colectomy may be required if patients do not respond to pharmacologic therapy, usually as a last resortCitation24,Citation25. Intense abdominal pain associated with IBS-C or CC can lead to emergency department (ED) or inpatient admissions for treatment.
Therefore, in this study, patients with at least one of the following indicators of treatment failure while ‘on treatment’ were included in the ‘treatment failure’ cohort; otherwise, they were included in the ‘without treatment failure’ cohort. The requirement of ‘on treatment’ indicates the event occurred during the use of originally prescribed medication, and was defined as the period during which a patient had a supply of constipation/IBS-C treatment on hand plus an additional 30 days after. Indicators of treatment failure included (1) a switch from one IBS-C/constipation treatment to another or augmentation with an additional IBS-C/constipation treatment; (2) an IBS- or constipation-related (only constipation-related for patients in the CC sample) inpatient stay or ED visit; (3) a diagnosis of megacolon (ICD-9 CM code 564.7x) or fecal impaction (ICD-9 CM code 560.39 or 751.3x); (4) a constipation-related surgery/medical procedure (i.e., colon transit time test, colectomy, biofeedback, anorectal manometry, ileoresection, pulse irrigation, surgical laparoscopy, defogram, Sitzmark test, SmartPill test, or fecal disimpaction); or (5) the use of a more aggressive prescription (i.e., colchicine, misoprostol, or rifaximin).
Outcomes and statistical analyses
Frequency of treatment failure
The frequency of the different indicators of treatment failure was measured during both the 12-month study period and the entire continuous eligibility period following the index date.
Patient characteristics
Patient characteristics, including demographics, comorbid conditionsCitation26,Citation27, Charlson comorbidity index (CCI)Citation28, baseline HRU, and costs were summarized and compared. Comparisons between cohorts (patients with and without treatment failure) were made using chi-square tests for discrete variables and Wilcoxon rank-sum tests for continuous variables. For both samples, an exhaustive list of comorbidities was studied, but only those with at least 5% prevalence are reported.
Healthcare resource utilization
HRU end-points measured during the study period included inpatient admissions, inpatient days, ED visits, outpatient visits, long-term care (LTC) days (including LTC stays of less than 30 consecutive days, home health and nursing home services), mental health facility (MHF) days, and home care visits (HCV). Inpatient admissions were defined as the number of times the patient was admitted to an inpatient facility. Inpatient days were defined as the total number of days spent in inpatient facilities. ED visits were defined as the total number of times the patient was admitted to an ED facility, but ED visits resulting in an inpatient stay were counted as inpatient admissions only. Outpatient visits were defined as the total number of visits to an outpatient facility, including office visits. LTC days were defined as the total number of days spent in LTC facilities. MHF days were defined as the total number of days spent in MHFs (inpatient and outpatient). HCVs were defined as the total number of HCVs the patient received.
Healthcare costs
Costs were inflated to 2010 US dollars using the medical care component of the consumer price index; 2010 was selected as it corresponds to the last year covered by the data. The primary end-points were typical medical costs which included inpatient, ED, and outpatient costs. The secondary end-points were non-typical medical costs which included those related to LTC, MHF days, HCV costs, and other medical service costs (e.g., laboratory, radiology, or other ancillary medical services). Total medical service costs were calculated as the sum of typical and non-typical medical costs. Pharmacy costs were also evaluated. Total healthcare costs were calculated as the sum of paid amounts for pharmacy and total medical service costs.
Statistical analyses
Multivariate regression models adjusted for potential confounding factors, including age, gender, ethnicity, CCI, comorbidities with at least 5% prevalence in both cohorts and a statistically significant difference between cohorts, and baseline HRU and costs. HRU was compared between cohorts using incident rate ratios (IRR) adjusting for potential confounding factors with a generalized linear regression model with a log link and a negative binomial distribution. Healthcare costs were compared between cohorts using generalized linear models. P-values and associated 95% confidence intervals (CIs) were calculated using a bootstrapping technique with 500 iterations. All statistical analyses were conducted using SAS 9.2 (SAS Institute, Inc., Cary, NC). A two-sided alpha error of 0.05 was used to declare statistical significance.
Results
Patient characteristics and frequency of treatment failure
A total of 2830 patients with IBS-C and 8745 patients with CC were selected for the analysis (). In the CC sample, 6315 patients initiated on an OTC treatment, 2139 patients initiated on a prescription, and 291 patients initiated on both. In the IBS-C sample, 1627 patients initiated on an OTC, 1107 patients initiated on a prescription, and 96 patients initiated on both.
Figure 1. Sample Selection Flowchart.
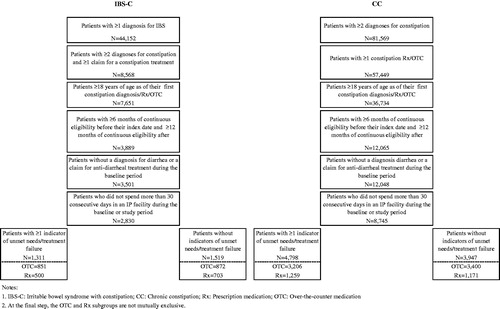
During the 12-month study period we observed at least one indicator of treatment failure in 46.3% of patients with IBS-C. When the patients’ entire continuous eligibility periods were considered (median observation period length was 4.9 years), we observed at least one indicator of treatment failure in 75.9% of patients (). In the sub-groups of IBS-C patients initiated on OTC and prescription treatments, the proportions of patients with at least one indicator of treatment failure were 49.4% and 41.6% during the 12-month study period, and were 80.7% and 68.3% when the patients’ entire continuous eligibility periods were considered, respectively.
Table 1. Frequency of treatment failure.
Similarly, during the 12-month study period we observed at least one indicator of treatment failure in 54.9% of patients with CC. When the patients’ entire continuous eligibility periods were considered (median observation period length was 4.9 years), we observed at least one indicator of treatment failure in 78.7% of patients. In the sub-group of CC patients initiated on OTC and prescription treatments, the proportions of patients with at least one indicator of treatment failure were 48.5% and 51.8% during the 12-month study period, and were 81.3% and 74.4% when the patients’ entire continuous eligibility periods were considered, respectively.
In both samples, treatment switching was the most frequent indicator of treatment failure. In the IBS-C sample, 34.3% of patients switched therapies during the 12-month period following the index date and 68.7% of patients switched therapies during their entire eligibility period following the index date (). In the CC sample, 48.5% of patients switched therapies during the 12-month period following the index date and 74.6% of patients switched treatment at some point during their entire eligibility period following the index date. Findings were similar in the OTC/prescription treatment sub-groups in each sample, with switching therapies the most common indicator of treatment failure.
Patient baseline characteristics
Mean ages were 51 years in the IBS-C sample and 57 years in the CC sample. Eighty-seven per cent of the IBS-C sample was female, and 70% of the CC sample was female. In the IBS-C sample, there were significantly fewer Caucasian patients and significantly more African American patients in the treatment failure cohort (). However, no significant differences in race distribution were observed in the CC sample. The prevalence of comorbidities was similar between cohorts at baseline. There was a high prevalence of chronic conditions in both samples; for example, in both the IBS-C and CC samples, we observed a prevalence of chronic pulmonary disease and hypertension of over 45%. Furthermore, in the IBS-C sample we observed a prevalence of over 40% in depression and psychoses. In the IBS-C sample, the only comorbidity with a significant difference between cohorts was drug abuse. In the CC sample, the prevalence rates of diabetes with complications, drug abuse, renal failure, and alcohol abuse were all significantly different between cohorts.
Table 2. Patient baseline characteristics.
During the 6-month baseline period, in both samples, patients in the treatment failure cohort had significantly higher healthcare costs. In the IBS-C sample, patients with treatment failure also had significantly more ED admissions (1.7 vs 1.4; p = 0.015) and outpatient visits (13.5 vs 12.2; p < 0.001) than patients without treatment failure. Similarly, in the CC sample, treatment failure was associated with significantly higher ED admissions (1.0 vs 0.8; p < 0.001), outpatient visits (9.9 vs 9.4; p < 0.001), and inpatient admissions (0.5 vs 0.4; p < 0.001).
Healthcare resource utilization and costs
During the 12-month study period, patients with treatment failure had significantly higher rates of all HRU compared to patients without treatment failure (). In both samples, patients with treatment failure also had significantly higher total costs compared to patients without treatment failure. In the IBS-C sample, among patients with treatment failure, mean total healthcare costs were $18,886 vs $13,897 among patients without treatment failure. The total incremental cost was $4353 after adjusting for potential confounding factors (). In the CC sample, mean total healthcare costs were $18,617 and $14,929 among patients with and without treatment failure, respectively. The total incremental cost was $2978 after adjusting for potential confounding factors.
Table 3. Comparison of healthcare resource utilization between patients with and without treatment failure.
Table 4. Comparison of healthcare costs between patients with and without treatment failure.
For both samples, medical service costs made up ∼60% of the total healthcare costs. Average annual medical service costs for IBS-C patients were $11,021 and $7497 for the treatment failure and without treatment failure cohorts, respectively. After adjusting for potential confounding factors, patients in the treatment failure cohort had $3106 higher medical service costs than patients without treatment failure (p < 0.001). Medical service costs were the primary cost driver of the incremental costs associated with treatment failure, making up 71.3% of the total incremental healthcare costs. In the CC sample, annual medical service costs were $11,503 and $9000 for the treatment failure and without treatment failure cohorts, respectively. After adjusting for potential confounding factors, the incremental medical service cost was $1996 (p < 0.001). Similar to the IBS-C sample, the incremental medical service costs made up 67.0% of the total incremental healthcare costs. The individual cost components observed to be highest between cohorts were pharmacy (29% for IBS-C; 33% for CC) and inpatient (25% for IBS-C; 28% for CC) costs. Constipation/IBS-C treatment costs contributed very little to the total incremental cost between cohorts (2% for IBS-C; 1% for CC) (). Consistent results were found when OTC and prescription medication sub-groups were analyzed, for both the IBS-C and CC samples.
Discussion
To the best of our knowledge, this study is the first published report to evaluate the rate and estimate the costs of treatment failure in IBS-C and CC patients who received physician-prescribed medication, including OTC medication using data from an administrative claims database. The study compared various measures of HRU and costs between cohorts of patients with and without treatment failure. A high rate of treatment failure was observed and significantly higher incidence of medical service resource use and higher total healthcare costs were observed in IBS-C and CC patients who experience treatment failure compared to those who do not experience treatment failure. This suggests a substantial unmet need for effective therapies for both IBS-C and CC patients and the need for appropriate initial treatment, which could limit HRU and costs associated with sub-optimal treatment response. These findings also suggest that there may be higher overall healthcare costs incurred when implementing formulary step edits (i.e., requiring patients to fail therapy before other treatments are available).
The findings of this study show a notable unmet need for effective therapies, given the high rate of treatment failure over a 12-month period and over the entire follow-up period. The study estimated that 46.3% of patients with IBS-C and 54.9% of patients with CC incurred at least one of the observable indicators of treatment failure while on their original prescribed medications (either prescription or OTC) during the 12 month study period. This rate, however, could be an under-estimation. In this study, in addition to medication switching and augmentation, patients may have experienced four additional types of indicators of treatment failure. To ensure the treatment failure events were attributable to the original prescribed constipation medication, we required the event to occur during the course of treatment, which is a very conservative means of defining treatment failure. Given such a conservative method, indicators of treatment failure occurring after treatment discontinuation were not included.
The reasons for the higher costs associated with treatment failure in this study are unknown, and IBS-C- or CC-specific HRU may account for a portion of the incremental costs. Treatment failure could exacerbate IBS-C- and CC-related comorbidities and complications, which could account for a substantial portion of the costs. Additionally, patients with unresolved gastrointestinal symptoms may exhibit increased healthcare seeking and may receive increased medical attention for general comorbid conditions as well as IBS-C or CC. Overall, patients experiencing treatment failure (i.e., those not being treated effectively) used more medical resources and incurred higher costs because their condition was not adequately managed. There is a need to understand whether early treatment with effective therapy options will result in reduced HRU and costs. The high economic burden associated with IBS-C and CC may be alleviated or reduced if IBS-C and CC patients’ symptoms can be better controlled with more effective therapies.
Limitations
Study limitations include the fact that the HRU and costs data reported may not be causally related to unmet needs and treatment failure among patients with IBS-C or CC. The study can, therefore, establish only a temporal association between these factors. In addition, the population studied was limited to patients living in Missouri and enrolled in Medicaid. These patients are likely to be of low socioeconomic status and have a greater comorbidity burden than privately-insured patients. Thus, it may not be possible to generalize our conclusions to the US population as a whole. Also, although the contributions of comorbid disease states are important with regard to HRU and costs, particularly given the high prevalence of these in the study population, their impact was not disaggregated in this analysis. For example, HRU and costs attributable to comorbid conditions, as stratified by patients’ IBS-C- or CC-related treatment failure status, were not evaluated or reported in this study. Further, the possibility that treatment failure in patients with IBS-C or CC might influence clinical activity of seemingly unrelated comorbid conditions or healthcare provider decisions to use diagnostic and treatment services in the management of comorbid conditions was not evaluated in the study.
Another limitation of this study is that treatment failure cannot be precisely identified in claims data; claims data were used to infer treatment failure based on the presence of different potential indicators of treatment failure. For example, treatment switching was used as an indicator of treatment failure; however, it is possible that in some cases, the switches were not due to medical reasons. In addition, because the definition of treatment failure used in the investigation includes the requirement for additional tests, procedures, treatments, and medical services, patients with treatment failure will likely have higher HRU and costs. Furthermore, because the diagnostic criteria for both of these disorders are symptom-based and the criteria used to differentiate IBS-C and CC (e.g., Rome criteria) are not routinely used in clinical practiceCitation1, these two functional gastrointestinal disorders may not be robustly separated in real world health data.
Finally, the study is subject to inherent limitations of retrospective studies derived from administrative claims databases. Claims data may be subject to inaccuracies in coding diagnoses and procedures and do not include complete information on disease severity. Nevertheless, these limitations should affect both cohorts equally and, thus, not significantly impact the interpretation of our findings.
Conclusion
Treatment failure is frequent among IBS-C and CC patients, and is associated with a significant burden in terms of both HRU and healthcare costs.
Transparency
Declaration of funding
This study was sponsored by Forest Research Institute, and Ironwood Pharmaceuticals, Inc.
Declaration of financial/other relationships
A. Guerin, M. S. Kaminsky, and E. Q. Wu are employees of Analysis Group Inc. which has received consultancy fees from Forest Research Institute. R. T. Carson is an employee of Forest Laboratories, Inc and owns stock/stock options. B. Lewis was an employee of Ironwood Pharmaceuticals Inc. at the time the study was conducted. D. Yin was an employee of Forest Research Institute at the time the study was conducted. CMRO Peer Reviewers on this manuscript have no relevant financial or other relationships to disclose.
Acknowledgments
The authors thank Douglas C. A. Taylor for his review and contributions to the writing of the manuscript and Steven J. Shiff, MD for providing clinical consultation on patient identification criteria.
References
- Chey WD. New insights in IBS-C and chronic constipation: an interview with William D. Chey, MD, AGAF, FACG, FACP. Medscape Gastroenterol 2006;8(1). Available at: http://www.medscape.org/viewarticle/532440 [Last accessed 5 May 2014]
- Longstreth GF, Thompson WG, Chey WD, et al. Functional bowel disorders. Gastroenterology 2006;130:1480-91
- American College of Gastroenterology Chronic Constipation Task Force. An evidence-based approach to the management of chronic constipation in North America. Am J Gastroenterol 2005;100(Suppl):S1-4
- Lovell RM, Ford AC. Global prevalence of and risk factors for irritable bowel syndrome: a meta-analysis. Clin Gastroenterol Hepatol Off Clin Pract J Am Gastroenterol Assoc 2012;10:712-21.e4
- Stelwagon M, Chey W, Olden K, et al. symptom frequency, health care seeking behavior and satisfaction with therapy among IBS-C patients meeting Rome II Criteria: results of a population-based survey. Las Vegas, NV: American Academy of Nurse Practitioners (AANP), 2011
- Higgins PDR, Johanson JF. Epidemiology of constipation in North America: a systematic review. Am J Gastroenterol 2004;99:750-9
- Schoenfeld P. Symptom frequency, health care seeking behavior, and satisfaction with therapy among chronic constipation patients: results of a population-based survey. San Antonio, Texas, USA, Poster Presentation at ACG; 2010
- Eoff JC. optimal treatment of chronic constipation in managed care: review and roundtable discussion. J Manag Care Pharm 2008;14(9 Supplement A):1-15
- Sun SX, Dibonaventura M, Purayidathil FW, et al. Impact of chronic constipation on health-related quality of life, work productivity, and healthcare resource use: an analysis of The National Health And Wellness Survey. Digest Dis Sci 2011;56:2688-95
- DiBonaventura M, Sun SX, Bolge SC, et al. Health-related quality of life, work productivity and health care resource use associated with constipation predominant irritable bowel syndrome. Curr Med Res Opin 2011;27:2213-22
- Cai Q, Buono JL, Spalding WM, et al. Economic burden of Irritable Bowel Syndrome with constipation: a retrospective cohort study in a commercially insured population. Presented at ACG Annual Scientific Meeting. Las Vegas, NV; October 19, 2012
- Cai Q, Buono JL, Spalding WM, et al. Healthcare costs among patients with chronic constipation: a retrospective claims analysis in a commercially insured population. J Med Econ 2014;17:148-58
- Spiller R, Aziz Q, Creed F, et al. Guidelines on the Irritable Bowel Syndrome: mechanisms and practical management. Gut 2007;56:1770-98
- Levy RL, Von Korff M, Whitehead WE, et al. Costs of care for Irritable Bowel Syndrome patients in a health maintenance organization. Am J Gastroenterol 2001;96:3122-9
- Ricci J. Costs of care for Irritable Bowel Syndrome in managed care. JCOM 2000;7:23-8
- Leong SA, Barghout V, Birnbaum HG, et al. The economic consequences Of Irritable Bowel Syndrome: a US employer perspective. Arch Intern Med 2003;163:929-35
- Patel R, Petitta A, Fogel R, et al. The economic impact of irritable bowel syndrome in a managed care setting. J Clin Gastroenterol 2002;35:14-20
- Mitra D, Davis KL, Baran RW. All-cause health care charges among managed care patients with constipation and comorbid Irritable Bowel Syndrome. Postgrad Med 2011;123:122-32
- Nyrop KA, Palsson OS, Levy RL, et al. Costs of health care for Irritable Bowel Syndrome, chronic constipation, functional diarrhoea and functional abdominal pain. Aliment Pharmacol Therapeut 2007;26:237-48
- Frissora CL, Koch KL. Symptom overlap and comorbidity of Irritable Bowel Syndrome with other conditions. Curr Gastroenterol Rep 2005;7:264-71
- Pimentel M, Park S, Mirocha J, et al. The effect of a nonabsorbed oral antibiotic (Rifaximin) on the symptoms of The Irritable Bowel Syndrome: a randomized trial. Ann Intern Med 2006;145:557-63
- Ramkumar D, Rao SSC. Efficacy and safety of traditional medical therapies for chronic constipation: systematic review. Am Gastroenterol 2005;100:936-71
- Lembo A, Camilleri M. Chronic constipation. N Engl J Med 2003;349:1360-8
- Khawaja MR, Akhavan N, Chiorean M. Chronic constipation with megacolon. J Gen Intern Med 2011;26:938
- Pemberton JH, Rath DM, Ilstrup DM. evaluation and surgical treatment of severe chronic constipation. Ann Surg 1991;214:403-11; discussion 411-3
- Elixhauser A, Steiner C, Harris DR, et al. Comorbidity measures for use with administrative data. Med Care 1998;36:8-27
- American Psychiatric Association. Diagnostic and statistical manual of mental disorders. 4th ed. Washington, DC: American Psychiatric Association, 1994
- Quan H, Sundararajan V, Halfon P, et al. Coding algorithms for defining comorbidities in ICD-9-CM and ICD-10 administrative data. Med Care 2005;43:1130-9