
Abstract
Aim:
The aim of this analysis was to investigate total healthcare costs, HbA1c, and weight changes over a 36-month period in patients with type 2 diabetes initiated on NPH or long-acting insulin analogs.
Methods:
Electronic patient data from 479 general practices in the UK (THIN database) were examined for new users of glargine (n = 794), detemir (n = 252), or NPH insulin (n = 430). Annualized healthcare costs and clinical outcomes in years 1, 2, and 3 following insulin initiation were quantified and compared with baseline, using ANOVA and linear regression models.
Results:
A significant difference (p < 0.05) in total healthcare costs increases at year 1 vs baseline was observed between glargine and detemir, detemir and NPH, but not between glargine and NPH (increase: +£486, +£635, and +£420 for glargine, detemir, and NPH users, respectively). However, increases by year 3 were not significantly different between the insulins. A propensity score analysis comparing analog and NPH insulin showed that, following insulin initiation, increases in costs were higher with insulin analogs at year one (+£220), but this difference decreased over time in each year following insulin initiation (+£168 and +£146, respectively, for years 2 and 3). HbA1c reductions were not significantly different between the groups at all time points. Differences in weight gain between glargine and NPH were statistically significant at year 1 (0.87 kg vs 1.11 kg) and year 3 (1.15 kg vs 1.57 kg), but other estimates of between-group differences in weight gain were non-significant.
Conclusions:
Following insulin initiation, the difference in healthcare costs of long-acting analogs compared to NPH insulin was transient. By year 3, the cost differences were not significantly different between the two cohorts, driven by an observed reduction in the cost of self-monitoring of blood glucose (SMBG) in the analog group and an increase in the cost of bolus insulin in the NPH group.
Introduction
Type 2 diabetes mellitus (T2DM) is characterized by a progressive loss of beta-cell function, insulin resistance, and/or insulin deficiencyCitation1, which in many patients may necessitate the use of insulin in order to achieve adequate glycemic control. In patients with poorly controlled diabetes, early initiation of insulin therapy is associated with a significant reduction in the risk of diabetes-related complications and slower disease progression, and may facilitate long-term euglycemiaCitation2,Citation3. In view of the rising prevalence of T2DMCitation4 and the increased emphasis on early insulin initiation among patients with T2DM, there has been significant interest in evaluating the safety, efficacy, and cost-effectiveness of insulin therapy in T2DMCitation5,Citation6.
A number of insulin products are currently available that address variability in patient needs and response to treatment. The long-acting insulin analogs, glargine (Lantus) and detemir (Levemir), have a smooth, comparatively peakless, action profile; clinical trials have demonstrated that these analogs also have a similar effect on glycated hemoglobin (HbA1c) levels to treatment with Neutral Protamine Hagedorn (NPH) insulin, but with a significantly reduced incidence of nocturnal hypoglycemiaCitation7,Citation8. However, these insulin analogs are more expensive than NPH insulin and their use has come under scrutiny. The Quality, Innovation, Productivity, and Prevention (QIPP) program aims to make efficiency savings in the National Health Service. One of its key therapeutic topics includes the QIPP prescribing comparatorCitation9, which aims to report and target for a reduction in the ratio of insulin analog in relation to NPH usage for the treatment of patients with T2DMCitation10, but does not provide any clear indication of what ratio would be appropriate. This prescribing measure is based on the notion that NPH insulin is cheaper than insulin analogs and, hence, represents a target for cost saving in the NHS. Whilst this is true for the direct acquisition cost of insulin, the broader costs of treatment, utilization of healthcare resources, and clinical safety need to also be consideredCitation11.
To this end, data on real world cost and clinical outcomes for long-acting human insulin vs insulin analogs in the UK are necessitated but are not presently available. A previous study using a US health insurance administrative database has reported reductions in the risks of hypoglycemia and total healthcare costs in favor of insulin glargine compared with NPH insulinCitation12. However, this study did not evaluate changes in cost and glycemic control beyond 2 years of follow-up. In another study conducted from the German statutory health insurance perspective, insulin analog treatment was associated with significantly less use of bolus insulin and blood glucose testing strips, compared with NPHCitation13. Therefore, there is an urgent need to examine the comparative effects of insulin therapy on healthcare utilization, and the related costs and effectiveness, for more extended periods, based on the UK perspective.
The primary objective of this study was to estimate the real world total healthcare costs of treatment with insulin glargine, insulin detemir, and NPH insulin (and the relative contribution of the individual cost components) over the 36-month (3-year) period following insulin initiation in a population of T2DM, compared to the 12-month period prior to insulin initiation. Secondary objectives examined changes in HbA1c levels, body mass index (BMI), and hypoglycemia in patients initiating insulin treatment, both between the insulin groups and within group differences following initiation of therapy.
Materials and methods
Study design
This was a retrospective analysis of routinely collected primary care data from the UK. The principle analysis was a comparative assessment of costs and outcomes in the 12 months prior to and 36 months post-insulin initiation.
Data and case selection
The data for this study came from the Health Improvement Network (THIN), a database of electronic medical records entered by general practitioners in the UKCitation14. THIN currently contains the electronic medical records of 9.1 million patients (3.4 million active patients) collected from ∼500 General Practices across the UK. At the time of analysis, data were available for the period 1988–2010. Patients in THIN are similar in age, gender, and geographical characteristics to the general UK population. THIN data contains information on past and current medical diagnoses (using the read code system), prescribed medications (based on the British National Formulary [BNF]), and data recorded from laboratory tests and other clinical investigations.
This study included patients with T2DM who were insulin-naïve, and were initiated onto treatment with either glargine, detemir, or NPH. Patients were selected from the THIN database based on the presence of read codes specific to T2DM, or the presence of data indicating prescriptions for diabetes-specific medications. Of the patients identified as having T2DM, the study included only individuals not requiring insulin for at least 12 months from diagnosis; people requiring insulin within 6–12 months of diagnosis had to be aged 40 years of age or over to be included as a patient. In order to be included in the analysis, patients were also required to have met the following criteria: first prescribed insulin was NPH, glargine, or detemir; registered with their practice for at least 1 year; aged less than 80 years; at least 6 months of history of using NPH, glargine, or detemir; HbA1c levels >7% and <12% at baseline; no history of use of dipeptidyl peptidase-4 (DPP-4) inhibitors, glucagon-like peptide-1 (GLP-1) agonists, or pre-mixed insulin in the study period; and no diabetes-related complications prior to the time of insulin initiation (defined as coronary artery disease, heart failure, stroke disease, neuropathy, foot ulcer, retinopathy, macular edema, cataract, or nephropathy).
Data collected on patient characteristics (covariates) included age, sex, HbA1c, comorbidities (asthma, chronic obstructive pulmonary disease [COPD], or cardiovascular disease [CVD]), diabetes-related complications, bolus insulin use, fasting plasma glucose levels, BMI, and socioeconomic status (Townsend score: 1 = lowest and 5 = highest level of deprivation for geographical areas).
Total healthcare cost incorporated the costs of insulin (principle basal insulin and short-acting bolus insulins), oral anti-diabetic medications, anti-hypoglycemic agents (e.g. glucose and glucagon), devices used in the self-monitoring of blood glucose (e.g. reagents, test strips), sharps (e.g. lancets, injections, syringes), laboratory tests (e.g. blood glucose and urine analysis), general practitioner visits (surgery and home visits), nurse visits (diabetes specialist nurse and practice nurse), lipid lowering drugs, anti-hypertensive drugs, and hospitalizations (e.g. admissions attributed to diabetes). Unit costs for the various measures of resource utilization were extracted from published sources. The prices of individual drugs were taken from BNF 63 (published March 2012)Citation15. Where drugs are being withdrawn from NHS use, prescriptions dates were extracted from the THIN database and mapped to the corresponding BNF schedule. Unit costs associated with hospital visits and healthcare worker assessments were sourced from Unit Costs of Health and Social Care 2011Citation16, and those associated with laboratory tests and procedures were obtained from NHS reference costing schedulesCitation17. Costs were inflated to current prices at the time of the analysis using HM Treasury GDP Deflator (£, 2011)Citation18.
Statistical methods
The primary analysis compared two groups: analog and NPH insulins. Propensity score analysis was used to adjust for differences between the groups at baseline in estimating annualized total costs. For the propensity score estimation, logistic regression analysis was used to estimate the probability of being treated with an insulin analog (treatment) or NPH insulin (control), based on statistically significant pre-treatment covariates, selected from age, sex, HbA1c, fasting plasma glucose levels, BMI, comorbidities, Townsend scores, and the total cost of treatment in the year prior to insulin initiation. Individual propensity scores were used in two ways: (i) in univariate analysis and (ii) in multivariate analysis. First, the total cost of treatment in each year surrounding insulin initiation was statistically summarized after adjusting for differences between the groups. Second, the propensity score, reflecting differences between groups at baseline, was included in a multivariate analysis alongside time-dependent covariates.
Secondary analyses compared the costs and clinical outcomes associated with initiation of the three treatment groups: glargine, detemir, and NPH. Changes in total cost for each insulin group were estimated in multivariate regression analyses, adjusting for differences in covariates (age, sex, HbA1c, fasting plasma glucose levels, BMI, Townsend scores, comorbidities, and diabetic-related complications) between the groups. Further, in sub-group analyses the cost per 1% reduction in HbA1c was assessed for the first and third years compared to baseline. Additionally, the total cost associated with each of the three insulin groups were determined, stratified by those that did not receive a prescription for a bolus insulin in the 3 years following insulin initiation (basal only group), and those that received at least one prescription for a bolus insulin any time in the 3 years post-initiation (basal/bolus group).
An additional analysis assessed the contribution of the various healthcare resource categories to each individual estimate for the main outcome variable (total cost).
Model specification was based on a stepwise general to specific selection methodology where non-significant variables (and interaction terms) were excluded at the 0.05 level of testing. Imputed data formed the basis of the primary and secondary analyses. Multivariate model selection was based on the statistical significance of individual covariates and the F-test for overall model significance. Missing values for the outcome variable (total cost) and covariates (including HbA1c and BMI) were imputed in a regression model that produced five complete (multiple imputation) datasets; estimates were obtained for each imputed data set and combined using Rubin’s methods for the combining of estimates from multiple imputation data-sets to generate a single estimate. The additional analysis examining the relative contribution of each resource utilization category to total cost was based on non-imputed data. All analyses were undertaken in Stata version 11 including the procedures psmatch2 for the propensity score analyses and the mi commands for multiple imputation of missing dataCitation19. In the descriptive analyses, the statistical significance of between-group comparisons was based on one-way analysis of variance; pairwise comparisons were based on Bonferroni, Scheffe, and Sidak tests or the chi2 statistic. The statistical significance of within- and between-group comparisons of changes over time for cost, HbA1c, and BMI were based on linear regression models.
Results
Patient characteristics
Of the T2DM patients identified, a total of 1476 met the criteria for analysis, with 794 initiated onto glargine, 252 initiated onto detemir, and 430 initiated onto NPH insulin. Patients (mean ± standard deviation) were 56.81 ± 11.97 years of age, with a starting HbA1c of 9.94 ± 1.70, a BMI of 29.02 ± 5.05, and 54% were male. There was a statistically significant difference in starting levels of HbA1c between the groups (). The proportion of patients that received only basal insulin therapy over the 3 years following treatment initiation was 52%; the remaining 48% of patients (35%, 43%, 73%, glargine, detemir, NPH, respectively) received at least one prescription for bolus insulin in the 3-year period post-initiation ().
Table 1. Baseline characteristics.a
Data were extracted from THIN in quarterly periods; the degree of missing data ranged from < 1% (Townsend score) to 32% (HbA1c) and 49% (BMI and weight); see . Data describing episodes of hypoglycemia were not well captured, likely due to the poor recording of these events in the THIN database. On this basis, hypoglycemia was excluded as an outcome.
Primary analysis: comparison of analog and NPH insulin
Annualized total cost—propensity score matching
Total healthcare costs for each period surrounding insulin initiation were estimated using a propensity score matching analysis, which obtained 430 matched pairs (860 cases), as well as 616 treated subjects for which controls could not be found. The groups were generally well balanced with respect to age, sex, bolus insulin use, and HbA1c levels ().
Table 2. Baseline characteristics after propensity score measure (mean).
There was a statistically significant difference in total healthcare costs between analogs and NPH insulin in the period surrounding insulin initiation. In the year prior to initiation (year 0), patients that went on to receive an insulin analog were more costly than those going on to receive NPH insulin (+£105; p < 0.05). Total healthcare costs were higher with insulin analog-treated patients than those receiving NPH in each year following initiation; however, the cost differential of insulin analogs vs NPH decreased in each post-initiation year (+£220, +£168, and +£146 during years 1, 2, and 3, respectively) ().
Table 3. Multivariate analyses of total cost, £ (mean): propensity score matched.
A second propensity score analysis included the estimated propensity scores in a multivariate analysis alongside other covariates, in order to control for differences between the groups over time. Similar to the first analysis, total healthcare costs increased for analogs and NPH insulin post-initiation compared to pre-initiation; all changes vs baseline were statistically significant (p < 0.05). The increase in total healthcare cost (vs baseline) for the analog group decreased over time and tended towards the same level as the NPH group by year 3 (+£349 and +£315 for analog and NPH groups at year 3, respectively).
Secondary analysis: comparison of insulins glargine, detemir, and NPH
Annualized total cost—descriptive statistics and multivariate regression analysis
During the first year following initiation of insulin treatment, there was a statistically significant difference in total healthcare cost change from baseline for glargine vs detemir (+£486 vs +£635, respectively; p < 0.05), and detemir v NPH (+£635 vs +£420; p < 0.05), but not for the comparison between glargine and NPH. However, this difference between the insulins in total healthcare cost change from baseline diminished over time ().
Table 4. Analyses of total cost, £ (mean, SE).
Following multivariate regression analysis, changes in total healthcare costs vs baseline were statistically significant for each group after adjusting for differences in covariates between the groups, including age, sex, bolus use, and BMI. Total annual healthcare costs increased for all insulin groups vs baseline post-initiation. However, these cost increases diminished in the analog group over the 3-year period, and, by year 3, the increase in total costs was comparable across the insulin treatment groups (+£312, +£290, +£309 for the glargine, detemir, and NPH groups, respectively).
HbA1c and BMI: descriptive statistics
All insulin treatment groups demonstrated a statistically significant reduction in HbA1c levels (between 1.27–1.47%) during the first year following insulin initiation; reductions remained statistically significant at years 2 and 3. No significant differences in HbA1c changes were identified between the insulin groups (p > 0.05) for all years (; ).
Figure 1. Selection of patient cohort.
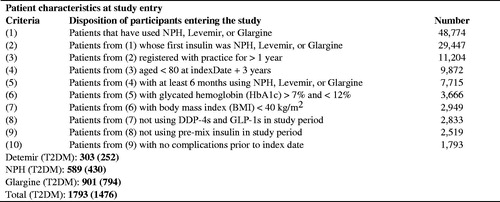
Figure 2. Unadjusted change in HbA1c level (%) from baseline (before) and after initiation of NPH insulin, glargine or detemir.
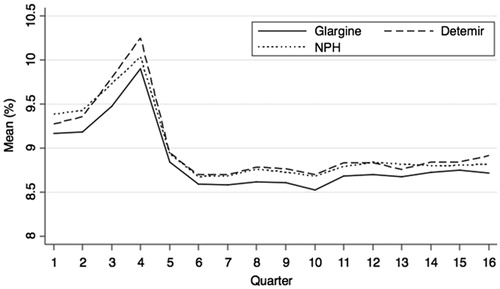
Table 5. Health outcomes.a,b,d,e
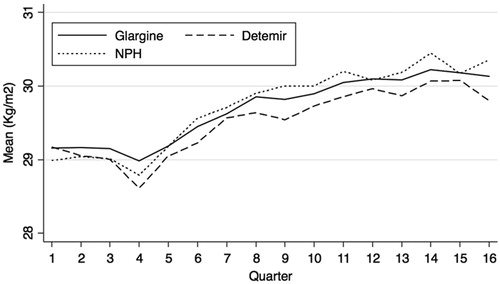
All insulins were associated with weight gain in terms of BMI following insulin initiation (p < 0.05). Glargine had the lowest weight gain at each time point post-initiation, and this was statistically significant v NPH at year 1 (0.87 kg/m2 vs 1.11 kg/m2) and year 3 (1.15 kg/m2 vs 1.57 kg/m2). Other differences in weight gain between groups were non-significant (, ).
Figure 3. Unadjusted change in body mass index (kg/m2) from baseline (before) and after initiation of NPH insulin, glargine or detemir.
Additional analysis
Cost breakdown by insulin group
The size of the individual cost components (healthcare resource categories) as a proportion of total healthcare costs was estimated for each insulin group using non-imputed (raw) data.
The cost of insulin and self-monitoring of blood glucose (SMBG) products were the largest contributors to total healthcare cost for each group. There was no significant difference between the groups in terms of SMBG cost in the year prior to initiation; however, there were significant differences between glargine and detemir in year 1 (£275 vs £359; p < 0.001) and year 2 (£203 vs £250; p < 0.05), between detemir and NPH at year 1 (£359 vs £271; p < 0.001) and between glargine and NPH in year 3 (£193 vs £233; p < 0.05). There was also a significant difference in basal and bolus insulin cost changes vs baseline between glargine and NPH at year 2 (£420 vs £352; p < 0.05), and detemir vs NPH at year 1 (£455 vs £358; p < 0.05).
Compared to the year prior to insulin initiation, there was a reduction in the cost of oral anti-hypoglycemic agents in each year following insulin initiation for all insulin groups (between −£127 and −£76). Further, the cost of visits to a general practitioner decreased in each of the years following insulin initiation for all groups. All other cost components had a relatively small impact on total cost estimates ().
Table 6. Univariate analyses of total cost by categorya, £ (mean per patient).
Time period sensitivity analysis
Data were taken from the THIN database over the period 1988–2010. The first insulin analog (glargine) was introduced in 2002. Therefore, a sensitivity analysis was performed only including data from 2002 onwards, excluding 45% of the NPH patients (13% of the entire sample). The results showed that the costs associated with NPH treatment in these patients were not significantly different from the base case analysis.
Discussion
This study aimed to estimate the total healthcare costs and health outcomes of managing insulin naïve patients with T2DM, newly initiated onto glargine, detemir, or NPH insulin in the UK. Accordingly, 1476 patients’ data were analyzed with 430 propensity matched pairs of analog vs human insulin compared and followed up for 3 years post-insulin initiation.
Total healthcare costs increased in all groups following the introduction of insulin. Although the insulin analogs (detemir, glargine) had a greater cost increase than NPH insulin in the first year following insulin initiation (+£220), by the second year the cost differential between groups was reduced to +£168, and by the third year to +£146. Furthermore, when accounting for the higher baseline costs for patients who were subsequently prescribed insulin analogs, the cost differential in year 3 was only £42. The driver of the cost differential between analog and NPH insulin groups in the first year appeared to be a higher cost for SMBG in the detemir group (p < 0.001).
The cost differential between the three groups (glargine, detemir, NPH) appeared to be transient, as the differences in the change in total healthcare cost between the insulin groups were not significant by the third year. The equalization in total healthcare cost changes (vs baseline) between the groups appears to be driven by a reduction in the cost of SMBG in the analog group and an increase in the cost of basal and bolus insulins in the NPH group in the third year. Other costs components such as hospital attendances, GP surgery, or home visits were similar in patients treated with analogs vs those receiving NPH insulin. This was consistent with a previous study that reported similar in-patient admissions, emergency room visits, and outpatient visits between the two types of insulinsCitation20. In contrast, another study reported lower incidences of office visits, hospitalizations, and emergency room attendances with glargine treatment compared with NPHCitation12. However, these different outcomes may be attributed to differences in healthcare systems between the studies.
One of the key advantages of analog insulins compared to NPH insulin is a reduction in the number of hypoglycemic events, particularly nocturnal eventsCitation8,Citation9. As rates of hypoglycemia in the THIN database are poorly recorded, the additional cost associated with NPH insulin following from more hypoglycemic events may not be captured in this data; accordingly, the positive cost differential between analogs and NPH insulin may be over-estimated. A previous study comparing the healthcare expenditure between glargine and NPH insulin reported significant reductions in the adjusted hypoglycemia rates and total healthcare costs over 2 yearsCitation12. This is consistent with clinical trial data reporting significant reductions in the rate of nocturnal hypoglycemic events with analogs compared with NPH insulinCitation21. A reduced rate of hypoglycemia is highly relevant given that hypoglycemia is associated with a substantial negative impact on patient quality-of-life, increased risk of anxiety, cardiovascular complications, and higher risk of anti-diabetes treatment discontinuationCitation22,Citation23. Hidden costs of hypoglycemia that we have not been able to incorporate in this analysis include ambulance call-out costsCitation24, indirect costs associated with reduced work capacity for patients and carers, as well as out-of-pocket expenses for the management and prevention of hypoglycemic eventsCitation25. An analysis of insulin users from an employer-based insurance database, for example, reported that hypoglycemia was associated with increased medical care use, medical costs, and claims for short-term disabilityCitation26.
Mean BMI estimates were in the unhealthy range (BMI >25) across patient groups at baseline, and each period following insulin initiation. Similarly, mean estimates of HbA1c were above 7.5% prior to and post-insulin initiation. These observations may relate to the relatively strict inclusion/exclusion criteria applied to the data analysed within the study, which aided the internal validity of the study findings with respect to comparisons between the insulins. Overall, despite all groups showing significant reductions from baseline in HbA1c, differences between the groups in terms of the estimated change in HbA1c values were non-significant (p > 0.05) for all years. However, glargine had the least weight gain at each year post-initiation. The difference in weight gain between glargine and NPH was statistically significant at year 1 (0.87 kg/m2 vs 1.11 kg/m2) and year 3 (1.15 kg/m2 vs 1.57 kg/m2) post-initiation.
Inferring differences between the relative cost-effectiveness of the insulins based on estimates of the cost per 1% reduction in HbA1c may be misleading. First, between-group differences in HbA1c were non-significant. Second, there may be important differences over time and in other measures of health (i.e. quality-of-life) that are not captured in these estimates but which would be required to adequately assess cost-effectiveness.
There are several limitations with using THIN observational data that are worth mentioning. Data reflect what a general practitioner captures during their consultation with a patient. For prescription data, this means that data is available only for what has been prescribed and this may be different to the medicine that the patient receives. For data on hospital utilization, this means that specialist- and hospital-delivered care may not be fully captured in the medical record. However, these limitations may be somewhat mitigated, as it is likely that the most important data affecting a patient’s care and outcomes are recorded in their general practitioner’s medical records. There was some missing data, particularly for the outcome variables of HbA1c and BMI, but this was addressed through appropriate statistical techniques. The limitations of THIN should be assessed against its value as a large nationally representative database of electronic medical records from ∼500 general practices in the UKCitation27; THIN enables estimates of the costs and effects of alternative treatments as they are used in real practice. Data of this kind enables informed clinical and economic decision-making.
Patients with diabetes-related complications were excluded from the analysis. Therefore, it is likely that results are an under-estimate of the total cost of treating T2DM patients receiving insulin therapy in UK clinical practices. However, the primary aim was to compare the costs and outcomes associated with the use of different basal insulins. Inclusion of comorbidities would have resulted in major allocation bias as the rationale for choosing an analog over an NPH insulin will be driven by, among other factors, types of comorbidities. Patients were required to have at least 6 months use of their initial study drug; patterns of switching were not assessed as part of this study. The analysis is, therefore, based on an intention-to-treat principle. This may be a limitation of this study, as the influence of switching on study results has not been determined.
In conclusion, following insulin initiation in type 2 diabetics, the difference in total healthcare costs of long-acting analogs compared to NPH insulin was transient. By year 3, the cost differences were not significantly different between the two cohorts, driven by a reduction in the cost of SMBG in the analog group and an increase in the cost of basal and bolus insulins in the NPH group. The long-acting insulin analog glargine was associated with the lowest level of weight gain of all the insulins.
These data suggest that users of long-acting insulin analogs may achieve better health outcomes than users of NPH insulin for similar total healthcare expenditure.
Strengths and limitations of this study
Strengths
THIN is a large nationally representative database of electronic medical records from ∼500 general practices in the UK, which enables estimates of the costs and effects of alternative treatments as they are used in real practice.
This study provides contemporary evidence of the real world cost and outcomes of using NPH insulin and insulin analogs that may inform debate around the appropriate use of healthcare resources in treating patients with T2DM.
Limitations
There was missing data to varying degrees (depending on the particular outcome). This was handled through appropriate statistical techniques.
Data reflect what a general practitioner in their consultation with a patient captures. For prescription data this means that we can only tell what has been prescribed and this may be different to what is taken. For data on hospital utilization this means that specialist and hospital delivered care may not be fully captured in the medical record.
Hypoglycemia is poorly captured within the THIN database, and clinical trial data suggests the rates differ between analog and NPH patients.
Conclusions
Following insulin initiation, the difference in healthcare costs of long-acting analogs compared to NPH insulin was transient. By year 3, the cost differences were not significantly different between the two cohorts, driven by an observed reduction in the cost of self-monitoring of blood glucose (SMBG) in the analog group and an increase in the cost of bolus insulin in the NPH group.
Transparency
Declaration of funding
This study was funded by Sanofi, the manufacturer of Lantus.
Declaration of financial/other relationships
All authors contributed to the protocol development. JG performed the data analysis, all authors contributed to interpretation of the results, and II led the manuscript development. JV and JG have received payment for lectures and consulting services to manufacturers of insulin products including Sanofi and Novo Nordisk. JG is an employee of HEOR Ltd. CT is an employee of Sanofi.
References
- Meier JJ, Bonadonna RC. Role of reduced β-cell mass versus impaired β-cell function in the pathogenesis of type 2 diabetes. Diabetes Care 2013;36(2 Suppl):S113-19
- Stratton IM, Adler AI, Neil HA, et al. Association of glycaemia with macrovascular and microvascular complications of type 2 diabetes (UKPDS 35): prospective observational study. BMJ 2000;321:405-12
- Janka HU, Hessel F, Walzer S, et al. Insulin glargine added to therapy with oral antidiabetic agents improves glycemic control and reduces long-term complications in patients with type 2 diabetes - a simulation with the Diabetes Mellitus Model (DMM). Int J Clin Pharmacol Ther 2007;45:623-30
- González EL, Johansson S, Wallander MA, et al. Trends in the prevalence and incidence of diabetes in the UK: 1996–2005. J Epidemiol Community Health 2009;63:332-6
- Gordon J, Evans M, McEwan P, et al. Evaluation of insulin use and value for money in type 2 diabetes in the United Kingdom. Diabetes Ther 2013;4:51-66
- Holden SE, Poole CD, Morgan CL, et al. Evaluation of the incremental cost to the National Health Service of prescribing analogue insulin. BMJ Open 2011;1:e000258
- Home PD, Fritsche A, Schinzel S, et al. Meta-analysis of individual patient data to assess the risk of hypoglycaemia in people with type 2 diabetes using NPH insulin or insulin glargine. Diabetes Obes Metab 2010;12:772-93
- Hermansen K, Davies M, Derezinski T, et al. A 26-week, randomized, parallel, treat-to-target trial comparing insulin detemir with NPH insulin as add-on therapy to oral glucose- lowering drugs in insulin-naive people with type 2 diabetes. Diabetes Care 2006;29:1269-74
- NHS. Type 2 diabetes mellitus. 2013. http://www.nice.org.uk/advice/ktt12/resources/non-guidance-type-2-diabetes-mellitus-pdf
- QIPP. Cochrane quality and productivity topics. Long-acting insulin analogues versus NPH insulin (human isophane insulin) for type 2 diabetes mellitus. www.evidence.nhs.uk/qualityandproductivity. Accessed December 20, 2012
- Idris I, Hucknall B, Roshan M, Davies M, on behalf of the East Midlands SHA Diabetes QIPP workstream steering group. Cost analysis of prescribing analogue insulin should take into account the bigger picture of diabetes treatment prescribing cost. BMJ journals. 2011
- Rhoads GG, Dain MP, Zhang Q, et al. Two-year glycaemic control and healthcare expenditures following initiation of insulin glargine versus neutral protamine Hagedorn insulin in type 2 diabetes. Diabetes Obes Metab 2011;13:711-17
- Schöffski O, Breitscheidel L, Benter U, et al. Resource utilisation and costs in patients with type 2 diabetes mellitus treated with insulin glargine or conventional basal insulin under real-world conditions in Germany: LIVE-SPP study. J Med Econ 2008;11:695-712
- The Institute for Translational Medicine and Therapeutics. A description of the THIN database. http://www.itmat.upenn.edu/ctsa/acard/docs/all_Description_THIN-FINAL.pdf. Accessed July 2014
- Joint Formulary Committee. British National Formulary. 63rd ed. London: BMJ Group and Pharmaceutical Press, 2012
- Netten A. Unit costs of health and social care. Canterbury: Personal Social Services Research Unit, University of Kent, 2011. http://www.pssru.ac.uk/pdf/uc/uc2011/uc2011.pdf. Accessed July 2014
- NHS reference cost schedules. http://www.dh.gov.uk/health/tag/reference-costs/. Accessed July 2014
- HM Treasury. GDP deflators: user guide. 2014. https://www.gov.uk/government/publications/gross-domestic-product-gdp-deflators-user-guide/gdp-deflators-user-guide. Accessed July 2014
- StataCorp. Stata statistical software: release 11 [program]. StataCorp, 2009
- Lee LJ, Yu AP, Johnson SJ, et al. Direct costs associated with initiating NPH insulin versus glargine in patients with type 2 diabetes: a retrospective database analysis. Diabetes Res Clin Pract 2010;87:108-16
- Riddle MC, Rosenstock J, Gerich J. Insulin Glargine 4002 Study Investigators. The treat-to-target trial: randomized addition of glargine or human NPH insulin to oral therapy of type 2 diabetic patients. Diabetes Care 2003;26:3080-6
- Fidler C, Elmelund Christensen T, Gillard S. Hypoglycemia: an overview of fear of hypoglycemia, quality-of-life, and impact on costs. J Med Econ 2011;14:646-55
- Ahrén B. Avoiding hypoglycemia: a key to success for glucose-lowering therapy in type 2 diabetes. Vasc Health Risk Manag 2013;9:155-63
- Khunti K, Fisher H, Paul S, et al. Severe hypoglycaemia requiring emergency medical assistance by ambulance services in the East Midlands: a retrospective study. Primary Care Diabetes 2013;7:159-65
- Brod M, Christensen T, Thomsen TL, et al. The impact of non-severe hypoglycemic events on work productivity and diabetes management. Value Health 2011;14:665-71
- Rhoads GG, Orsini LS, Crown W, et al. Contribution of hypoglycaemia to medical care expenditures and short-term disability in employees with diabetes. J Occup Environ Med 2005;47:447-52
- Lewis JD, Schinnar R, Bilker WB, et al. Validation studies of the health improvement network (THIN) database for pharmacoepidemiology research. Pharmacoepidemiol Drug Saf 2007;16:393-401