
Abstract
Objective:
To identify the direct and indirect costs of hypoglycemia in patients with Type 1 or Type 2 diabetes mellitus (DM) in the US setting.
Methods:
A literature review was conducted to identify and review studies that reported data on the economic burden of hypoglycemia and the related medical resource consumption or productivity loss related to hypoglycemia in patients with Type 1 or Type 2 DM. Relevant information was collated in an economic model to assess the direct and indirect costs following severe and non-severe hypoglycemic events in Type 1 and Type 2 DM.
Results:
Detailed evidence of the medical cost burden of hypoglycemic events was identified from 14 studies. For both Type 1 and Type 2 DM, episodes requiring assistance from a healthcare practitioner were identified as particularly costly and amounted to $1161 per episode (direct costs) compared with episode costs of $66 and $11 for events requiring third-party (non-medical) assistance and events managed by self-treatment, respectively. Indirect costs associated with severe hypoglycemia requiring non-medical assistance, severe hypoglycemia requiring medical assistance, and non-severe hypoglycemia were predicted to be $242, $160, and $11 for patients with Type 1 diabetes and $579, $176, and $11 for patients with Type 2 diabetes, respectively.
Conclusion:
Both severe and non-severe hypoglycemia incur substantial healthcare costs. Failure to account for these costs may under-estimate the value of management strategies that minimize hypoglycemia risk.
Introduction
Effective blood glucose control is the foundation of diabetes management aimed at minimizing microvascular and macrovascular complicationsCitation1. The risk of hypoglycemia increases when glucose control is intensified and this can act as a barrier to achieving blood glucose targetsCitation2. Hypoglycemia occurs more frequently in type 1 diabetes mellitus (T1DM), but is also a concern in type 2 diabetes mellitus (T2DM) from both a clinical and patient perspectiveCitation3. The clinical consequences of hypoglycemia have been widely debated following results from recent clinical trials such as ACCORDCitation4, which found that the frequency of both non-severe and severe hypoglycemia was considerably higher in the more intensively controlled cohort. Non-severe hypoglycemia events (NSHEs) are known to occur with a greater frequency than severe hypoglycemia events (SHEs); the UK Hypoglycemia Study GroupCitation5 reported incidence rates for SHEs of 110 and 320 events per 100 patient-years for individuals with T1DM who were receiving insulin treatment for less than 5 years or more than 15 years, respectively. This compared with 10 and 70 SHEs per 100 patient-years for individuals with T2DM who were receiving insulin treatment for less than 2 years or more than 5 years. In addition, NSHEs were found to be more frequent (410 and 1020 events per 100 patient-years, respectively) among individuals with T2DM within the same respective groupsCitation5.
Although NSHEs are more frequent, research has focused on the evaluation of the economic and clinical impact of SHEs; the health economic implications of NSHEs are less well understood, with the exception of the Brod et al.Citation6 paper. A recent survey of 1653 healthcare practitioners (HCPs) and 3587 patients with T2DM treated with insulin reported that NSHEs materially impact resource utilizationCitation7. A total of 52% of HCPs reported being contacted at least once per month by patients who experienced self-treated hypoglycemiaCitation7. Furthermore, Brod et al.Citation6 conducted a multi-country survey including 1404 respondents with T1DM and T2DM to investigate the impact of NSHEs on work productivity and diabetes management. The study reported that 13.7% of US patients contacted a HCP subsequent to a NSHE. Lost productivity associated with NSHEs was estimated to range from $15.26–$93.47 (USD) per event, representing 8.3–15.9 hours of lost work time per monthCitation6.
The cost of hypoglycemia is a complex issue because the burden may occur in multiple ways. Direct medical costs are incurred when healthcare resources are consumed to treat hypoglycemia; indirect medical costs accrue due to lost productivity when patients are absent from work. While there is a body of evidence in the literature regarding the costs and impact associated with hypoglycemia, the information is fragmented and does not include all types of resource utilization associated with both SHEs and NSHEs. Accordingly, the purpose of this study was to identify available data sources and collate such information in an economic model to estimate the direct and indirect cost consequences of both SHEs and NSHEs more precisely from a US payer perspective. These event-based costs can subsequently be applied in a hypoglycemia ‘decision tree’ model or a diabetes simulation model that considers the respective severity grades of hypoglycemia (e.g., the IMS CORE Diabetes ModelCitation8,Citation9).
Methods
Literature review
A detailed pragmatic literature review was performed to identify studies published between June 1, 2007 and June 1, 2012 that investigated or reported the types of medical resources used to treat hypoglycemia events with different severity grades and further the proportion of events (frequency) requiring treatment by these resources. In addition, information on productivity loss associated with SHEs and NSHEs was searched. A review of the MEDLINE database was performed using PubMed. The full search strategy can be found in the online supplemental appendix. Articles were included in the review if they reported the types of medical resources used to treat hypoglycemia events with different severity grades and further the proportion of events (frequency) requiring treatment by these resources. In addition, studies reporting productivity loss associated with SHEs and NSHEs were included. We excluded case reports, reader comments, or author responses, studies performed exclusively in critical care settings, studies that focused on drug poisoning or overdose-related hypoglycemia, non-diabetes conditions that may result in hypoglycemia (e.g., malaria, tumors), and neonatal or gestational hypoglycemia.
The initial number of abstracts identified from the literature search was 893. Following initial abstract review, 862 articles were excluded. Thirty-one articles of potential interest that meet inclusion criteria were included for full text review. In addition, 20 articles that were not identified via the electronic search but were retrieved from the reference sections of identified articles were included.
Information related to healthcare resource consumption potentially involved in treating hypoglycemia of different severity grades and productivity loss associated with hypoglycemia was collected and reviewed. Although no formal quantitative analyses were undertaken, we selected studies based on the quality of design, population characteristics, and size of study, definition of hypoglycemia (which varied from study to study), country setting (US preference), and date of publication. Medical resources that were found to be relevant from an economic perspective for the treatment of hypoglycemia were identified and information on the related frequency with which these resource categories are required to treat hypoglycemia events with different severity grades (NSHEs and SHEs) were collected.
Following the qualitative review, 14 articles were selected to inform the medical cost burden of hypoglycemic events (11 articles informing relevant healthcare resourcesCitation10–20, three articles informing frequency of resource useCitation6,Citation12,Citation13, two articles informing productivity lossCitation6,Citation21, and two articles informing the frequency of daytime and nocturnal hypoglycemic episodesCitation6,Citation22).
Definition of hypoglycemia
The definition of hypoglycemia varied between articles; we based our definition on what was found to be most commonly used in diabetes research. Hypoglycemia was sub-classified into NSHEs and SHEs. A NSHE was defined as an event not requiring assistance from another person (self-manageable) and a SHE was defined as an event requiring assistance of another person to actively administer carbohydrates or glucagon or to take other corrective actions. These definitions align with a recent consensus statement of the American Diabetes Association and the European Association for the Study of DiabetesCitation23 and a consensus achieved between the American Diabetes Association and the Endocrine SocietyCitation24. For costing purposes, SHEs were further sub-classified into events requiring non-medical, third-party assistance (SHE1) and events requiring medical assistance (SHE2).
Cost calculations
An economic model was developed in Microsoft Excel to estimate the expected direct and indirect event costs associated with NSHEs, SHE1, and SHE2 in 2012 US dollars. Wherever possible, direct and indirect costs were separately evaluated for T1DM and T2DM. However, in most cases, the available data used for cost calculations were obtained from studies that included individuals with both T1DM and T2DM, but no data stratification by diabetes type. Hence, with the exception of indirect costs for SHE1 and SHE2, which were evaluated separately for individuals with T1DM and T2DM, all direct hypoglycemia episode costs and indirect costs for NSHEs are generic and applicable to both diabetes types. All costs were standardized to 2012 using the Medical Care Consumer Price IndexCitation25.
Direct cost calculation
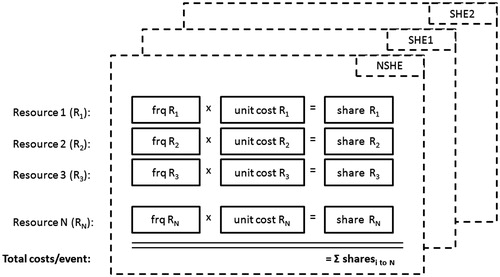
To estimate individual cost weights for the direct event cost calculation, the unit costs of all relevant medical resources identified to treat hypoglycemia were multiplied by the respective frequency with which that medical service was required to treat the event. For example, a frequency of 24% (chance that a SHE2 is associated with hospitalizationCitation12) is multiplied with presumed hospitalization costs of $5000 to yield a cost weight of $1200 for hospitalization following SHE2. The sum of individual cost weights (unit cost multiplied by frequency) across all included resource items was calculated to assess the overall direct hypoglycemic event costs separately for NSHEs, SHE1, and SHE2. The direct costs calculation model is illustrated schematically in .
Figure 1. Direct cost calculation model. R1 to RN = resource 1 to resoure N; frq R1 to frq RN = frequency of resource utilization 1 to N.
Medical resources
Medical resources that were found to be relevant from an economic perspective were extracted from 11 studiesCitation10–20 and included inpatient stays with and without prior emergency room (ER) visit, ER visits without subsequent hospitalization, ambulance service and outpatient visits in secondary care and visit to a general practitioner (GP) office, GP visit at home, nurse treatment, and telephone contact with medical care in primary care. Additional costs for treatment from non-HCPs such as glucose injections by non-medical personnel or self-treatment costs were considered, as well as costs for self-monitoring blood glucose (SMBG). These resources were considered to reflect the direct medical costs of NSHEs and SHEs.
Unit costs
The unit costs of healthcare resources were obtained from US public sources, including Medicare Physician Fee Schedule, Medicare Outpatient Prospective Payment System, Medicare Inpatient Prospective Payment System, and Medicare ambulance fee schedule. Costs for medical resources were sub-classified into primary and secondary care. A summary of the unit cost collection is presented in .
Table 1. Unit costs for medical resources included in the hypoglycemia model.
Primary care unit costs
Primary care costs are based on the US Medicare 2012 Physician Fee Schedule. Primary care physician visit costs were based on the average cost for an established patient ($51.07) (i.e., we assumed no home visits by PCPs in the US, but the hypoglycemia model was created to take this possibility into account for future model adaptation). It was assumed that services provided by nurse practitioners or clinical nurse specialists would be reimbursed at 85% of the physician visit fee for a medium, established patient.
Secondary care unit costs
Inpatient costs were obtained from the Medicare Inpatient Prospective Payment System. Although reimbursement rates are separately provided for different complication levels, the resource cost applied for hypoglycemia-related hospitalization was the cost of inpatient admission associated with complications and comorbidities. Costs for inpatient admission with prior ER visit are assumed to be equal to inpatient costs (from a payer perspective) because the ER visit cost would be folded into the subsequent inpatient admission. Costs for ER visit with no subsequent inpatient admission are calculated on the basis of the costs for the physician (from Medicare 2012 Physician Fee Schedule) and for the hospital ambulatory payment, which were obtained from the Addendum B of Medicare Outpatient Prospective Payment System for hospital outpatient services. Costs for an outpatient visit were not obtained as a standard reimbursable cost because this would require a detailed description of the procedures undertaken in outpatient treatment. Rather, outpatient costs were obtained from Curkendall et al.Citation14, who reported average costs for hypoglycemia-related outpatient treatment according to the analyzed insurance claims data. Ambulance-related costs were obtained from the 2012 Medicare ambulance fee schedule, where the base rate for an ambulance (Basic Life Support) was averaged across state localities.
Other treatment costs
It was assumed that patients who require assistance from another person but do not require medical attention (SHE1) would receive a glucagon intramuscular or subcutaneous injection at a cost of $55.02 per injection per event. This cost refers to the average price of a Glucagon Emergency Kit replacement vial. Prices are calculated from a payer perspective as the net effective sales price after 20% reduction from ex-manufacturer price due to discounts and rebates (which range between 15–25%)Citation26. The ex-manufacturer price was calculated as 80% of the net wholesale price of $85.94 based on IMS unpublished data. The hypoglycemia model was designed to allow the option of including direct costs from a non-payer perspective. Therefore, costs for self-treatment following NSHE based on Brod et al.Citation6 can also be included.
All costs applied in the economic model that predict the direct medical costs from a payer perspective associated with hypoglycemia are presented in , which also includes costs associated with out-of-pocket (OOP) expenses following self-treatment required to manage NSHEs. Brod et al.Citation6 reported monthly OOP costs following self-treatment of $11.50 for extra/special groceries, $4.81 for food and drink from vending machines or café/restaurants, and $4.73 for glucose products, such as tablets, gel tubes, or gum. Considering an event rate of 2.28 NSHEs per patient per month, this translates into OOP cost of $9.23 per episode. Although excluded in the base case analysis, OOP expenses were additionally considered to contribute to NSHE costs in sensitivity analysis. An outline of the approach taken for the direct medical cost calculation is shown in .
Table 2. Outline of the direct medical cost calculations for NSEH, SHE1, and SHE2 (T1DM and T2DM).
Frequency of resource requirements to treat hypoglycemia
Data on the frequency of resource items required to treat hypoglycemia events were obtained from three studiesCitation6,Citation12,Citation13. For NSHEs, the frequency of resource requirements was based on data published by Brod et al.Citation6, who analyzed the impact of NSHE on work productivity and diabetes management in 1404 individuals across four countries (US, UK, Germany, France). The author reported that 13.7% of US individuals contacted a HCP (either PCP, hospital, diabetes clinic, or other healthcare worker) as a result of the NSHEs, such as discussing dose adjustmentsCitation6. In our economic model, we assumed the HCP contact corresponds to a physician visit for a medium, established patient.
Furthermore, Brod et al.Citation6 reported that on average in the US population, each NSHE lead to an additional 3.9 SMBG tests. Although the study included patients with both T1DM and T2DM, the reported results were not stratified by diabetes type and, hence, extracted frequency data was applied equally to event cost calculations for individuals with T1DM and T2DM.
For SHE1, in the base case analysis, it was assumed that all individuals receive an intramuscular or subcutaneous glucagon injection. This was based on a previously reported costing approach for events requiring assistance by another person, but no medical attentionCitation10. Acknowledging that in clinical practice glucagon should be given only if patients are unconscious or unresponsive and unable to ingest oral glucose, lower frequency assumptions (75%, 50%, and 25%) were explored in sensitivity analyses as more conservative assumptions. Furthermore, HCP and SMBG costs for SHE1 were attributed to the same outcomes as those considered for NSHEs. Since no SHE1-specific data were identified in the literature review for the proportion of individuals that contacted a HCP and the number of additional SBMG tests subsequent to an event, we conservatively assumed the same data as applied for NSHEs, i.e., 13.7% contacted a HCP subsequent to a SHE1 event and 3.9 additional SMBG tests were assumed to follow each SHE1Citation6.
The frequency of required services following SHE2 is based on the resource utilization described by Bullano et al.Citation12, who retrospectively analyzed 2315 patients with T2DM from the administrative claims database of a southeastern US managed care plan. From a total of 410 hypoglycemic events (100%) that required assignment of a hypoglycemia ICD-9-CM code (i.e., required HCP assistance), 20% were treated in an outpatient practice, 26% were treated in office visits, 24% resulted in hospitalization including ER visit, 17% were treated in ER without subsequent hospitalization, and 13% resulted in nursing home encountersCitation12. These HCP services were regarded as mutually exclusive events. Office visits were considered to be equivalent to GP visits. The proportion of individuals requiring ambulance service following SHE2 was based on data from Leese et al.Citation13, who reported data from 160 individuals with diabetes who experienced 244 episodes of severe hypoglycemia, requiring emergency assistance from a UK hospital unit. Of these, 89 (34%) involved contact with the ambulance service only, 19 (7%) involved accident and emergency/primary care services only, and 134 (55%) invloved both. Accordingly, it was assumed that 55% of patients entering the ER or admitted to inpatient care with a prior ER visit require an ambulanceCitation13. Thus, if 24% of all SHE2 lead to hospital admission with prior ER visit and 17% are treated in ER with no subsequent hospitalization, it was concluded that in total 23% (=55%*[24% + 17%]) of individuals with SHE2 required ambulance services. As with the approach taken for SHE1, data from Brod et al.Citation6 were adopted to assume an additional 3.9 SMBG tests followed each SHE2.
Indirect cost calculation
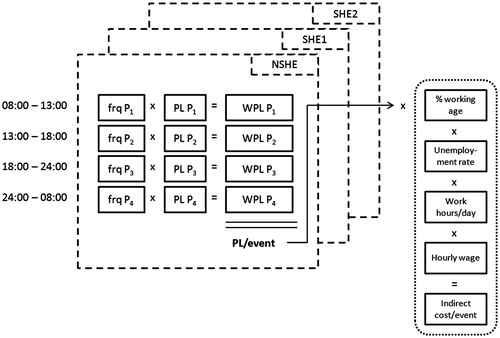
Indirect costs were defined as the expected productivity loss associated with hypoglycemia of different severity grades and estimated using a human capital approach. The human capital approach defines the value of a human life as the discounted market value of the output produced by an individual over an expected lifetime. Estimates of productivity loss took into account the time at which the event occured throughout the day. According to the approach taken by Gold et al.Citation22, four time periods were defined: two work time periods (08:00–13:00, 13:00–18:00), after work (18:00–24:00), and nocturnal (00:00–08:00). The frequencies of hypoglycemic events occuring during each time period were obtained from the published literatureCitation6,Citation22, multiplied by the period-specific productivity loss, and totalled to yield the overall expected loss in productivity for one event. This was adjusted for the percentage of the population of working age and the unemployment rate to derive the net productivity loss per event (expressed in days). Finally, the productivity loss was converted to monetary units by multiplying the number of work hours per day by the average hourly wage, with the latter being derived from the annual income divided by the total working hours per year. Assumptions on hypoglycemia-related productivity loss and the frequency of episodes across daytime periods were extracted from two studiesCitation6,Citation21. The approach applied to the indirect cost calculation is schematically illustrated in .
Figure 2. Indirect cost calculation model. P1 to P4 = four day and night time periods; frq P1 to P4 = frequency during which events occur across periods; PL = productivity loss; WPL = weighted productivity loss; PL/event = total productivity loss per event.
NSHE
Period-specific productivity loss assumptions for NSHEs are based on data from Brod et al.Citation6, who reported that NSHEs experienced during periods 08:00–13:00, 13:00–18:00, 18:00–00:00, and 00:00–08:00 resulted on average in 10.2, 10.2, 11.1, and 14.3 h of lost productivity, respectively. In that study, not all events resulted in productivity loss. The percentage of all NSHEs that resulted in lost productivity for the four consecutive periods was 10.79%, 10.79%, 8.47%, and 14.15%, respectively. Utilizing this data, the net amount of lost productivity for any NSHE was calculated as the product of work time lost per period multiplied with the percentage of individuals missing work time, which resulted in 1.10, 1.10, 0.94, and 2.02 h, respectively, of lost productivity for the four consecutive periods (e.g., 10.79% × 10.20 h = 1.10 h). The hourly figures were divided by 8 h of average work time assumed per day for one individual to convert to daily units, leading to 0.14, 0.14, 0.12, and 0.25 days of lost productivity, respectively.
The frequency during which NSHE occur across the four time periods was obtained from the same study, which reported that, from a total of 790 NSHEs that had occurred in the US population, 278 occurred during work time (08:00–13:00 and 13:00–18:00), 307 outside work time (18:00–00:00), and 205 during night time (00:00–08:00)Citation6. This leads to percentages of 17.6%, 17.6%, 38.9%, and 25.9%, respecitvely, for NSHEs occurring on average during the defined periods.
Period-specific productivity loss for the four consecutive periods was multiplied with the period-specific frequency weights and totalled to yield the overall expected productivity loss per episode. This number was finally adjusted for a 91.9% employment rateCitation27 and the presumption that 63% of the considered population are of working age (18–65 years)Citation28,Citation29, and converted to monetary units considering an average annual income of $27,915Citation30 at 40 work hours during the week and 48 working weeks in 1 yearCitation31.
SHE
According to data published by Gold et al.Citation22, it was assumed that 16% of SHEs (both SHE1 or SHE2) occur between 08:00–13:00, 9% between 13:00–18:00, 35% between 18:00–00:00, and 40% during night time between 00:00–08:00 (i.e., nocturnal). Data for period-specific productivity loss following SHE1 and SHE2 were obtained from Davis et al.Citation21, who reported lost productivity following severe events, mild-to-moderate events (which were combined in the study), and nocturnal episodes to be 3.6, 2.9, and 1.6 days, respectively, for individuals with T1DM, and 8.6, 2.7, and 2.5 days, respectively, for individuals with T2DM. The study did not further classify nocturnal episodes as mild, moderate, or severe. Productivity loss for mild-to-moderate events was applied to SHE1 in our calculation and respective data for severe events was applied to SHE2. Regarding the differentiation across day and nocturnal periods, Davis et al.Citation21 differentiated productivity loss only between daytime and nocturnal episodes. In our calculation, we applied the data for daytime episodes to the three periods between 8:00–0:00 and productivity loss following nocturnal episodes to the 0:00–8:00 period.
Likewise to the approach taken for NSHEs, the per-event productivity loss following SHEs was subsequently adjusted for employment rate and percentage of working-age population and then converted to monetary units.
Annualized direct and indirect costs of hypoglycemia
To put the direct and indirect costs of hypoglycemia into perspective, NSHE and SHE costs were applied on the hypoglycemia incidence reported by the UK Hypoglycemia Study GroupCitation5. That study reported incidence rates for SHEs of 10 and 70 events per 100 patient-years for individuals with T2DM treated with insulin for less than 2 years or more than 5 years, respectively. Respective rates for NSHE were reported at 410 and 1020 events per 100 patient-years. Following data from Leiter et al.Citation32, we assumed that 11.8% of all SHEs are attributable to SHE2 and the remaining percentage to SHE1.
Health-related quality-of-life
A reasonable body of evidence exists informing the impact of hypoglycemia on health-related quality-of-life (HRQoL)Citation3,Citation21,Citation33. However, effects on HRQoL were not considered for the purposes of the hypoglycemia model. All costs are estimated in $US and presented in 2012 values.
Results
Direct cost of hypoglycemic episodes
The direct cost calculation of hypoglycemic episodes is illustrated in . Direct medical costs associated with NSHEs were calculated as the sum of cost weights for the physician visits and additional SMBG tests and amounted to a total of $11.09 per episode. This was based on cost weights of $7.00 (13.7% × $51.07) for the physician visit and $4.10 for additional SBMG tests (3.9 tests × $1.05 per test stripCitation34). When OOP costs following NSHE self-treatment were included in the direct cost calculation, episode-related costs increased from $11.09 to $20.32.
Direct medical costs associated with SHE1 were calculated as the sum of cost weights for glucagon injection, HCP contact, and additional SMBG tests following SHE1. This resulted in a total direct medical cost of $55.02 + $7.00 + $4.10 = $66.11 for each SHE1. Sensitivity analyses assuming reduced glucose injection frequency of 75%, 50%, and 25% resulted in total direct medical SHE1 costs of $51.33, $36.55, and $21.78, respectively.
Resource costs weights for SHE2 were attributable to ER visits with no subsequent hospitalization, ambulance service, hospitalization with or without prior ER visit, outpatient visits, GP visits, nurse assistance, and extra SMBG tests and amounted to $23.65, $48.29, $1001.04, $64.96, $13.28, $5.64, and $4.10, respectively. The sum of cost weights for these resources resulted in a total direct medical cost of $1160.96 for each SHE2 ().
Indirect costs of hypoglycemic episodes
The overall expected productivity loss following NSHE was based on period-specific productivity loss and related frequency data and estimated at 0.16 days per NSHE (0.14 days × 17.6% + 0.14 days × 17.6% + 0.12 days × 38.9% + 0.25 days × 25.9% = 0.16 days). This translated into an indirect cost of $10.75 for individuals with T1DM and T2DM (0.16 days × 91.9% × 63% × $27,915/1920 work hours per year × 8 work hours per day) ().
Table 3. Indirect cost calculation.
Productivity loss following SHE1 episodes for individuals with T1DM was calculated as 60% × 2.9 days (weighted productivity loss for three diurnal periods) + 40% × 1.6 days (weighted productivity loss for nocturnal period) = 2.38 days and likewise for T2DM was calculated as 60% × 2.7 days + 40% × 2.5 days = 2.62 days. Following adjustment by employment rate, the percentage of working-age population and conversion to monetary units, indirect costs for SHE1 episodes were at $160.27 for individuals with T1DM and $176.43 for individuals with T2DM.
For SHE2 episodes, no difference was assumed between daytime and nocturnal productivity loss, and, hence, productivity loss reported by Davis et al.Citation21 for severe episodes was directly applied (3.6 days for T1DM and 8.6 days for T2DM). This lead to episode-specific indirect costs of $242.43 and $579.14 for individuals with T1DM and T2DM, respectively. All data applied in the indirect cost calculation and a schematic illustration of the costing approach are presented in .
Annualized direct and indirect costs of hypoglycemia
Based on annual event rates from the UK Hypoglycemia Study GroupCitation5, direct annual per patient costs of hypoglycemia were estimated at $45.48, $5.83, and $13.70 for NSHEs, SHE1s, and SHE2s, respecitvely, in individuals with T2DM for less than 2 years and $113.13, $40.82, and $95.90, respectively, for individuals with T2DM for more than 5 years. Indirect costs following productivity loss were estimated to be $44.08, $15.56, and $6.83 for individuals with T2DM for less than 2 years and $109.67, $108.93, and $47.84 for individuals with T2DM for more than 5 years, for NSHEs, SHE1s, and SHE2s, respectively. Per patient annual costs, as well as event-based costs following hypoglycemia with different severity grades in the US, are presented in .
Table 4. Direct, indirect, and total annualized costs of hypoglycemic episodes in T2DM individuals ($US).
Discussion
A significant body of evidence shows that severe hypoglycemic episodes are associated with considerable costs. Few identified studies examined the economic implications of NSHEs, and most were limited to examination of medical resources, but none provided episode-related costs that may be considered in health economic evaluations to compare alternative treatment strategies that may reduce or prevent the incidence of hypoglycemia. As such, this study aids to fill the gap of economic data informing the consequences of hypoglycemic episodes that do not require medical assistance. The approach to derive direct and indirect costs for hypoglycemia may be adapted to other country settings to inform hypoglycemia costs in other economies. Beyond the factors that contributed to the direct and indirect hypoglycemia cost estimation in our study, several additional considerations contribute to the burden of hypoglycemia that are typically not considered in heath economic evaluations. A recent survey of T2DM patients treated with insulin and HCPs reported that 10% of patients changed their basal insulin regimen, 14% intentionally let their blood glucose increase, and 16% missed doses to avoid hypoglycemiaCitation7. In addition, 82% of HCPs reported considering NSHE risk when choosing type of insulin therapy, and 57% started patients on lower insulin doses if a risk of hypoglycemia was elevatedCitation7.
It is also of note that hypoglycemia has been recognized as a contributor to clinical inertia in intensifying therapy, impacting maintenance of euglycemiaCitation35,Citation36. Although our study focused on the direct and indirect cost implications of hypoglycemic episodes, effects related to decreased patient adherence or contribution to clinical intertia in treatment intensification were not reflected in our considerations, but may contribute largely to the clinical and economic implications of hypoglycemia. For this purpose, more research is required, especially in real-world clinical settings, to quantify such effects on a patient-level basis, which would enable an integration in health economic evaluations and, as such, allow a generalized and overreaching comparison of alternative diabetes interventions with differential hypoglycemia safety profile.
Hypoglycemia episode costs in perspective
Several studies have analyzed costs of hypoglycemia on a per-event basis, although the majority of the literature focuses on SHE costs. Although SHE costs from this study appear to be similar to the predictions from other sources, inconsistencies in cost predictions may result from several factors, including a difference in the methodology for cost calculations and the definition of hypoglycemic episodes. The direct medical costs of SHEs requiring medical assistance (SHE2) of $1161 as predicted by our approach compared to $1404 (95% CI = $570–$2237) direct medical costs paid on average by a US-managed care plan for individuals with T2DM who were analyzed in 2004Citation12. The same study was referenced to inform the resource utilization frequency for SHE2 in our costing approach. The lower cost estimation as predicted by our approach is likely related to the fact that we referred to unit complication costs from the Medicare insurance program, which are generally lower than the average amounts paid by a managed care plan. Another US study that analyzed data from 1992–1998 examining patients with T1DM and T2DM treated with insulin, found that the mean cost of hypoglycemia requiring medical attention was $1723 per episode (range = $263–$7154)Citation37. Previous research reported data from a retrospective analysis of US insurance claims among 2.4 million patients with T2DMCitation14. In that study, hypoglycemia episodes requiring medical intervention were recorded, and overall episode costs were assessed to be $1008. When costs were analyzed by treatment setting, the overall hypoglycemia costs for patients treated with insulin amounted to $1451 and $622 for patients taking oral anti-diabetic drugs. The reduced costs for hypoglycemia episodes in patients treated with oral anti-diabetic drugs were attributable to the fact that fewer episodes lead to hospitalizations or ER visits.
No sources were identified that reported direct medical costs following hypoglycemic episodes that do not require medical intervention (SHE1 or NSHE). This justifies the objective of our study to address the gap in economic data informing the consequences of hypoglycemic episodes that do not require medical assistance.
Differentiation of episode costs for T1DM and T2DM
For the estimation of direct costs, this analysis has sought to characterize the resource utilization associated with hypoglycemic events stratified by their severity. Importantly, this analysis does not explicitly differentiate between hypoglycemia-associated direct costs specific to diabetes type. However, these differences are implicitly captured via the differential frequency and severity of events that are likely to occur in T1DM or T2DM or the specific glucose therapy prescribed. Little evidence exists to inform the expected differences in direct cost following hypoglycemia in patients with T1DM and T2DM on a per episode basis. The postal survey conducted by Davis et al.Citation21 suggested that, although overall for both T1DM and T2DM, the use of primary care resources following hypoglycemia episodes increased with the frequency and severity of episodes, no considerable difference in the percentage resource utilization per episode was evident between individuals with T1DM and T2DM. Although there may be specific factors associated with levels of resource utilization (e.g., age, comorbidities, and duration), the published literature on hypoglycemia-related costs do not report stratified analysis. Consequently, our estimated per-hypoglycemic event costs may fail to capture the true variability of costs that are likely to occur in clinical practice.
Larger diabetes type-specific differences may exist for indirect episode costs because productivity loss is likely to differ among diabetes types due to the different age distribution and employment situation. In our calculation, this is considered in the estimation of indirect costs for SHE1 and SHE2, which are evaluated separately for both diabetes types. However, for NSHEs, the data regarded for the indirect cost calculation are based on a study that included individuals with T1DM and T2DM who did not have subsequent stratification by diabetes typeCitation6, which only allowed for a generic estimation.
Limitations
Although the literature review conducted to inform this study was not instigated as a formal systematic review, the process undertaken was, nevertheless, rigorous, scientific, and reproducible. The research question, criteria for study inclusion, and data extraction were clearly identified and reviewed by all co-authors. Furthermore, we have provided relevant information for the interested reader in the online supplementary material. We believe that the findings from this review process represent a balanced and impartial summary of the evidence available, conditional upon the databases searched.
Within our approach taken for the indirect cost calculation following SHEs, it is recognized that the definitions of hypoglycemia applied by Davis et al.Citation21 are not precisely the same as those applied in our study. However, the application of productivity loss data from this study in the framework of our indirect cost calculation represents a conservative approach because, for both mild-to-moderate and severe events, the definitions from Davis et al.Citation21 describe less severe events as the grades defined for SHE1 and SHE2.
It has to be further acknowledged that Davis et al.Citation21 presented event-related productivity loss in terms of days lost from paid employment, non-paid activities, and the number of days helped by friends with usual activities. In the context of our indirect cost evaluation, we interpreted these costs as loss from paid employment. In the absence of data to indicate the proportion of productivity loss due to paid activities, we conducted a sensitivity analysis to assume that 50% of productivity loss presented by Davis et al.Citation21 is due to paid activites and 50% due to non-paid activities and aid from friends/family. Following this assumption, indirect costs following SHE1 and SHE2 decreased from $160 and $242 to $80 and $121, respectively, for patients with T1DM and from $176 and $579 to $88 and $290, respectively, for patients with T2DM. Hypoglycemia can also cause loss of work for the family members or colleagues at work, if they need to help a family member or colleague with severe hypoglycemia. This contribution is considered in the productivity loss estimation derived for SHE1 and SHE2Citation21, but not for NSHECitation6.
The fees applied to direct medical costs were determined using the medicare fee schedule; however, this by law is the lowest rate of reimbursement. The cost to private insured patients/systems and uninsured patients typically are higher than for medicare patients.
In rare cases a patient may suffer permanent brain damage or die due to hypoglycemia, which was not considered in our analysis due to the infrequent nature of these events.
Conclusion
The results of this analysis demonstrate that SHEs and NSHEs are associated with considerable costs in terms of both medical resource consumption and productivity losses. Failing to account for this cost burden may under-estimate the value of diabetes management strategies that have an effect on hypoglycemia risk.
Transparency
Declaration of funding
This work was a joint project funded by the Eli Lilly and Co., Indianapolis, Indiana, USA and IMS Health.
Declaration of financial/other relationships
VF, DG, and JP are employees of IMS Health, a research consultancy that receives funding from pharmaceutical companies. PM undertakes paid consultancy for IMS Health and also receives research funding from pharmaceutical companies. NV, BC, and KB are employees of Eli Lilly; BC and KB are shareholders of Eli Lilly. JME peer reviewers on this manuscript have no relevant financial or other relationships to disclose.
Supplemental Material.pdf
Download PDF (73.7 KB)Acknowledgments
The authors would like to thank Mitch DeKoven who is an employee of IMS Health and supported the unit cost collection for medical resources from US public sources.
Related Research Data
References
- American Diabetes Association. Standards of medical care in diabetes 2011. Diabetes Care 2011;34(1 Suppl):11–61
- Cryer PE. Hypoglycemia: still the limiting factor in the glycemic management of diabetes. Endocr Pract 2008;14:750–6
- Marrett E, Radican L, Davies MJ, et al. Assessment of severity and frequency of self-reported hypoglycemia on quality of life in patients with type 2 diabetes treated with oral antihyperglycemic agents: a survey study. BMC Res Notes 2011;4:251
- ACCORD Study Group, Gerstein HC, Miller ME, et al. Long-term effects of intensive glucose lowering on cardiovascular outcomes. N Engl J Med 2011;364:818–28
- UK Hypoglycaemia Study Group. Risk of hypoglycemia in types 1 and 2 diabetes: effects of treatment modalities and their duration. Diabetologia 2007;50:1140–7
- Brod M, Christensen T, Thomsen TL, et al. The impact of non-severe hypoglycemic events on work productivity and diabetes management. Value Health 2011;14:665–71
- Tahrani A, Barnett AH, Brod M, et al. Global survey finds three quarters of patients experience hypoglycemia on insulin analogue causing dose irregularities and increased blood-glucose monitoring. Poster number 222 presented at: 48th EASD Annual Meeting; October 1-5, 2012; Berlin, Germany
- Palmer AJ, Roze S, Valentine WJ, et al. The CORE Diabetes Model: projecting long-term clinical outcomes, costs and cost-effectiveness of interventions in diabetes mellitus (types 1 and 2) to support clinical and reimbursement decision-making. Curr Med Res Opin 2004;20(1 Suppl):5–26
- McEwan P, Foos V, Palmer JL, et al. Validation of the IMS CORE Diabetes Model. Value Health 2014;17:714–24
- Jönsson L, Bolinder B, Lundkvist J. Cost of hypoglycemia in patients with type 2 diabetes in Sweden. Value Health 2006;9:193–8
- Cobden D, Lee WC, Balu S, et al. Health outcomes and economic impact of therapy conversion to a biphasic insulin analog pen among privately insured patients with type 2 diabetes mellitus. Pharmacotherapy 2007;27:948–62
- Bullano MF, Fisher MD, Grochulski WD, et al. Hypoglycemic events and glycosylated hemoglobin values in patients with type 2 diabetes mellitus newly initiated on insulin glargine or premixed insulin combination products. Am J Health Syst Pharm 2006;63:2473–82
- Leese GP, Wang J, Broomhall J, et al. Frequency of severe hypoglycemia requiring emergency treatment in type 1 and type 2 diabetes: a population-based study of health service resource use. Diabetes Care 2003;26:1176–80
- Curkendall SM, Zhang B, Oh KS, et al. Incidence and cost of hypoglycemia among patients with type 2 diabetes in the United States: analysis of a health insurance database. J Clin Outcome Manag 2011;18:455–62
- Lee WC, Balu S, Cobden D, et al. Medication adherence and the associated health-economic impact among patients with type 2 diabetes mellitus converting to insulin pen therapy: an analysis of third-party managed care claims data. Clin Ther 2006;28:1712–25
- Fabunmi R, Nielsen LL, Quimbo R, et al. Patient characteristics, drug adherence patterns, and hypoglycemia costs for patients with type 2 diabetes mellitus newly initiated on exenatide or insulin glargine. Curr Med Res Opin 2009;25:777–86
- Lundkvist J, Berne C, Bolinder B, et al. The economic and quality of life impact of hypoglycemia. Eur J Health Econ 2005;6:197–202
- Quilliam BJ, Simeone JC, Ozbay AB, et al. The incidence and costs of hypoglycemia in type 2 diabetes. Am J Manag Care 2011;17:673–80
- Williams SA, Pollack MF, Dibonaventura M. Effects of hypoglycemia on health-related quality of life, treatment satisfaction and healthcare resource utilization in patients with type 2 diabetes mellitus. Diabetes Res Clin Pract 2011;91:363–70
- Hammer M, Lammert M, Mejías SM, et al. Costs of managing severe hypoglycaemia in three European countries. J Med Econ 2009;12:281–90
- Davis RE, Morrissey M, Peters JR, et al. Impact of hypoglycemia on quality of life and productivity in type 1 and type 2 diabetes. Curr Med Res Opin 2005;21:1477–83
- Gold AE, MacLeod KM, Frier BM. Frequency of severe hypoglycemia in patients with type 1 diabetes with impaired awareness of hypoglycemia. Diabetes Care 1994;17:697–703
- Nathan DM, Buse JB, Davidson MB, et al. Medical management of hyperglycemia in type 2 diabetes: a consensus algorithm for the initiation and adjustment of therapy: a consensus statement of the American Diabetes Association and the European Association for the Study of Diabetes. Diabetes Care 2009;32:193–203
- Seaquist ER, Anderson J, Childs B, et al. Hypoglycemia and diabetes: a report of a workgroup of the American Diabetes Association and The Endocrine Society. Diabetes Care 2013;36:1384–95
- U.S. Department of Labor. Bureau of Labor Statistics. U.S. consumer price index—all urban consumers. Medical care 1982-84. http://data.bls.gov/cgi-bin/surveymost?cu. Accessed August 2014
- Hay JW, Smeeding J, Carroll NV, et al. Good research practices for measuring drug costs in cost effectiveness analyses: issues and recommendations: The ISPOR Drug Cost Task Force Report-Part I. Value Health 2010;13:3–7
- US Bureau of Labor Statistics. http://www.bls.gov. Accessed June 15, 2013
- Werner CA. U.S. Department of Commerce, Economics and Statistics Administration U.S. Census Bureau. The Older Population: 2010. 2011. http://www.census.gov/prod/cen2010/briefs/c2010br-09.pdf. Accessed September 17, 2014
- Howden LM. U.S. Department of Commerce, Economics and Statistics Administration, U.S. Census Bureau. Age and Sex Composition: 2010, 2010 Census Briefs. 2011. http://www.census.gov/prod/cen2010/briefs/c2010br-03.pdf. Accessed September 17, 2014
- U.S. Census Bureau. State & county quick facts. http://quickfacts.census.gov/qfd/states/00000.html. Accessed September 17, 2014
- WorldatWork. Paid time off programs and practices: a survey of WorldatWork members, May 2010. http://www.worldatwork.org/waw/adimLink?id=38913. Accessed September 17, 2014
- Leiter LA, Yale JF, Chiasson JL, et al. Assessment of the impact of fear of hypoglycemic episodes on glycemic and hypoglycemia management. Can J Diabetes 2005;29:186–92
- Currie CJ, Morgan CL, Poole CD, et al. Multivariate models of health-related utility and the fear of hypoglycemia in people with diabetes. Curr Med Res Opin 2006;22:1523–34
- Yeaw J, Lee WC, Aagren M, et al. Cost of self-monitoring of blood glucose in the United States among patients on an insulin regimen for diabetes. J Manag Care Pharm 2012;18:21–32
- Cryer PE. The barrier of hypoglycemia in diabetes. Diabetes 2008;57:3169–76
- Saleh M, Grunberger G. Hypoglycemia: an excuse for poor glycemic control? Clin Diabetes 2001;19:161–7
- Heaton A, Martin S, Brelje T. The economic effect of hypoglycemia in a health plan. Manag Care Interface 2003;16:23–7