
Abstract
Objectives:
To develop an economic model to estimate the change in the number of events and costs of non-fatal myocardial infarction (MI) and non-fatal ischemic stroke (IS) as a result of implementing routine risk-stratification with a multiple inflammatory biomarker approach.
Methods:
Reductions in the numbers of non-fatal MI and non-fatal IS events and in related per-member-per-month (PMPM) and 5-year costs (excluding test costs) due to biomarker testing were modeled for a US health plan with one million beneficiaries. Inputs for the model included literature-based MI and IS incidence rates, healthcare costs associated with MI and IS, laboratory results of biomarker testing, MI and IS hazard ratios related to biomarker levels, patient monitoring and intervention costs and use/costs of preventative pharmacotherapy. Preventative pharmacotherapy inputs were based on an analysis of pharmacy claims data. Costs savings (2013 USD) were assessed for patients undergoing biomarker testing compared to the standard of care. Data from MDVIP and Cleveland Heart Lab supported two critical inputs: (1) treatment success rates and (2) the population distribution of biomarker testing. Incidence rates, hazard ratios, and other healthcare costs were obtained from the literature.
Results:
For a health plan with one million members, an estimated 21,104 MI and 22,589 IS events occurred in a 5-year period. Routine biomarker testing among a sub-group of beneficiaries ≥35 years old reduced non-fatal MI and IS events by 2039 and 1869, respectively, yielding cost savings of over $187 million over 5 years ($3.13 PMPM), excluding test costs. Results were sensitive to changes in treatment response rates. Nonetheless, cost savings were observed for all input values.
Conclusions:
This study suggests that health plans can realize substantial cost savings by preventing non-fatal MI and IS events after implementation of routine biomarker testing. Five-year cost savings before test costs could exceed $3.13 PMPM.
Introduction
Nearly one in every three deaths in the US in 2010 was directly attributable to cardiovascular disease (CVD)Citation1. The use of standard lipid panels to identify individuals at high risk for developing atherosclerotic CVD clearly does not identify all patients. A recent study showed that ∼50% of patients hospitalized with coronary artery disease have acceptable cholesterol levelsCitation2. Additionally, revisions made by the American College of Cardiology/American Heart Association to its prevention guidelines offer a new CVD risk calculator and allow for the broader use imaging and blood borne biomarkers to identify patients at riskCitation3,Citation4. Furthermore, with the removal of a treatment goal target LDL, the new guidelines leave undefined how to identify in which patients risk has been successfully mitigated and in which patients further or more aggressive treatment strategies are warranted. For all of these reasons, accurately understanding the degree of risk inherent in a covered population is key to deploying resources in an efficient and strategic manner and to avoiding unnecessary costs.
Recent research has found vascular inflammation is the final common pathway for atherosclerotic heart disease and its subsequent adverse eventsCitation5. Measures of vascular inflammation at distinct stages or vascular compartments include high-sensitivity C-reactive protein (hsCRP), lipoprotein-associated phospholipase A2 (Lp-PLA2), and myeloperoxidase (MPO)Citation6. HsCRP, Lp-PLA2, or MPO have not been shown to be involved in the atherosclerotic process, but, rather, their elevation in the blood offers insights into the pathophysiology of the artery wall. HsCRP is a non-specific general marker of inflammation that at low levels represents the degree of vasculopathy. Its elevation between 2–10 mg/L has been shown to be reflective of vasculopathy and risk for events. However, in patients with hsCRP levels of greater than 10 mg/L, it has not been shown to have clinical utility. Importantly, hsCRP has not been shown to be associated with vulnerable plaque, suggesting it may represent plaque burden more than plaque activity. Lp-PLA2 is elevated in the blood stream in response to macrophage activation in the intima/media of atherosclerotic plaque. Macrophage activation under the cap of the plaque is associated with vulnerable plaque formation. MPO is released by neutrophils and monocytes at sites of inflammation. The MPO assay quantifies the amount of free MPO in the blood stream. Free MPO in the blood stream is increased in response to vascular inflammation, including vulnerable plaque formation, fissures, and erosions in the luminal surface of the atherosclerotic plaque. Increased levels of Lp-PLA2 and MPO mark a patient at near term riskCitation5.
To date, no study has attempted to quantify the potential benefit of better stratifying near-term CVD risk through use of multiple inflammatory biomarker tests. The objective of the outcomes model described was to estimate the reduction in the number of events and costs of non-fatal MI and non-fatal IS for a commercial health insurer as a result of implementing routine testing with hsCRP, Lp-PLA2, and MPO. This article describes the model’s design, data inputs, and key calculations, and summarizes results.
Methods
A model was developed (Excel based) to estimate the effect of biomarker testing on the incidences and associated costs of non-fatal MI and non-fatal IS from a commercial health insurance plan perspective. CV events and costs over 5 years were modeled for one million commercially-insured beneficiaries aged 25 and older under two scenarios ():
Standard of care (SOC) scenario; and
Biomarker testing occurring among a portion of the patient population (biomarker testing) scenario.
Figure 1. Study design.
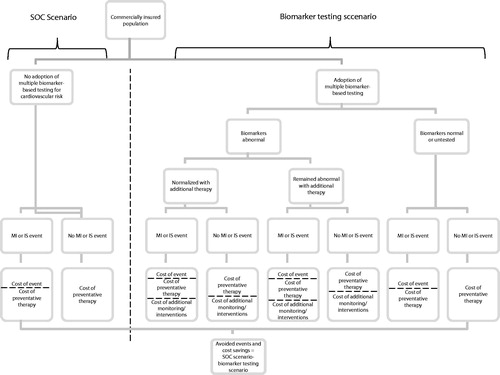
Reductions in non-fatal myocardial infarction (MI) and non-fatal ischemic stroke (IS) events and associated costs (2013 USD) were estimated by subtracting the biomarker testing scenario from the SOC scenario. OptumHealth Reporting and Insights insurance claims data, literature, and clinical expertise were used to inform model inputs describing population demographics, non-fatal MI and non-fatal IS risk and event costs, and prevalence of reventative treatment use. Sensitivity analyses were conducted by varying sub-sets of these input values to confirm robustness of results.
Model inputs
Inputs for the model were gathered primarily from literature and an analysis of pharmacy claims data. Default population age and gender distributions mirrored those reported in the 2010 US CensusCitation7. Baseline 12-month incidence rates of non-fatal MI and non-fatal IS were also derived from literature and were held constant over the course of the model ()Citation8–11.
Table 1. Twelve-month CV-event incidence per 10,000 persons by gender and age*.
Baseline preventative pharmacotherapy use and prescription drug costs were estimated using private insurance claims data from OptumHealth Reporting and Insights for a nationwide sample of privately insured individuals, aged 25 years and older. Rates of use were estimated as shares of patients with at least one prescription fill during Q1:2013 for one or more of four drug types: statins, anti-hypertensives, anti-diabetics and anti-coagulants. Annual prescription costs were evaluated among patients contributing to these shares. Statin costs were assessed for generic statins only.
Most of the remaining cost inputs were compiled from the literature (). Data from a 2013 MedPAC.gov report to Congress were used to inflate the per-event cost of IS reported by O’Sullivan et al. to include costs of long-term care servicesCitation12,Citation13. Cost per non-fatal MI were also literature-based and, like the non-fatal IS estimate, were set equal to per-patient costs incurred during a 36-month period. Costs of surgical cardiac interventions like coronary artery bypass graft surgery (CABG) triggered by the identification of one or more abnormal biomarker were informed by the cost of CABG reported in the literature. All cost values were inflated to 2013 USD using the Medical Care component of the CPICitation14.
Table 2. Cost inputs.
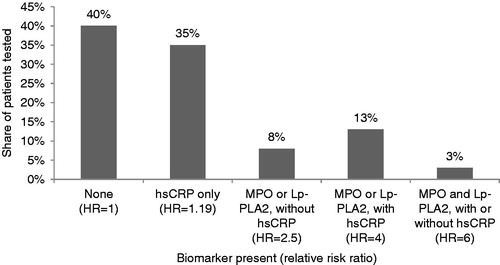
The real-world distribution of abnormal biomarkers among contemporaneously tested for hsCRP, Lp-PLA2 and MPO patients for each age and gender stratum came from 82,881 patients from the Laboratory Information System of Cleveland Heart Lab between 2011–2013. These patients had blood referred to Cleveland Heart Lab for MPO, Lp-PLA2 and hsCRP testing by their physician, based on clinical assessment and needs. No clinical history or data is known about these patients. Abnormal levels of biomarkers were defined as follows: hsCRP > 2.0 mg/L, MPO > 480, and LP-PLA2 > 200. shows the distribution of biomarker test results, weighted by age and gender, as well as the hazard ratios, illustrative of the relationship between biomarker-level elevation and risk of non-fatal MI or non-fatal stroke, that are used in the model. Published estimates of the effect of biomarker level(s) on various cardiovascular end-points support abnormal biomarker levels as indicators of increased riskCitation15–17. However, hazard ratios indicating risk of non-fatal MI or non-fatal stroke, specifically, for each combination of normal and abnormal biomarker level (relative to all normal levels), with ‘abnormal’ levels as defined above, and measured among a random sample of adults were not available. Thus, this study relied on estimated hazard ratios informed by both published data and clinical expertise. These estimates were lower relative to published ratios and subject to sensitivity analyses to verify that variations in these estimates produced consistent results.
Figure 2. Distribution of biomarker test results and relative risk ratios. Categories are mutually exclusive. HR indicates hazard ratio.
For patients with abnormal biomarker levels, additional monitoring increased with the number of abnormal biomarker levels. The cost of additional monitoring was fixed for all individuals with abnormal biomarker levels. Since biomarker testing may reveal the need for immediate intervention among individuals with the greatest inflammation and most at risk, 5% of individuals with abnormal levels of MPO and Lp-PLA2 received a surgical cardiac intervention.
We defined treatment success rate for inflammatory biomarkers based on our real-world data from >100,000 patients who had the MDVIP Annual Wellness Panel in 2011 and 2012Citation5. We observed a 63% reduction in the number of MPO positive patients from the first to second year of testing. This is consistent with the lowering of baseline median hsCRP from 4.2 mg/L to 2.2 mg/dL at 12 months and 1.8 mg/L at 48 months in the Jupiter trial in response to high dose statin therapyCitation18. Population-based treatment success for hsCRP was defined as 50% based on the findings of the Jupiter trial and 63% for Lp-PLA2 per clinical experience based on MPO findings from the MDVIP data. Patients who saw all abnormal biomarker levels normalize in response to treatment experienced complete treatment success; those who saw some but not all abnormal biomarker levels normalized experienced partial treatment success. The likelihood of treatment success for each individual biomarker was assumed independent of the status of each other biomarker.
The population distributions of biomarker testing, shown in , were generally reflective of the relationship among non-fatal MI and non-fatal IS event incidence, age and gender; initial testing rates were higher among older patients among individuals aged 25–74, and at least as high among males as among females. Because preventative treatment and frequent monitoring are already pervasive among elderly patients, the benefit of biomarker testing was assumed to peak among patients aged 65–74. Therefore, initial testing among the oldest patients was less common than was testing among patients aged 65–74.
Table 3. Assumed biomarker testing rates by gender and age, column %.
Recognizing the limited availability of published data on biomarker testing data inputs were subject to sensitivity analyses.
Model calculations
Since non-fatal MI and non-fatal IS event incidence and preventative-treatment use vary with age and gender, the health plan’s one million covered lives were first distributed among each of the 14 age and gender groups under both scenarios. For the SOC scenario, within each age and gender cohort, the total number of non-fatal MI and non-fatal IS events were generated by multiplying the age- and gender-specific incidence rate by the number of covered lives in the specified age and gender cohort. The total annual CVD-related healthcare costs were calculated as the sum of non-fatal MI and non-fatal IS costs, estimated as the product of per-event costs and total number of non-fatal MI and non-fatal IS events and costs of preventative prescription-drug therapy. Costs of preventative therapy were determined by applying the rates of use observed in the claims data to the age- and gender-specific population sizes and multiplying by the annual prescription drug costs.
In the biomarker testing scenario, patients were further stratified within each age and gender group into two sub-groups: those who underwent biomarker testing and those who did not. Patients in the former sub-group were then stratified by biomarker levels (i.e., abnormal or normal). Because testing was randomly applied within a given age and gender cohort, the distribution of abnormal biomarker levels (prior to any treatment-use or lifestyle changes resulting from knowledge of biomarker levels) was assumed equal for the pair of sub-groups and, therefore, equal to the distribution of the group as a whole. For this reason, CV-event incidence and preventative treatment-use rates among untested individuals in the biomarker testing scenario were identical to those among all individuals under the SOC scenario. Additionally, healthcare costs contributed by untested individuals in the biomarker testing scenario and those contributed by the same individuals under the SOC scenario were equal.
Among tested patients, the expected number of events, intensity of preventative therapy and additional health monitoring were adjusted according to patient risk revealed by biomarker testing. For example, among tested patients, CV-event incidence was adjusted upwards in the sub-group of patients with abnormal biomarker levels and downward for those with normal biomarker levels. Similarly, use of preventative pharmacotherapy was also increased among patients with abnormal biomarker levels. Preventative pharmacotherapy of patients with abnormal biomarker levels was based on clinical input. Preventative therapy had three main forms: (1) fine-tuning adjustments to patients’ current statin regimens (e.g., changes from one statin to another, changes in daily dose), (2) initiation of statin treatment among those not currently using statins, and (3) the addition of anti-hypertensive, anti-diabetic medication, and/or anti-coagulants to patients’ current statin-only or combination regimens. With each age and gender group, a sub-set of previously untreated tested patients was assumed to initiate statin-only therapy in response to abnormal biomarker test results. Among tested patients with at least one abnormal biomarker identified, the share of patients using only statins was assumed at least 1.5-times the share observed among untested. This multiplier increased with biomarker severity, from 1.5 among patients with abnormal hsCRP levels only, to 2.5 among patients with abnormal levels of MPO or Lp-PLA2, to 3 among those with abnormal levels of both MPO and Lp-PLA2. These increases were balanced by equivalent decreases in the shares of patients not receiving statin therapy. After adjusting these rates of use, CV-event incidence was again adjusted, this time downward, among patients with one or more formerly-abnormal biomarker levels who experience partial or complete treatment success. CV-event incidence for the population as a whole was only lowered as a result of biomarker testing and consequential treatment and lifestyle changes.
In addition to CV-event and preventative-therapy costs, total healthcare costs under the biomarker testing scenario included costs of additional monitoring and surgical cardiac intervention. Shares of patients with abnormal biomarker levels who did not receive additional monitoring remained constant over time. However, the total number of patients receiving additional monitoring decreased over time as some patients achieved biomarker-level normalization with statin or other unspecified treatment. Alternatively, patients at the highest risk of non-fatal MI and non-fatal IS, identified as 5% of individuals with abnormal levels of MPO and Lp-PLA2, were categorized as having received a surgical cardiac intervention in the first year only. Thus, surgical cardiac intervention costs were incurred only once in 5 years under the biomarker testing scenario.
The differences in the numbers of non-fatal MI and non-fatal IS events and in healthcare costs between the biomarker testing scenario and the SOC scenario yielded estimates of the clinical and economic impacts associated with implementing biomarker testing (excluding biomarker test costs). The PMPM impact was calculated as the total economic impact divided by the total number of patient months. Sensitivity analyses were conducted in order to confirm the robustness of the estimated budget impact. Key model parameters were varied above and below default settings, while fluctuations in the estimated impact were recorded.
Results
For a commercial health insurance plan with 1 million members, an estimated 21,104 non-fatal MI and 22,589 non-fatal IS events were estimated to occur over 5 years under the SOC scenario. The biomarker testing scenario showed an estimated 19,065 non-fatal MI and 20,719 non-fatal IS events over 5 years, a reduction of 2039 non-fatal MI and 1869 non-fatal IS events relative to the SOC scenario ().
Table 4. Estimated number of non-fatal MI and non-fatal IS events over 5 years.
Relative to the SOC scenario, the biomarker testing scenario resulted in substantial cost savings due to the avoided non-fatal MI and non-fatal IS events. Accounting for increased prescription drug costs, additional monitoring costs, and intervention costs associated with biomarker testing, 5-year savings amounted to $187,695 or $3.13 PMPM (not accounting for biomarker test costs) ().
Table 5. Estimated change in related healthcare costs over 5 years, in $ thousands.
Sensitivity analysis
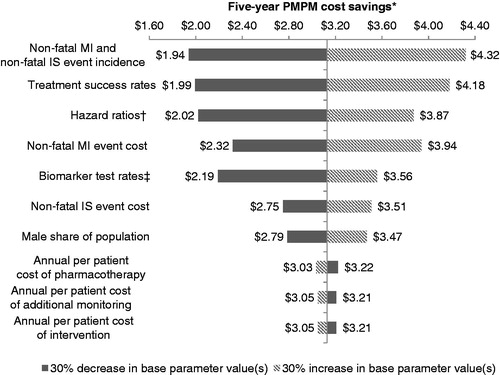
shows the detailed results of the one-way sensitivity of estimated healthcare cost savings to changes in base input values. Estimated PMPM healthcare cost savings (before biomarker test costs) were most sensitive to changes in non-fatal MI and non-fatal IS incidence rates, treatment success rates among patients with one or more identified abnormal biomarkers, and changes in non-fatal MI and non-fatal IS hazard ratios among biomarker-tested patients with one or more abnormal biomarker level relative to those with normal biomarker levels. Estimated 5-year PMPM savings peaked at $4.32, with 30% increases in base non-fatal MI and non-fatal IS incidence rates. Conversely, 30% decreases in non-fatal MI and non-fatal IS incidence rates returned $1.94 PMPM healthcare cost savings through 5 years of biomarker testing. Because each non-fatal MI event represented substantially more costs to the insurer relative to non-fatal IS, estimated savings were more sensitive to fluctuations in the per-event cost of non-fatal MI than to identical percentage fluctuations in the per-event cost of non-fatal IS. Additionally, fluctuations in the population’s shares of males moderately impacted 5-year PMPM cost savings as baseline CVD risk among men exceeded that among women of equal age and as treatment success rates were not assumed to vary with gender. Finally, increases in the annual per-patient costs of pharmacotherapy, additional monitoring and intervention were found to have negative, but relatively small impacts on healthcare cost savings; decreases in these costs produced equivalently minor but positive impacts on healthcare cost savings.
Figure 3. Sensitivity of estimated healthcare cost savings to changes in base input values. *PMPM indicates per-member-per-month in reference to cost savings/increase resulting from adoption of biomarker testing. †Hazard ratios were not permitted to fall below one. ‡Biomarker test rates were not permitted to exceed 90%.
A two-way sensitivity analysis varying the two inputs to which the results were most sensitive (i.e., non-fatal MI and non-fatal IS incidence rates and treatment success rates) showed that cost savings persist, even through 30% decreases in the base values of each input variable (PMPM cost savings: $1.14). In addition, with values 30% higher than their baseline rates, cost savings were estimated to reach ∼$5.68 PMPM.
Discussion
The objective of the outcomes model described was to estimate the reduction in the number of events and costs of non-fatal MI and non-fatal IS for a commercial health insurer as a result of implementing routine biomarker assessment of vascular inflammation with hsCRP, Lp-PLA2, and MPO.
In a commercial health insurance plan with 1 million members aged 25 and older, introducing biomarker testing for members aged 35 and older was expected to reduce non-fatal MI and non-fatal IS events by 2039 and 1869, respectively, yielding almost $188 million in cost savings ($3.13 PMPM) before biomarker test costs. The decreased costs are attributable to reductions in the number of non-fatal MI and non-fatal IS events due to treatment of high-risk patients distinguished from their age- and gender-similar peers through biomarker testing.
The costs savings associated with implementing biomarker testing and mitigating risk via documented lowering of these markers highlights that serious cardiac events can be avoided with relatively inexpensive preventative therapies (e.g., generic statins, identification of pre-diabetic hyperinsulinemia) after identifying patients who are at increased near-term risk. By identifying those with elevated risk in a sample of tested patients, biomarker testing can assist in identifying sub-populations at increased risk of non-fatal MI and non-fatal IS. Physicians could then better allocate time and resources for patient education and added testing to those patients at the highest risk. As routine biomarker testing is implemented in larger populations, future research should attempt to assess the real-world decrease of CVD as well as associated healthcare resource utilization and costs.
Although its findings may have major implications for CVD prevention and associated costs, the model had several limitations due to the limited availability of published data on biomarker testing. While the model inputs are data driven, results from the sensitivity analyses demonstrate how variations in our model input could impact cost savings to the plan. Although variations may be present, the sensitivity analyses of the model consistently predicted significant healthcare cost savings with biomarker testing. Across these variations, estimated savings bottomed at just under $2.00 PMPM. With treatment success rates 30% below their default values, biomarker testing was associated with healthcare cost savings of ∼$1.99 PMPM. Meanwhile, a 30% increase in each age- and gender-specific biomarker testing rate saw savings in excess of $3.55 PMPM. Greater still are the savings that resulted from 30% increases in treatment success rates. Additionally, default time to and rates of treatment success assumed compliance with prescribed treatment regimens and may have, therefore, over-estimated the benefit of treatment in the event that some patients are non-compliant. For patients who were identified to have low CVD risk, cost savings may be under-stated due to the potential for physicians to reduce treating these patients with drugs.
Next, costs were analyzed from the perspective of a single third-party payor. As a result, costs of long-term care and other rehabilitation services covered by other payors were not included in the cost estimates reported. For contractual and proprietary reasons, costs of the biomarker tests were not incorporated into the model. Real-world testing patterns suggest that, after initial screening, patients without abnormal biomarkers would not require annual screening for all three markers. In many instances, the interval of re-testing for patients with normal biomarker levels is multiple years. Furthermore, in patients with abnormal biomarker levels, physicians tend to re-test patients for the specific biomarkers with abnormal levels. Given the large costs savings associated with testing and the infrequent schedule of re-testing for low- and medium-risk individuals, plans can expect to see cost savings after accounting for the costs of biomarker tests.
Lastly, actual rates of biomarker testing employed within each age and gender group may differ from those assumed in the model. Similarly, other inputs such as age and gender distributions, baseline rates of preventative statin use, and non-fatal MI and non-fatal IS incidence rates reflect rates observed in specific studied populations. Additionally, the model was not designed to calculate cost savings and avoided events with attention to the distributions of ethnic groups in the patient population, as biomarker levels may vary between groups. Hence, the results presented here may not be generalizable to all populations to the extent that the population of interest does not mirror the populations from which the model’s default input values were drawn.
Given the potential for large reductions in the number of non-fatal MI and non-fatal IS and associated cost savings, payors should provide coverage for these novel biomarker tests. With widespread availability of testing, physicians will be able to better target patients who have near-term CVD risk and, as a result, quickly and efficiently prevent a large number of avoidable CVD events. In the longer-term, identifying at-risk individuals earlier may help further reduce the number of expensive cardiac interventions such as CABG.
Conclusions
As CVD risk assessments and treatment guidelines change, there is a large need to better assess near-term CVD risk in order to determine which patients need therapy and which patients on therapy still have excessive riskCitation6. By more accurately stratifying CVD risk, plans can deploy resources more strategically and help to better manage patient outcomes.
This study suggests that health plans can realize substantial cost savings by preventing non-fatal MI and non-fatal IS events after implementation of routine biomarker testing. Cost savings (before accounting for biomarker test costs) could exceed $3.13 PMPM.
Transparency
Declaration of funding
Funding for this research has been provided by Cleveland HeartLab, Inc.
Declaration of financial/other relationships
Research support was provided to Analysis Group, Inc. by Cleveland Heart Lab, Inc. MY, AKGC, JD and HB are employees of Analysis Group, Inc. MSP is the scientific and medical founder of Cleveland HeartLab, Inc. (OH). MSP also serves as the Chief Medical Officer of Cleveland HeartLab, Inc. SP and MB are employees of Cleveland HeartLab, Inc. AK is the Chief Medical Officer of MDVIP. The other authors have no conflicts of interest that are directly relevant to the content of this study. JME peer reviewers on this manuscript have no relevant financial or other relationships to disclose.
Acknowledgements
The authors are grateful for the substantial research assistance provided by Todor Totev of Analysis Group, Inc. The authors also thank Jake Orville, CEO of Cleveland HeartLab, Inc. for his assistance during this project. Mr. Totev has no additional financial conflicts of interest to disclose. Mr. Orville is an employee and shareholder of Cleveland HeartLab, Inc.
Notes
*The model estimated numbers of events and costs among all beneficiaries age 25 and older under both scenarios. However, the impact of biomarker testing relative to the standard of care for patients aged 25–34 was not captured in the model’s estimated impact as the model default assumed that no patients aged 25–34 received routine biomarker testing under either scenario.
*Testing rates are capped at 90% over all age and gender strata. Sensitivity analyses of biomarker testing rates are conducted as percentage changes in all age- and gender-specific testing rates. Because testing rates among patients aged 25–34 equal 0% under the model default, the effect of testing patients aged 25–34 is not captured in any sensitivity.
References
- Murphy SL, Xu J, Kochanek KD. Deaths: final data for 2010. Natl Vital Stat Rep 2013;61:1-117
- Sachdeva A, Cannon C, Deedwania P, et al. Lipid levels in patients hospitalized with coronary artery disease: an analysis of 136,905 hospitalizations in Get with the Guidelines. Am Heart J 2009;157:111-7.e2
- Goff DC, Jr Lloyd-Jones DM, Bennett G, et al. 2013 ACC/AHA guideline on the assessment of cardiovascular risk: a report of the American College of Cardiology/American Heart Association Task Force on Practice Guidelines. Circulation 2014;129(25 Suppl 2):S49-73
- 2013 prevention guidelines tools: CV risk calculator. American College of Cardiology/American Heart Association, 2013. http://my.americanheart.org/professional/StatementsGuidelines/PreventionGuidelines/Prevention-Guidelines_UCM_457698_SubHomePage.jsp. Accessed July 15, 2014
- Penn MS, Klemes AB. Multimarker approach for identifying and documenting mitigation of cardiovascular risk. Future Cardiol 2013;9:497-506
- Pencina MJ, Navar-Boggan AM, D'Agostino RB, Sr et al. Application of new cholesterol guidelines to a population-based sample. N Engl J Med 2014;370:1422-31
- Howden LM, Meyer JA. Age and sex composition: 2010. Washington, DC: United States Census Bureau, 2011
- Witt BJ, Ballman KV, Brown RD Jr., et al. The incidence of stroke after myocardial infarction: a meta-analysis. Am J Med 2006;119:354.e1-9
- National Heart, Lung, and Blood Institute. Incidence and prevalence: 2006 chart book on cardiovascular and lung diseases. Bethesda, MD: National Institutes of Health, 2006
- Go AS, Mozaffarian D, Roger VL, et al. Heart disease and stroke statistics–2013 update: a report from the American Heart Association. Circulation 2013;127:e6-245
- Annual estimates of the resident population by sex, age, race alone or in combination, and Hispanic origin for the United States: April 1, 2010 to July 1, 2012. Washington, DC: United States Census Bureau, 2013
- O’Sullivan AK, Rubin J, Nyambose J, et al. Cost estimation of cardiovascular disease events in the US. PharmacoEconomics 2011;29:693-704
- Medicare Payment Advisory Commission (MedPAC). Approaches to bundling payment for post-acute care. Report to Congress: Medicare and the health care delivery system. MedPAC, 2013. MedPAC.gov. Accessed June 2013
- Consumer price index for all urban consumers (CPI-U): medical care. Washington, DC: Bureau of Labor Statistics, 2013
- Heslop CL, Frohlich JJ, Hill JS. Myeloperoxidase and C-reactive protein have combined utility for long-term prediction of cardiovascular mortality after coronary angiography. J Am Coll Cardiol 2010;55:1102-9
- Folsom AR, Chambless LE, Ballantyne CM, et al. An assessment of incremental coronary risk prediction using C-reactive protein and other novel risk markers: the atherosclerosis risk in communities study. Arch Intern Med 2006;166:1368-73
- Ballantyne CM, Hoogeveen RC, Bang H, et al. Lipoprotein-associated phospholipase A2, high-sensitivity C-reactive protein, and risk for incident ischemic stroke in middle-aged men and women in the Atherosclerosis Risk in Communities (ARIC) study. Arch Intern Med 2005;165:2479-84
- Ridker P, Danielson E, Fonseca F, et al. Rosuvastatin to prevent vascular events in men and women with elevated C-reactive protein. N Engl J Med 2008;359:2195-207
- Magnuson EA, Farkouh ME, Fuster V, et al. Cost-effectiveness of percutaneous coronary intervention with drug eluting stents versus bypass surgery for patients with diabetes mellitus and multivessel coronary artery disease: results from the FREEDOM trial. Circulation 2013;127:820-31