
Abstract
Objectives:
To evaluate 12-month treatment patterns, healthcare resource use (HCRU), and costs for patients with rheumatoid arthritis (RA), following initiation of index TNF inhibitors (TNFi) and subsequent biologic DMARDs (bDMARDs).
Methods:
This was a retrospective cohort analysis of adults with RA newly initiating TNFi in the Truven Marketscan Commercial Claims and Encounters and Medicare Supplemental Databases during 2010–2013. A sub-group of patients who switched to a bDMARD within 12 months post-index and within 180 days of last index TNFi were subsequently evaluated over 12 months. TNFi/bDMARD treatment patterns were characterized as: continuers, no gap >180 days in prescription/administration of index TNFi; discontinuers, gap >180 days; switchers, initiated new bDMARD. Concomitant conventional synthetic DMARD use, co-morbid chronic illnesses, and RA severity were assessed. All-cause/RA-related HCRU and costs were evaluated 12 months post-index.
Results:
Of 9567 identified patients, 67.2%, 17.3%, and 15.4% were continuers, discontinuers, and switchers, respectively. Switchers had the highest 12-month unadjusted mean all-cause costs of $34,585 vs $33,051 for continuers (p = 0.1158) and $24,915 for discontinuers (p < 0.0001; discontinuers vs continuers, p < 0.0001). RA-related costs comprised 82.8%, 31.4%, and 85.7% of total costs for continuers, discontinuers, and switchers, respectively. Of 764 switchers, 68.2% switched to alternative TNFi (cyclers), the rest to non-TNFi bDMARDs; 36.7% of patients who switched to TNFi switched again (to third-line bDMARD) vs 27.6% (p = 0.0313) of those who switched to non-TNFi bDMARDs. Switchers to non-TNFi bDMARDs had higher mean 12-month all-cause costs of $76,580 compared with $50,689 for switchers to alternative TNFi (p < 0.0001); biologic-administration visits comprised 78.8% of the greater total RA-related costs of switchers to non-TNFi bDMARDs.
Conclusions:
Real-world TNFi discontinuation/switching rates correspond to randomized controlled trial non-response rates. TNFi cycling is common and associated with an increased likelihood of switching to third-line bDMARD. Switching to non-TNFi bDMARDs was associated with higher costs, mostly attributed to in-office administrations.
Introduction
Rheumatoid arthritis (RA) is a chronic autoimmune disease affecting 0.5–1.0% of the general adult population worldwide and is characterized by persistent synovitis, systemic inflammation, and may ultimately lead to joint destruction in many patientsCitation1,Citation2. As a chronic disease, RA places a substantial economic burden on patients, their families, and society as a whole. Annual direct medical costs range from $2000–$10,000 per patient, and indirect costs range from $1500–$22,000 per patientCitation3. Using data from a large insurance claims database, Kleinman et al.Citation4 reported that average annual costs were ∼$5200 higher for workers with RA compared with those without RA: $8700 vs $3500 per employee, respectively; 90% of the excess RA-related costs were attributed to direct medical costs.
Methotrexate (MTX) is recommended as the first-line treatment for RA by the American College of Rheumatology (ACR)Citation5 and the European League Against Rheumatism (EULAR)Citation6. Although MTX is effective in reducing the signs and symptoms of RA, slowing the progression of joint damage, and improving quality-of-life, the intensive use of MTX monotherapy has been shown to achieve ACR- and EULAR-defined disease control (remission or at least low disease activity) in only approximately one third of patientsCitation5,Citation6. Additional therapy for patients who fail MTX treatment may include treatment with other conventional synthetic disease-modifying anti-rheumatic drugs (csDMARDs) or biologic DMARDs, such as tumor necrosis factor inhibitors (TNFi), administered alone or in combination with csDMARDsCitation5,Citation6.
Discontinuation, gaps in treatment of 1–3 months, and switching between therapies (TNFi or other biologic DMARDs) are common occurrences for patients requiring TNFi therapy following initial MTXCitation7–9. Previous observational studies and systematic reviews investigating switching of TNFi medications have provided conflicting evidence about the outcomes when switching to a second TNFi vs a non-TNFi biologic after failure of initial TNFi. One study assessing the impact of treatment-switching patterns found similar outcomes for patients switching to an alternative TNFi compared with those switching to a non-TNFi biologic DMARDCitation10. Others have shown that the likelihood of responding to future treatments decreases with every subsequent TNFi treatment initiationCitation11 and that switching to a non-TNFi biologic DMARD may be more effective for patients with TNFi non-responseCitation12. One potential explanation for these observations could be the different mechanisms behind individual patient inadequate response to TNFi. An observational study found that, among patients who failed TNFi, those who developed antibodies to their first-line TNFi subsequently had poorer response to second-line TNFi treatments compared with those who did not develop initial neutralizing antibodiesCitation13. Combining TNFi with MTX has been shown to reduce the immunogenicity of some TNFi, including adalimumab and infliximabCitation14–16. In addition, patients receiving TNFi and MTX combination therapy have been shown to be less likely to discontinue treatment for efficacy reasons and to experience adverse events (AE)Citation17.
Optimizing adherence and persistence with therapy is a major challenge among patients with RA, as the implications of inadequate adherence and non-persistence with prescribed regimens can be far reaching in terms of reducing treatment effectiveness. Persistence and adherence are also linked with healthcare costs and resource use. In general, poor treatment adherence and persistence is associated with greater healthcare costs and resource use. Furthermore, monthly total healthcare costs have been shown to be higher for patients with RA who switch therapy than for those who do not, and higher again for a second or third switchCitation18.
Here, we aim to provide an evaluation of treatment patterns, associated healthcare resource use (HCRU), and costs for patients with RA in the 12-month period following TNFi treatment initiation. In addition, we further examine overall TNFi treatment cycling patterns, HCRU, and costs in the 12-month period following switch from index TNFi to another biologic DMARD (alternative TNFi or a non-TNFi biologic DMARD).
Patients and methods
Study design
This was a retrospective cohort analysis of patients aged ≥18 years with any diagnosis of RA (≥2 outpatient visits [on different days] or one inpatient visit for RA [ICD-9 code: 714.xx]) who newly initiated treatment with a TNFi (etanercept, adalimumab, infliximab, golimumab, or certolizumab pegol) in the Truven Marketscan Commercial Claims and Encounters and Medicare Supplemental Databases from 2010–2013. All patients were continuously enrolled for ≥6 months before and ≥12 months after the index TNFi claim (yielding index dates in 2011 and 2012).
Similar to other analysesCitation19–24, we defined new starts as patients who were not prescribed a biologic DMARD during the 6-month pre-index period. Patients with another inflammatory disease diagnosis (e.g., Crohn’s disease, ulcerative colitis, ankylosing spondylitis, psoriasis, systemic lupus erythematosus, overlap connective tissue disease [CTD], mixed CTD, and/or undifferentiated CTD), and those who received >1 biologic DMARD within 14 days were excluded to avoid misclassification of index treatment and switching, given that this is not a sufficient trial period for attributing outcomes.
Assessments
TNFi treatment patterns and costs in the 12-month period following index TNFi prescription
Patients were categorized by post-index TNFi treatment pattern as continuers (continuing this first-line treatment), discontinuers, or switchers. Continuers were defined as having no gap in treatment >180 days and no treatment with a non-index biologic DMARD. Discontinuers had a treatment gap >180 days, while switchers were patients initiating a non-index biologic DMARD (i.e., switched to second-line therapy). Patients did not need to complete the 180-day gap before the end of the 12-month post-index period to be classified as discontinuing therapy. Use of a 180-day gap is consistent with other published studiesCitation25–28 and, unlike studies with shorter gaps, we did not use days’ supply, rather time between prescriptions and administrations.
Of the switchers, a sub-group of patients who switched to another biologic DMARD ≤180 days from last TNFi prescription/administration and had ≥12 months of continuous enrollment following that switch were identified; for this sub-group of patients, their secondary treatment pattern (e.g., the switch to third-line therapy) was assessed as well.
For all patients, concomitant csDMARD use was evaluated ±30 days from first and last index TNFi prescription/administration. Patient treatment was defined as TNFi monotherapy if no concomitant csDMARD was received within ±30 days of the first index TNFi prescription/administration.
The Charlson Comorbidity Index (CCI) (a weighted scale of 17 co-morbidities presented as a summative score)Citation29 was used to evaluate co-morbid chronic illnesses, and RA severity was assessed using the claims-based index of RA severity (CIRAS) scale (0 [low]–10 [high])Citation30.
Using the paid claims data, all-cause and RA-related medical (outpatient, inpatient, and emergency room visits) and pharmacy utilization and costs were evaluated during the 12-month post-index period. RA-related medical utilization included visits with ICD-9:714.xx in any position on the claim. Among patients who switched to a non-index biologic DMARD within the 12-month post-index period (i.e., switchers), outpatient visits for a biologic administration (regardless of presence of RA diagnosis) using HCPCS codes were also evaluated given the expanded focus on infusible biologic DMARDs as second-line treatment. RA-related pharmacy utilization and costs consisted of all National Drug Code pharmacy claims for csDMARD and biologic DMARD prescriptions. Costs included both patient- (deductible, co-payments, and co-insurance) and health plan-paid costs. Medicare and employer supplemental insurance paid amounts were evaluated for Medicare patients. Total healthcare costs were the sum of medical and pharmacy costs.
Statistical analyses
Patient characteristics at index were compared among continuers, discontinuers, and switchers, and also at the time of first biologic DMARD switch between patients who switched to a non-TNFi biologic DMARD and those who switched to an alternative TNFi. These comparisons were performed pairwise, using t-tests for continuous measures and chi-squared tests for categorical measures.
Logistic regression was used to determine the probability of a patient continuing index TNFi treatment over 1 year. The set of predictors included demographic characteristics, RA severity, and healthcare resources.
A generalized linear model was used to assess cost, with treatment patterns as the predictor to assess unadjusted means; for adjusted means, the set of predictors also included demographic characteristics, RA severity, and healthcare resources. Cost data was assumed to be gamma distributed, and a log link for the mean was applied. An inverse link was applied to the resulting mean estimates, expressing differences in costs as percentage changes.
For the sub-group (the period that contained the secondary treatment pattern), the probability of the patient switching (to third-line treatment) was modeled with logistic regression using predictors analogous for the sub-group, e.g., type of secondary switch, applying a forward-selection procedure to the predictors, with type of secondary switch required to be in the post-switch logistic model. Post-switch costs were analyzed as a generalized linear model with the same set of predictor variables applied.
With respect to the regression analyses, if any of the predictor variables had missing values, where it was reasonable for a given predictor variable to treat missing values as a distinct category, it was done. Otherwise, missing values were ignored. A p-value of ≤0.05 was used to determine statistical significance.
Results
Index TNFi initiators
In total, 9567 patients with RA in the database newly initiated treatment with a TNFi (index TNFi) during the 2010–2013 period (Supplementary Table 1). Etanercept was the most commonly prescribed TNFi followed by adalimumab and infliximab (). Most patients were female (76.7%; n = 7341/9567), with mean (standard deviation [SD]) age of 53.9 (13.6) years, mean (SD) CCI score of 1.4 (1.0), and mean (SD) CIRAS score of 4.4 (1.9) ().
Figure 1. Proportion of patients initiating index TNFi treatment with etanercept, adalimumab, infliximab, golimumab, and certolizumab pegol.
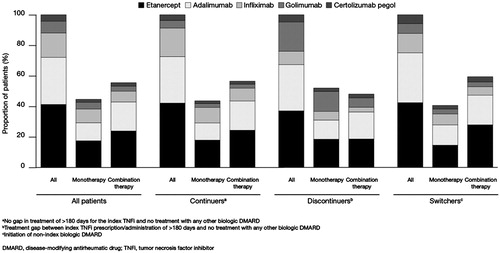
Table 1. Patient baseline characteristics.
TNFi treatment patterns in the 12-month period following index TNFi prescription
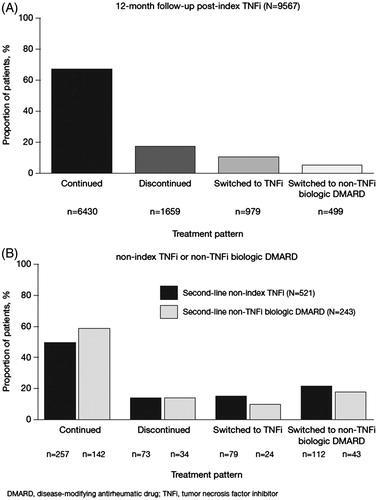
During the 12-month follow-up period, 67.2% (n = 6430/9567) of patients who initiated a TNFi were classified as continuers, 17.3% (n = 1659/9567) as discontinuers, and 15.4% (n = 1478/9567) as switchers (). Compared with continuers, discontinuers were older, and more likely to be female, with higher CCI scores, lower CIRAS scores, fewer pre-index csDMARD prescriptions and more pre-index hospitalizations. Compared with continuers, switchers were younger, and more likely to be female, with higher CIRAS scores, more days between earliest RA diagnosis observed or available and index TNFi, and more pre-index csDMARD prescriptions. There were also differences in plan type and location by treatment pattern (). Etanercept was the most commonly initiated index medication (41.2% [n = 3945/9567] overall, 42.1% [n = 2705/6430] for continuers, 37.0% [n = 614/1659] for discontinuers, and 42.4% [n = 626/1478] for switchers), followed by adalimumab (30.8% [n = 2948/9567] overall, 30.5% [n = 1962/6430] for continuers, 30.3% [n = 503/1659] for discontinuers, and 32.7% [n = 483/1478] for switchers). Continuers had the greatest proportion of infliximab initiators, while discontinuers and switchers had the greatest proportions of golimumab and certolizumab pegol initiators, respectively ().
Figure 2. Treatment patterns in the (A) 12-month post-index period for all patients and (B) 12-month post-switch period for all patients who switched to a second-line non-index TNFi or non-TNFi biologic DMARD in the 12-month post-index period.
The median (first quartile [Q1], third quartile [Q3]) time between the first and last prescription for the index TNFi was 357 (165, 360) days and varied with index treatment pattern, with the median (Q1, Q3) time-to-discontinuation being 82 (30, 115) days and median (Q1, Q3) time-to-switch 140 (74, 218) days. Approximately 2% (n = 198/9567) of patients overall and 10.5% (n = 174/1659) of discontinuers (i.e., gap >180 days) re-initiated the index TNFi in the 1-year follow-up.
A substantial proportion of patients (n = 4267/9567; 44.6%) initiated TNFi treatment without concomitant csDMARDs; a similar trend was observed across all index TNFi treatment patterns (). Of patients who initiated treatment with etanercept, adalimumab, infliximab, golimumab, and certolizumab pegol, 42.2% (n = 1664/3945), 38.4% (n = 1133/2948), 56.0% (n = 858/1533), 57.5% (n = 422/734), and 46.7% (n = 190/407), respectively, did so without concomitant administration of csDMARDs. Approximately 34% (n = 1441/4267) of patients who did not initiate concomitant csDMARDs had a csDMARD in the pre-index period, and most patients (83.1%; n = 3546/4267) who did not initiate TNFi treatment with concomitant csDMARDs also did not have a concomitant csDMARD at the last index TNFi in the 12-month follow-up period. Of those who initiated TNFi treatment with concomitant csDMARD, 28.9% (n = 1530/5300) were no longer taking a csDMARD at the time of last TNFi prescription/administration.
Table 2. Concomitant use of csDMARDs and time on treatment with index TNFi and post-switch biologic DMARDs.
In the logistic regression analysis (n = 9567), patients with greater RA severity (p < 0.0001), more days between earliest RA diagnosis observed or available and index TNFi (p = 0.0296), or more pre-index csDMARD prescriptions (p < 0.0001) were significantly less likely to continue treatment with the index TNFi. Initial concomitant csDMARD use was associated with an increase in the likelihood of continuing index TNFi treatment, but was not significant (odds ratio = 1.096).
Healthcare resource use and costs in the 12-month period following index TNFi prescription
All-cause total costs were highest for switchers (n = 1478), while continuers (n = 6430) had the highest pharmacy costs. Unadjusted 12-month mean (SD) all-cause total costs and pharmacy costs were $31,877 ($31,796) and $16,431 ($12,190) overall compared with $33,051 ($27,111) and $18,743 ($12,341) for continuers (n = 6430), $24,915 ($49,847) and $6563 ($6055) for discontinuers (n = 1659), and $34,585 ($22,174) and $17,446 ($11,164) for switchers (n = 1478), respectively. Unadjusted 12-month mean (SD) all-cause medical costs were $15,447 ($31,524) overall (n = 9567) and $14,308 ($27,205) for continuers (n = 6430), $18,352 ($48,932) for discontinuers (n = 1659), and $17,140 ($22,555) for switchers (n = 1478).
In multiple regression analysis (n = 9567), patients classified as continuers (n = 6430) and discontinuers (n = 1659) had significantly lower (−23.9% and −28.9%, respectively; p < 0.0001) all-cause costs compared with those classified as switchers (n = 1478). Also, patients with initial csDMARD use had higher all-cause costs (p < 0.0108). Older patients (p < 0.0001), patients with higher CCI (p < 0.0001), higher CIRAS (p = 0.0023), longer treatment on index TNFi (p < 0.0001), ≥1 in-patient admission pre-index (p < 0.0001), and those with an index date in 2012 (p = 0.0002) were more likely to have higher all-cause costs.
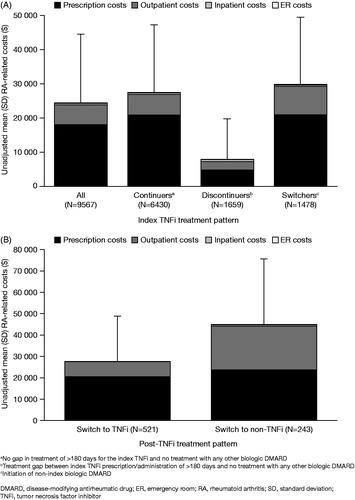
RA-related costs accounted for 76.3% of total overall costs (n = 9567) and 82.8%, 31.4%, and 85.7% of total costs for continuers (n = 6430), discontinuers (n = 1659), and switchers (n = 1478), respectively. Prescriptions accounted for 74.4% of the overall RA-related cost (unadjusted 12-month mean [SD] = $24,319 [$20,078]), with 23.6% due to outpatient visits, 2.1% due to inpatient visits, and 0.5% due to emergency department visits ().
Figure 3. Unadjusted mean (SD) RA-related costs in the 12-month period following index TNFi prescription (A) and in the 12-month period following switch from index TNFi (B).
In multiple regression analysis (n = 9567), patients classified as continuers (n = 6430) and discontinuers (n = 1659) had significantly lower (−54.7% and −68.3%, respectively; p < 0.0001) RA-related costs compared with those classified as switchers (n = 1478). Older patients (p = 0.0067), male patients (p = 0.0021), patients with greater RA severity (p = 0.0005), patients with more days between earliest RA diagnosis observed or available and index TNFi (p < 0.0001), patients with longer treatment on index TNFi (p < 0.0001), and those with index date in 2012 (p = 0.0222) were more likely to have higher RA-related costs. Although not statistically significant, patients with initial csDMARD use tended to have lower costs.
Treatment patterns in the 12-month period following switch from index TNFi to an alternative biologic DMARD
Among the 1478 patients who switched from index TNFi, 781 had 12 months continuous enrollment post-switch. Of these patients, 764 switched to an alternative biologic DMARD ≤180 days following last index TNFi prescription/administration, 68.2% (n = 521/764) switched to an alternative TNFi, and 31.8% (n = 243/764) switched to a non-TNFi biologic DMARD (). Another 17 patients switched to an alternative biologic DMARD (n = 9 to non-TNFi biologic DMARDs) after >180-day gap (not reported in this analysis). Among the 764 switchers, there were a few differences between TNFi and non-TNFi biologic DMARD users. Non-TNFi biologic DMARD switchers were older, with higher CCI scores but lower CIRAS scores and more pre-index csDMARD use compared with non-index TNFi initiators (). A substantial proportion of patients who switched to a non-index TNFi (59.9%; n = 312/521) or non-TNFi biologic DMARD (52.3%; n = 127/243) received concomitant csDMARDs (). Among those who initiated a second-line biologic DMARD with a csDMARD (n = 439), a greater proportion of non-index TNFi switchers (46.8%; n = 244/521) had a csDMARD at the last prescription/administration vs non-TNFi biologic DMARD switchers (35.8%; n = 87/243). Of those who did not initiate concomitant csDMARDs (n = 325), a greater proportion of non-TNFi biologic DMARD switchers (41.6%; n = 101/243) did not have a csDMARD at the last prescription/administration vs non-index TNFi switchers (31.7%; n = 165/521) ().
Overall, there was no difference in the proportion of patients who discontinued second-line biologic DMARD therapy (non-index TNFi switchers: 14.0% [n = 73/521]; non-TNFi biologic DMARD switchers: 14.0% [n = 34/243]). Of patients who switched from index TNFi to an alternative TNFi (n = 521), 36.7% (n = 191) switched again (to a third biologic DMARD) during the 12-month follow-up compared with 27.6% (n = 67/243) of patients who switched from index TNFi to a non-TNFi biologic DMARD (p = 0.0313).
Among patients who switched to a second-line alternative TNFi (n = 521), the most common third-line biologic DMARDs abatacept (43.5%; n = 83/191), certolizumab pegol (9.9%; n = 19/191), and infliximab (9.9%; n = 19/191) compared with tocilizumab (28.4%; n = 19/67), abatacept (17.9%; n = 12/67), and rituximab (16.4%; n = 11/67) for those who switched to second-line non-TNFi biologic DMARDs. Of those patients who switched from the index TNFi biologic DMARD to another biologic DMARD within 90 days (n = 216), 31.9% (n = 52/163) subsequently switched again from a second TNFi vs 17.0% (n = 9/53) from a non-TNFi biologic DMARD (p = 0.0396).
Healthcare resource use and costs in the 12-month period following switch from index TNFi to an alternative TNFi or non-TNFi biologic DMARD
Unadjusted 12-month mean (SD) all-cause total costs and pharmacy costs for those switching to alternative TNFi (n = 521) were $50,689 ($43,516) and $34,424 ($22,047), respectively, compared with $76,580 ($70,798) and $42,648 ($35,629), respectively, for those switching to non-TNFi biologic DMARD (n = 243). All-cause medical costs were $16,265 ($23,185) for those switching to alternative TNFi (n = 521) and $33,932 ($36,189) for those switching to non-TNFi biologic DMARD (n = 243).
In multiple regression analysis among patients who switched (n = 764), total all-cause costs in adjusted analyses were 17.5% higher for patients who switched to a non-TNFi biologic DMARD (n = 521) compared with those who switched to an alternative TNFi (n = 243), although not statistically significant (p = 0.0907). Patients classified as discontinuers (n = 107/764) had significantly lower (−43.0%; p < 0.0001) total all-cause costs compared with those classified as switchers (n = 258/764). In contrast, costs for continuers (n = 399/764) were not significantly different from switchers (n = 258/764). Also, the specialty of the physician prescribing the switch medication was a significant effect, but the result may be driven by the categories of ‘other non-physician’ and ‘missing’, each relative to rheumatologists.
RA-related costs were also higher for patients switching to non-TNFi biologic DMARDs (n = 521). Unadjusted mean (SD) RA-related costs in the 12-month period post-switch were $27,544 ($21,100) for patients who switched to alternative TNFi (n = 521) vs $44,742 ($30,743) for those who switched to a non-TNFi biologic DMARD (n = 243) (). Most of the mean RA-related cost difference was attributed to outpatient biologic-administration visits (78.8%; −$14,205), followed by prescriptions (18.1%; −$3267), and inpatient visits (3.1%; −$562). Biologic-administration visits accounted for 89.3% ($12,682) of the greater RA-related outpatient costs associated with patients who switched to non-TNFi biologic DMARD (n = 243) compared with patients who switched to alternative TNFi (n = 521).
In multiple regression analysis among patients who switched (n = 764), total RA-related costs in adjusted analyses were 37.2% higher for patients who switched to a non-TNFi biologic DMARD (n = 243) compared with those who switched to an alternative TNFi (n = 521) (p = 0.0010). Patients classified as continuers (n = 399/764) and discontinuers (n = 107/764) had significantly lower (−34.0% and −65.3%, respectively; p = 0.0052 and p < 0.0001, respectively) RA-related costs compared with those classified as switchers (n = 258/764). Also, the specialty of the physician prescribing the switch medication was a significant factor, but the result is being driven by the categories of ‘other non-physicians’ and ‘missing’, each relative to rheumatologists. In a model parameterization using etanercept as a reference, RA-related costs for those who switched from a TNFi were significantly higher (p < 0.05 for all) for infliximab (94.1% higher than etanercept; n = 49/764, rituximab (184.0% higher than etanercept; n = 40/764), abatacept (53.8% higher than etanercept; n = 150/764), and tocilizumab (82.9% higher than etanercept; n = 52/764). RA-related costs for the other biologic DMARD comparators were not significant relative to etanercept.
Discussion
TNF-α inhibitors have transformed the management of RA since their introduction. The purpose of this analysis was to evaluate overall TNFi treatment patterns from 2010–2013, as well as the associated HCRU and costs in a US claims database. This analysis did not evaluate the evolution of TNFi use throughout time from the date of approval; therefore, comparisons should be interpreted in the context of the 3–4-year study period presented in this analysis and not extrapolated back to the date of approval.
The data reported in this real-world analysis indicate a TNFi continuation rate of 67.2% and a combined discontinuation and switching rate of 32.8%, consistent with the rates reported in a prospective cohort study from a single-center US RA populationCitation31. Other retrospective claims-based studies have found similar TNFi discontinuation and switching rates: a TNFi persistence study found 32–55% of patients switched or discontinued first TNFi treatment within 1 year (based on >30-day treatment gap or initiation of new TNFi)Citation32; and a dosage adjustment study found 39–45% of patients discontinued first TNFi treatment during 6 years of follow-up (based on >60-day treatment gap)Citation33. Thus, although we used a 180-day gap between prescriptions and administrations, we found consistent estimates of discontinuation/switching.
Patients with greater RA severity, more days between earliest diagnosis observed or available and index TNFi, or more pre-index csDMARD prescriptions were significantly less likely to continue treatment with the index TNFi. In the study by Agarwal et al.Citation31, a higher risk of TNFi discontinuation was reported among patients with prior use of another TNFi, whereas longer disease duration, prior use of csDMARDs, and longer cumulative MTX use were associated with a lower risk of TNFi discontinuation. In contrast with our analysis, the Agarwal et al. study used patient reported discontinuation, approximately two-thirds of the treated patients (with etanercept, adalimumab, or infliximab only) were prevalent cases, and the analyses included a broader range of predictors, including disease activity measures. In addition, changes in treatment practices since the Agarwal et al. study was carried out in 2008 mean that new patients may tend to be more closely and aggressively followed-up today. The inclusion of both new users (incident users) and patients already taking a TNFi (prevalent users) in the Agarwal et al. study could have affected the predictors identified, since the prevalent users may be biased toward a group of patients who are doing well with TNFi treatment.
While associated with the lowest overall costs in this analysis, patients who discontinued from the index TNFi appeared to have the highest CCI scores, pre-index prevalence of all-cause hospital admission, and post-index all-cause medical costs, suggesting the importance of also addressing co-morbidities in this patient cohort. Also, less than half of discontinuers had any DMARD medication in the post-discontinuation period. This may highlight a significant treatment gap for which clinical outcomes data would be helpful in understanding the detriments in the lack of DMARD therapy. This gap is recognized in quality performance indicators for RA, such as those developed by the National Quality Forum, which includes a measure on the proportion of patients using DMARD therapy. Further, ∼10% of discontinuers in our analysis re-initiated their index TNFi after a gap >180 days following last index TNFi prescription/administration, suggesting patients may require initiation of treatment at a later time; however, this analysis did not follow discontinuers beyond 1 year nor look at outcomes post-re-initiation of a TNFi. Further, the median time on-treatment amongst discontinuers in our analysis was <90 days, suggesting potential primary non-response in some patients. Although it is difficult to discern primary non-response in claims data, it is interesting to note that, in the analysis of patients who switched within 90 days of initiating index TNFi, those who switched to another TNFi (cycles) had a significantly higher risk of switching again compared with those who switched to a non-TNFi and compared with those who switched to a second biologic DMARD at any time during the 1-year post-switch follow-up.
Patients who switched from index TNFi to an alternative biologic DMARD had significantly increased RA-related costs compared with index TNFi non-switchers. As the total RA-related costs of first-line TNFi treatment are driven by DMARD prescription costs, those who discontinued TNFi had lowest costs. The cost differences between patients who switched and those who continued TNFi appear to be driven by outpatient costs. Although not evaluated in this study, dose escalation may be another reason for high costs, particularly for adalimumab and infliximabCitation34–40. The average daily dose for the first prescription of adalimumab in our analysis was 3.13 mg, 3.25 mg, and 2.83 mg for continuers, discontinuers, and switchers, respectively. There was a respective 5.1%, 1.9%, and 11.3% increase in the daily dose for the last index prescription for adalimumab, suggesting this may be an area for future research as related to the treatment patterns, particularly switching.
Furthermore, upon switching, higher costs were observed in patients who switched to a non-TNFi biologic DMARD from a TNFi vs switching amongst TNFi, which appeared to be driven by in-office biologic administration costs. This was further highlighted by the significantly higher RA-related costs with largely infusible (during study period) non-TNFi biologic DMARDs (abatacept, rituximab, tocilizumab) as well as infliximab relative to etanercept after switching from a TNFi. However, patients who switched to a non-TNFi biologic DMARD from a TNFi were significantly less likely to switch to a third biologic DMARD than those switching to an alternative TNFi. Another analysis suggested similar findings in a Medicare cohort comparing abatacept with select TNFi in prior TNFi users and indicated lower odds of subsequent biologic DMARD switching with abataceptCitation41. Discontinuation or changes in treatment are often attributable to lack of efficacy (28–41% of patients with RA who receive TNFi fail to achieve 20% improvement in ACR criteria)Citation31, and additional patients experience reduced efficacy or increased AEs throughout time, which could influence choice or effectiveness of subsequent therapyCitation42–44. TNFi may prove ineffective in some patients due to variations in pathophysiological response or differences in the dominant cytokine mediating the disease processCitation45.
In this analysis, a substantial proportion of patients (44.6%) initially received TNFi treatment without concomitant csDMARDs. Inferior efficacy outcomes are generally observed in patients who receive TNFi without concomitant csDMARDsCitation46–48. The effect of concomitant csDMARDs (primarily MTX) on TNFi continuation rates has been examined in several studies, with results suggesting enhanced persistence for TNFi therapies when administered in combination with csDMARDsCitation49–54. Although our adjusted analyses suggested a higher likelihood of continuing TNFi and lower RA-related costs with concomitant csDMARD use, these findings were non-significant. Further, among those who started concomitant csDMARDs, 28.9% did not have a csDMARD at last prescription/administration. This data-set does not allow an evaluation of the reasons (e.g., safety, personal preference, cost), and a recent systematic review found wide variability in adherence/persistence and their measurement, reflecting the complexity in assessing this aspect of treatmentCitation55. Future evaluation is warranted to inform understanding of treatment selection.
The analyses reported here provide an illustration of initial TNFi and subsequent biologic DMARD utilization in patients with RA during a time when various treatment options exist beyond those available just 5 years ago; however, like all claims database-based analyses, several limitations must be considered. Claims are collected for payment purposes only and are, therefore, limited in the degree to which they represent the true medical history of a patient. While we rely on enrollment data to create a baseline period, expanding beyond 6 months may be warranted. As such, we attempted to create a proxy for duration of RA using time between the earliest RA diagnosis observed or available and initiation of index TNFi. However, this information may not be available for all patients given varying enrollment history and, even with extended enrollment requirements, the information may not be complete. Patient and/or physician documentation of disease duration may be necessary and, thus, the findings reported here should be interpreted with caution. Furthermore, bias introduced by algorithms for treatment allocation can impact decision-making and may artificially channel physicians towards prescribing a given therapy, which may vary by plan. Patients were not randomly assigned to therapy, and factors affecting the selection of therapy or the choice to receive subsequent biologic DMARD therapy could have led to selection bias. Variation in individual physician clinical practice could not be accounted for in this study. Reasons for treatment change were not captured in the claims database and were, therefore, unavailable for analysis. Coding errors in the claim database could affect the ability to detect all relevant HCRU. Furthermore, the fact that tofacitinib was not approved in the US until the end of the study period (November 2012)Citation56 should be taken into consideration. The analyses reported here may also not fully reflect the current use of subcutaneous abatacept and tocilizumab, which were approved in July 2011Citation57 and October 2013Citation58, respectively.
Conclusions
Real-world TNFi discontinuation and/or switching rates correspond to reported randomized controlled trial non-response rates. TNFi cycling is common and was found to be associated with increased likelihood of switching to a third biologic DMARD. However, switching to non-TNFi biologic DMARDs was associated with higher costs, which were mostly attributed to in-office administrations.
Transparency
Declaration of funding
This study was funded by Pfizer Inc.
Declaration of financial/other relationships
JH, DW, RG, DG, AK, and JB are employees of Pfizer Inc. JME peer reviewers on this manuscript have no relevant financial or other relationships to disclose.
Supplementary_Table_1.docx
Download MS Word (14.1 KB)Acknowledgments
Medical writing support, under the direction of the authors, was provided by Amanda Pedder of Complete Medical Communications and funded by Pfizer Inc.
Related Research Data
References
- Silman AJ, Pearson JE. Epidemiology and genetics of rheumatoid arthritis. Arthritis Res 2002;4(Suppl 3):S265-72
- Scott DL, Wolfe F, Huizinga TW. Rheumatoid arthritis. Lancet 2010;376:1094-108
- Cardarelli WJ. Implications for managed care and specialty pharmacy in rheumatoid arthritis. Am J Manag Care 2012;18:S315-24
- Kleinman NL, Cifaldi MA, Smeeding JE, et al. Annual incremental health benefit costs and absenteeism among employees with and without rheumatoid arthritis. J Occup Environ Med 2013;55:240-4
- Singh JA, Furst DE, Bharat A, et al. 2012 update of the 2008 American College of Rheumatology recommendations for the use of disease-modifying antirheumatic drugs and biologic agents in the treatment of rheumatoid arthritis. Arthritis Care Res (Hoboken) 2012;64:625-39
- Smolen JS, Landewe R, Breedveld FC, et al. EULAR recommendations for the management of rheumatoid arthritis with synthetic and biological disease-modifying antirheumatic drugs: 2013 update. Ann Rheum Dis 2014;73:492-509
- Li P, Blum MA, Von FJ, et al. Adherence, discontinuation, and switching of biologic therapies in medicaid enrollees with rheumatoid arthritis. Value Health 2010;13:805-12
- Bonafede M, Fox KM, Watson C, et al. Treatment patterns in the first year after initiating tumor necrosis factor blockers in real-world settings. Adv Ther 2012;29:664-74
- Yeaw J, Watson C, Fox KM, et al. Treatment patterns following discontinuation of adalimumab, etanercept, and infliximab in a US managed care sample. Adv Ther 2014;31:410-25
- Harrold LR, Reed GW, Kremer JM, et al. The comparative effectiveness of abatacept versus anti-tumour necrosis factor switching for rheumatoid arthritis patients previously treated with an anti-tumour necrosis factor. Ann Rheum Dis 2015;74:430-6
- Rendas-Baum R, Wallenstein GV, Koncz T, et al. Evaluating the efficacy of sequential biologic therapies for rheumatoid arthritis patients with an inadequate response to tumor necrosis factor-alpha inhibitors. Arthritis Res Ther 2011;13:R25
- Kim HL, Lee MY, Park SY, et al. Comparative effectiveness of cycling of tumor necrosis factor-alpha (TNF-alpha) inhibitors versus switching to non-TNF biologics in rheumatoid arthritis patients with inadequate response to TNF-alpha inhibitor using a Bayesian approach. Arch Pharm Res 2014;37:662-70
- Bartelds GM, Wijbrandts CA, Nurmohamed MT, et al. Anti-infliximab and anti-adalimumab antibodies in relation to response to adalimumab in infliximab switchers and anti-tumour necrosis factor naive patients: a cohort study. Ann Rheum Dis 2010;69:817-21
- Krieckaert CL, Nurmohamed MT, Wolbink GJ. Methotrexate reduces immunogenicity in adalimumab treated rheumatoid arthritis patients in a dose dependent manner. Ann Rheum Dis 2012;71:1914-15
- Burmester GR, Kivitz AJ, Kupper H, et al. Efficacy and safety of ascending methotrexate dose in combination with adalimumab: the randomised CONCERTO trial. Ann Rheum Dis 2015;74:1037-44
- Maini RN, Breedveld FC, Kalden JR, et al. Therapeutic efficacy of multiple intravenous infusions of anti-tumor necrosis factor alpha monoclonal antibody combined with low-dose weekly methotrexate in rheumatoid arthritis. Arthritis Rheum 1998;41:1552-63
- Soliman MM, Ashcroft DM, Watson KD, et al. Impact of concomitant use of DMARDs on the persistence with anti-TNF therapies in patients with rheumatoid arthritis: results from the British Society for Rheumatology Biologics Register. Ann Rheum Dis 2011;70:583-9
- Meissner B, Trivedi D, You M, et al. Switching of biologic disease modifying anti-rheumatic drugs in patients with rheumatoid arthritis in a real world setting. J Med Econ 2014;17:259-65
- Curkendall S, Patel V, Gleeson M, et al. Compliance with biologic therapies for rheumatoid arthritis: do patient out-of-pocket payments matter? Arthritis Rheum 2008;59:1519-26
- Borah BJ, Huang X, Zarotsky V, et al. Trends in RA patients' adherence to subcutaneous anti-TNF therapies and costs. Curr Med Res Opin 2009;25:1365-77
- Blume SW, Fox KM, Joseph G, et al. Tumor necrosis factor-blocker dose escalation in rheumatoid arthritis patients in a pharmacy benefit management setting. Adv Ther 2013;30:517-27
- Schabert VF, Watson C, Joseph GJ, et al. Costs of tumor necrosis factor blockers per treated patient using real-world drug data in a managed care population. J Manag Care Pharm 2013;19:621-30
- Bonafede M, Joseph GJ, Shah N, et al. Cost of tumor necrosis factor blockers per patient with rheumatoid arthritis in a multistate Medicaid population. Clinicoecon Outcomes Res 2014;6:381-8
- Curtis JR, Schabert VF, Yeaw J, et al. Use of a validated algorithm to estimate the annual cost of effective biologic treatment for rheumatoid arthritis. J Med Econ 2014;17:555-66
- Ogale S, Hitraya E, Henk HJ. Patterns of biologic agent utilization among patients with rheumatoid arthritis: a retrospective cohort study. BMC Musculoskelet Disord 2011;12:204
- Mueller CS, Wade S, Song X, et al. Calculation of annual biologic treatment costs in rheumatoid arthritis: a comparison of methods and relationship to adherence. J Manag Care Spec Pharm 2012;18:164
- Fisher A, Bassett K, Wright JM, et al. Comparative persistence of the TNF antagonists in rheumatoid arthritis–a population-based cohort study. PLoS One 2014;9:e105193
- Fisher A, Bassett K, Wright JM, et al. Prescriber preference for a particular tumour necrosis factor antagonist drug and treatment discontinuation: population-based cohort. BMJ Open 2014;4:e005532
- Charlson ME, Pompei P, Ales KL, et al. A new method of classifying prognostic comorbidity in longitudinal studies: development and validation. J Chronic Dis 1987;40:373-83
- Ting G, Schneeweiss S, Scranton R, et al. Development of a health care utilisation data-based index for rheumatoid arthritis severity: a preliminary study. Arthritis Res Ther 2008;10:R95
- Agarwal SK, Glass RJ, Shadick NA, et al. Predictors of discontinuation of tumor necrosis factor inhibitors in patients with rheumatoid arthritis. J Rheumatol 2008;35:1737-44
- Yazici Y, Krasnokutsky S, Barnes JP, et al. Changing patterns of tumor necrosis factor inhibitor use in 9074 patients with rheumatoid arthritis. J Rheumatol 2009;36:907-13
- Wu E, Chen L, Birnbaum H, et al. Retrospective claims data analysis of dosage adjustment patterns of TNF antagonists among patients with rheumatoid arthritis. Curr Med Res Opin 2008;24:2229-40
- Gilbert TD, Jr, Smith D, Ollendorf DA. Patterns of use, dosing, and economic impact of biologic agent use in patients with rheumatoid arthritis: a retrospective cohort study. BMC Musculoskelet Disord 2004;5:36
- Ollendorf DA, Massarotti E, Birbara C, et al. Frequency, predictors, and economic impact of upward dose adjustment of infliximab in managed care patients with rheumatoid arthritis. J Manag Care Pharm 2005;11:383-93
- Nair KV, Tang B, Van Den BJ, et al. Categorization of infliximab dose changes and healthcare utilization and expenditures for patients with rheumatoid arthritis in commercially insured and Medicare-eligible populations. Curr Med Res Opin 2009;25:303-14
- Gu NY, Huang X, Fox KM, et al. Claims data analysis of dosing and cost of TNF antagonist. Am J Pharm Benefits 2010;2:351-9
- Harrison DJ, Huang X, Globe D. Dosing patterns and costs of tumor necrosis factor inhibitor use for rheumatoid arthritis. Am J Health Syst Pharm 2010;67:1281-7
- Moots RJ, Haraoui B, Matucci-Cerinic M, et al. Differences in biologic dose-escalation, non-biologic and steroid intensification among three anti-TNF agents: evidence from clinical practice. Clin Exp Rheumatol 2011;29:26-34
- Moots RJ, Mays R, Stephens J, et al. Burden of dose escalation with tumour necrosis factor inhibitors in rheumatoid arthritis: a systematic review of frequency and costs. Clin Exp Rheumatol 2015;33:737-45
- Rosenblatt L, Lobo F, Cockrum P, et al. Biologic switching rates among patients with rheumatoid arthritis. Arthritis Rheum 2013;65:S998
- Karlsson JA, Kristensen LE, Kapetanovic MC, et al. Treatment response to a second or third TNF-inhibitor in RA: results from the South Swedish Arthritis Treatment Group Register. Rheumatology (Oxford) 2008;47:507-13
- Hyrich KL, Lunt M, Watson KD, et al. Outcomes after switching from one anti-tumor necrosis factor alpha agent to a second anti-tumor necrosis factor alpha agent in patients with rheumatoid arthritis: results from a large UK national cohort study. Arthritis Rheum 2007;56:13-20
- Finckh A, Ciurea A, Brulhart L, et al. Which subgroup of rheumatoid arthritis patients benefits from switching to rituximab versus alternative anti-TNF agents after previous failure to anti-TNF agent? Ann Rheum Dis 2010;69:387-93
- van Vollenhoven RF. Switching between anti-tumour necrosis factors: trying to get a handle on a complex issue. Ann Rheum Dis 2007;66:849-51
- Emery P, Sebba A, Huizinga TW. Biologic and oral disease-modifying antirheumatic drug monotherapy in rheumatoid arthritis. Ann Rheum Dis 2013;72:1897-904
- Scott DL, Ibrahim F, Farewell V, et al. Tumour necrosis factor inhibitors versus combination intensive therapy with conventional disease modifying anti-rheumatic drugs in established rheumatoid arthritis: TACIT non-inferiority randomised controlled trial. BMJ 2015;350:h1046
- Jansen JP, Buckley F, Dejonckheere F, et al. Comparative efficacy of biologics as monotherapy and in combination with methotrexate on patient reported outcomes (PROs) in rheumatoid arthritis patients with an inadequate response to conventional DMARDs - a systematic review and network meta-analysis. Health Qual Life Outcomes 2014;12:102
- Finckh A, Dehler S, Gabay C. The effectiveness of leflunomide as a co-therapy of tumour necrosis factor inhibitors in rheumatoid arthritis: a population-based study. Ann Rheum Dis 2009;68:33-9
- Heiberg MS, Koldingsnes W, Mikkelsen K, et al. The comparative one-year performance of anti-tumor necrosis factor alpha drugs in patients with rheumatoid arthritis, psoriatic arthritis, and ankylosing spondylitis: results from a longitudinal, observational, multicenter study. Arthritis Rheum 2008;59:234-40
- Kristensen LE, Saxne T, Nilsson JA, et al. Impact of concomitant DMARD therapy on adherence to treatment with etanercept and infliximab in rheumatoid arthritis. Results from a six-year observational study in southern Sweden. Arthritis Res Ther 2006;8:R174
- Ostergaard M, Unkerskov J, Linde L, et al. Low remission rates but long drug survival in rheumatoid arthritis patients treated with infliximab or etanercept: results from the nationwide Danish DANBIO database. Scand J Rheumatol 2007;36:151-4
- Tang B, Rahman M, Waters HC, et al. Treatment persistence with adalimumab, etanercept, or infliximab in combination with methotrexate and the effects on health care costs in patients with rheumatoid arthritis. Clin Ther 2008;30:1375-84
- Zink A, Listing J, Kary S, et al. Treatment continuation in patients receiving biological agents or conventional DMARD therapy. Ann Rheum Dis 2005;64:1274-9
- Lopez-Garcia R, Leon L, Loza E, et al. Adherence to biologic therapies and associated factors in rheumatoid arthritis, spondyloarthritis and psoriatic arthritis: a systematic literature review. Clin Exp Rheumatol. 2015;33:559–69
- US Food and Drug Administration. XELJANZ® (tofacitinib) tablets for oral administration, highlights of prescribing information. 2012. http://www.accessdata.fda.gov/drugsatfda_docs/label/2012/203214s000lbl.pdf. Accessed May 1, 2013
- US Food and Drug Administration. Orencia® (abatacept): highlights of prescribing information. 2011. http://www.accessdata.fda.gov/drugsatfda_docs/label/2012/125118s0138lbl.pdf. Accessed August 19, 2015
- US Food and Drug Administration. ACTEMRA® (tocilizumab): highlights of prescribing information. 2013. http://www.accessdata.fda.gov/drugsatfda_docs/label/2013/125276s092lbl.pdf. Accessed August 31, 2015