
Abstract
Objective:
To conduct a cost-effectiveness assessment of lenalidomide plus dexamethasone (Rd) vs bortezomib plus melphalan and prednisone (VMP) as initial treatment for transplant-ineligible patients with newly-diagnosed multiple myeloma (MM), from a US payer perspective.
Methods:
A partitioned survival model was developed to estimate expected life-years (LYs), quality-adjusted LYs (QALYs), direct costs and incremental costs per QALY and LY gained associated with use of Rd vs VMP over a patient’s lifetime. Information on the efficacy and safety of Rd and VMP was based on data from multinational phase III clinical trials and a network meta-analysis. Pre-progression direct costs included the costs of Rd and VMP, treatment of adverse events (including prophylaxis) and routine care and monitoring associated with MM. Post-progression direct costs included costs of subsequent treatment(s) and routine care and monitoring for progressive disease, all obtained from published literature and estimated from a US payer perspective. Utilities were obtained from the aforementioned trials. Costs and outcomes were discounted at 3% annually.
Results:
Relative to VMP, use of Rd was expected to result in an additional 2.22 LYs and 1.47 QALYs (discounted). Patients initiated with Rd were expected to incur an additional $78,977 in mean lifetime direct costs (discounted) vs those initiated with VMP. The incremental costs per QALY and per LY gained with Rd vs VMP were $53,826 and $35,552, respectively. In sensitivity analyses, results were found to be most sensitive to differences in survival associated with Rd vs VMP, the cost of lenalidomide and the discount rate applied to effectiveness outcomes.
Conclusions:
Rd was expected to result in greater LYs and QALYs compared with VMP, with similar overall costs per LY for each regimen. Results of this analysis indicated that Rd may be a cost-effective alternative to VMP as initial treatment for transplant-ineligible patients with MM, with an incremental cost-effectiveness ratio well within the levels for recent advancements in oncology.
Introduction
Multiple myeloma (MM) is a malignant neoplasm that causes plasma cell accumulation in the bone marrow, eventually leading to bone destruction and marrow failureCitation1. According to the American Cancer Society, ∼26,850 persons were newly diagnosed with MM in the US in 2014Citation2, representing ∼1.4% of incident cases of all cancerCitation3. MM is most frequently diagnosed among patients aged 65–74 years, with a median age at diagnosis of 69 yearsCitation3. Over the last decade, substantial improvements in survival outcomes have been achievedCitation4,Citation5. Today, overall 5-year survival is over 50%Citation3,Citation6. This increase in survival has been largely attributed to the use of newer treatment options, including lenalidomide, bortezomib, and thalidomideCitation6.
Initial treatment recommendations for newly-diagnosed MM often include induction therapy with novel agents with or without chemotherapy, followed by autologous stem cell transplant (ASCT). However, a substantial number of patients from the US do not receive ASCT as part of their initial treatment due to patient/physician choice or because they are deemed ineligible for ASCT because of age or other reasons (e.g., considerable cardiac, pulmonary, renal, and/or hepatic dysfunction)Citation7. The 2016 guidelines from the National Comprehensive Cancer Network (NCCN) for previously untreated, ASCT-ineligible patients include lenalidomide plus low-dose dexamethasone until disease progression (Rd) and bortezomib, melphalan, and prednisone (VMP) as ‘category 1’ therapy options, which indicate NCCN consensus, based on high-level evidence, that either intervention is appropriateCitation1. (Melphalan, prednisone, and lenalidomide [MPL or MPR] and melphalan, prednisone, and thalidomide [MPT] also are listed as category 1 therapy optionsCitation1.)
Lenalidomide and bortezomib are two of the most commonly used agents for initial treatment of MM in the USCitation6. The efficacy and safety of Rd as a first-line therapy for ASCT-ineligible patients were demonstrated in the Frontline Investigation of Revlimid and Dexamethasone Versus Standard Thalidomide (FIRST) study. Results of this study showed that continuous treatment with Rd significantly improved progression-free survival (PFS; hazard ratio [HR] = 0.72; p = 0.00006) and provided an overall survival (OS) benefit at interim analysis (HR = 0.70; p = 0.01685) vs fixed duration of MPT in transplant-ineligible patientsCitation8. The efficacy and safety of VMP were established in the Velcade as Initial Standard Therapy in Multiple Myeloma (VISTA) study. Median time to progression and PFS were significantly longer for patients treated with VMP than patients treated with melphalan plus prednisone (MP). At the time final survival analyses were conducted (median follow-up = 60.1 months), a total of 49% of patients treated with VMP were alive vs 38% of patients treated with MP (HR = 0.695; p < 0.001); median OS was 56.4 months for patients treated with VMP vs 43.1 months for patients treated with MPCitation9.
While the FIRST and VISTA studies have demonstrated the efficacy and safety of Rd and VMP and the potential for these two regimens to prolong survival, no randomized trials have been undertaken to directly compare Rd with VMP. A recent meta-analysis suggested that OS associated with VMP was equivalent to that of MPTCitation10. This equivalence was also assumed in a previous cost-effectiveness analysis of bortezomib and thalidomideCitation11. Given that FIRST demonstrated a favorable HR for survival for Rd relative to MPTCitation8, results of the meta-analysis may suggest a possible advantage for Rd relative to VMP in terms of OS. This presumed survival benefit is likely to be associated with higher lifetime cost due to the longer survival of patients, as well as longer initial treatment duration, given that Rd is intended to be administered continuously until death or disease progression. Accordingly, the degree to which use of continuous Rd in lieu of fixed duration VMP is cost-effective is unknown. A decision-analytic model was developed to undertake a comparative cost-effectiveness assessment of continuous treatment with Rd vs fixed-duration VMP as first-line treatment for transplant-ineligible patients with MM, from a US payer perspective.
Patients and methods
Model description
A partitioned survival model was developed to examine the cost-effectiveness of Rd vs VMP. As with Markov state transition models, partitioned survival models characterize the condition of interest in terms of mutually exclusive health states. However, unlike Markov models, partitioned survival models do not require explicit calculation or use of transition probabilities, but rather estimate time spent in various health states based on area under the curve methodology. Our model consisted of three health states: (1) PFS; (2) post-progression survival (PPS); and (3) dead. The proportion of patients in each of these health states over time was estimated using survival functions for PFS and OS; PPS was estimated by subtracting PFS from OS. Expected life-years (LYs) were estimated as the area under the OS curve. Outcomes of interest generated by the model included expected lifetime total direct costs and total LYs and quality-adjusted life-years (QALYs). The cost-effectiveness of Rd vs VMP was estimated by dividing the difference in expected total direct costs by the corresponding difference in effectiveness (i.e., LYs or QALYs). The model was programmed in Microsoft Excel 2007.
Model parameters and data sources
Regimens
Consistent with FIRST, Rd consisted of lenalidomide (25 mg or adjusted according renal function) on days 1–21 of every 28-day cycle plus dexamethasone (40 mg or 20 mg/day according to age ≤75 years or >75 years, respectively) on days 1, 8, 15, and 22 of every 28-day cycleCitation8. Use of Rd was modeled based on actual utilization observed in FIRST, which allowed the model to account for early discontinuation of therapy (i.e., discontinuation prior to disease progression or death) as well as missed doses treatment holidays taken by the patient. Additional treatment cut-offs included death, evidence of disease progression, or a maximum of 6 years of treatment, whichever occurred first. Consistent with the VISTA study, VMP consisted of single-use vials of bortezomib (1.3 mg/m2) for 8 days of each of the first four 6-week cycles and on days 1, 8, 22, and 29 of each subsequent 6-week cycle up to a maximum of 10 total cycles (while the original VISTA publication described intended treatment for a maximum of nine 6-week cyclesCitation12, a subsequent report indicated that patients were allowed to continue VMP beyond that timeCitation13) plus melphalan (9 mg/m2) and prednisone (60 mg/m2) on days 1–4 of each 6-week cycle. The post-progression choice of therapies was assumed to be conditional on the initial treatment received, consistent with information reported in the FIRST and VISTA studiesCitation8,Citation12,Citation13, as well as previous cost-effectiveness assessments in this therapeutic areaCitation11,Citation14.
PFS and OS
In the absence of randomized studies that compare Rd to VMP as initial therapy for transplant-ineligible patients with MM, an evidence network between the two studies (i.e., FIRST for Rd, VISTA for VMP) was developed using MPT (a comparator in FIRST) and MP (a comparator in VISTA; )Citation15. Linkage between MPT and MP was based on three studies—Intergroupe Francophone du Myélome (IFM) 99-06, IFM 01-01, and Sacchi et al.Citation16—that included dose and duration of MPT similar to those used in FIRSTCitation16–18.
Figure 1. Evidence network of selected regimens for newly-diagnosed multiple myeloma.
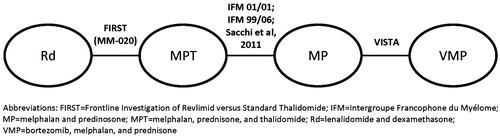
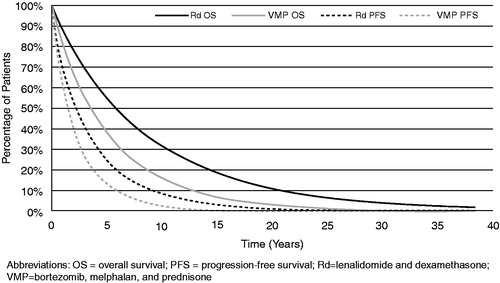
Parametric proportional hazards models were used to estimate the necessary survival functions. Specifically, patient-level data from FIRST were used to derive a number of different parameterized PFS and OS functions for Rd. The best fit to the empirical data reported in FIRST was obtained using a Weibull distribution (). Using the evidence network, a network meta-analysis (NMA) was used to estimate the HR for PFS and OS associated with Rd vs VMP. The PFS and OS functions for VMP were then estimated by applying the HRs to the corresponding Rd curves. The HRs for PFS and OS for Rd vs VMP obtained through the NMA were 0.69 (95% CI = 0.49–0.98) and 0.63 (95% CI = 0.44–0.92), respectivelyCitation15. The fitted Weibull distributions for Rd PFS and OS and those for VMP obtained by applying HRs over a lifetime are presented in .
Figure 2. Progression-free survival and overall survival parametric distributions.
Adverse events (AEs)
AEs included in the model were based on information reported in FIRST and VISTA and are listed in . In all instances, we limited our attention to AEs of grade 3/4 severity reported in ≥5% of patients.
Table 1. Percentages of patients receiving Rd or VMP reporting grade 3/4 adverse events.
For Rd, rates of each AE were based on analyses of patient-level data from FIRST; corresponding values for VMP were based on information from VISTACitation19. Rates of each AE were examined over discrete intervals of follow-up during FIRST, as follows: (1) cycles 0–6, (2) cycles 7–12, (3) cycles 13–18, and (4) all subsequent cycles. The rates were then converted to probabilities ()Citation20. For VMP, differential AE rates by cycle were unavailable. Thus, the percentage of patients experiencing each AE as reported in VISTA was converted to an annual rate. This annual rate was expressed as a per-cycle rate by dividing by 13 (i.e., the number of 28-day cycles per year) and subsequently converted back to a probability. Patients were assumed to be at risk for AEs only during time spent on therapy.
Direct costs
The model considered the total direct costs of care for patients treated with Rd or VMP, including medical and pharmacy costs related to treatment of AEs (including prophylaxis), routine care and monitoring associated with pre- and post-progression, and post-progression treatment costs. All costs were estimated from the perspective of a US third-party payer using 2014 US dollars.
The per-cycle cost of lenalidomide was based on the wholesale acquisition cost (WAC) per capsuleCitation21, and the expected number of capsules used. Patient-level data from FIRST informed estimates of compliance with Rd, both in terms of monthly utilization as well as the percentage of progression-free patients continuing on therapy over time. The per-cycle cost of dexamethasone was estimated in the same fashionCitation22. The assumed cost per cycle of Rd is shown in Citation12,Citation21–24.
Table 2. First-line drug costs.
The per-cycle cost of bortezomib was calculated based on its 2014 US Centers for Medicare and Medicaid Services (CMS) payment limitCitation23 per vial (i.e., average sale price [ASP] + 6%) and the assumed number of vials required. While the calculated dose per administration was estimated to be 2.4 mg for a typical patient with a body surface area of 1.86 m2, it was assumed that a full vial would be billed, as is common in the US. Patients can receive bortezomib through subcutaneous or intravenous administration; in the absence of published data on relative frequency we arbitrarily assumed that VMP patients would receive an equal distribution of each at relevant CMS reimbursement rates ($108.90 intravenous administration [current procedural terminology (CPT) code 96409] and $73.79 subcutaneous administration [CPT code 96401])Citation24. Acquisition costs of melphalan and prednisone, respectively, were based on the WAC from the Red Book OnlineCitation22. The assumed cost per cycle of VMP (including acquisition and administration) is shown in .
Costs of each AE were based on published literatureCitation25–36. As necessary, costs were updated to 2014 US dollars by means of the medical care component of the Consumer Price Index ()Citation25–36.
Table 3. Costs of adverse events.
All patients were assumed to require periodic routine monitoring consisting of various laboratory tests (e.g., metabolic panels, liver function tests) and other assessments, with frequencies in part assumed to be dependent on treatment received, sourced from interviews with physicians; costs were based on relevant CPT-4 codes and CMS reimbursement rates ()Citation24,Citation37.
Table 4. Use and cost of routine care and monitoring for multiple myeloma, by treatment.
Agents used in second- and third-line therapy were assumed to be conditional on prior line(s) of treatment (e.g., patients who received VMP as first-line therapy were assumed to be more likely to receive Rd as second-line therapy). Regimens included as second- and third-line therapy (collectively, ‘subsequent therapy’) included Rd, bortezomib and thalidomide. Duration of subsequent therapy was assumed to be independent of initial treatment received and was estimated based on patterns of utilization of these agents, as reported in clinical trials among patients with relapsed/refractory disease. A decision tree was used to track treatment pathways over time and to calculate weighted costs of second- and third-line therapy ()Citation21–24,Citation38–40. The tests and assessments were assumed to be the same as those used during pre-progression. However, the frequency with which they were administered was assumed to be higher than that in the pre-progression phase ().
Table 5. Cost of second- and third-line therapy.
Health-state utilities
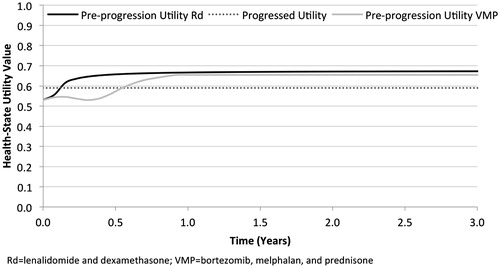
Estimates of pre-progression health-state utility for Rd and VMP were based on information collected during FIRST and VISTA, respectively. For Rd, health-state utility values associated with PFS were calculated based on responses to the EuroQol 5-dimension questionnaire (EQ-5D), which was administered at baseline, as well as at various points during follow-up (i.e., 1, 3, 6, 12, and 18 months after treatment initiation, and at study discontinuation) and mapped to utility values using the time trade-off method for the UK general populationCitation41. These utility values were used to derive a predictive equation that estimated Rd-specific health-state utility values over the duration of PFS (). Because these values were based on the pre-progression experience of the intent-to-treat population enrolled in FIRST, including the impact of AEs in patients who experienced such events, no additional decrement associated with treatment-related AEs was needed.
Figure 3. Health state utilities over time.
A similar approach was taken for VMP. However, because patient-level data from VISTA were unavailable, estimates were based on a previous publication in which European Organization for Research and Treatment of Cancer Quality of Life Questionnaire C30 (EORTC QLQ-C30) values were provided for all randomized individuals during each of the initial nine cycles of treatment as well as at the end-of-treatment visitCitation42. These scores were then mapped to the EQ-5D using methods described by Proskorovsky et al.Citation43 and subsequently converted to health-state utility scores using the time trade-off method for the UK general populationCitation44. Similar to the case with Rd, the impact of AEs in patients who experienced such events were included in the QLQ-C30 measurements taken in the VISTA trial; thus, no additional decrement associated with treatment-related AEs was needed.
For both Rd and VMP, the pre-progression health-state utility at baseline was assumed to be 0.53, consistent with that reported among patients enrolled in FIRSTCitation41; subsequent pre-progression health-state utility values varied over time, with a maximum value of 0.67 for Rd and 0.65 for VMP (). The post-progression health-state utility value of 0.59 was also calculated using information from FIRST. Unlike pre-progression values, the health-state utility accorded to post-progression was assumed to be invariant with respect to first-line treatment received and time since disease progression.
Analyses
For each initial regimen, the model calculated total expected LYs, QALYs, and lifetime costs, respectively. Incremental cost-effectiveness ratios (ICERs) of Rd vs VMP were reported in terms of the incremental cost per LY gained and per QALY gained.
Deterministic sensitivity analyses varied several key input parameters, as shown in . Except for the discount rates, OS and PFS HRs, baseline and post-progression utilities, and the cost of bortezomib administration, all parameters were varied ±20% of their base case value, an assumption taken to vary the inputs over a wide range of possibilities in lieu of confidence intervals, which were lacking for many of the parameter estimates. The discount rates were varied between 1.0% and 5.0%; OS and PFS, between bounds of their 95% confidence intervals; utilities, also between bounds of their 95% confidence intervals; and cost of bortezomib administration, between the costs of assuming all patients using the subcutaneous formulation and all patients using the intravenous formulation. A probabilistic sensitivity analysis was used to account for uncertainty in model parameter estimates, as shown in , via a Monte Carlo analysis run with 1000 simulations.
Table 6. Deterministic and probabilistic sensitivity analyses parameters.
In addition, three scenario analyses were undertaken to see the effect of several assumptions on the cost-effectiveness estimates. Specifically, to test the impact of allowing some vial sharing in bortezomib-treated patients, we conducted a scenario in which 50% of patients were assumed to share vials (i.e., no drug wastage) and 50% were assumed to use part of a vial, with the remaining medication discarded. To test the impact of using utilities from different sources with different methodologies, we conducted a scenario in which VMP-treated patients were assumed to have the same utility over time as Rd-treated patients (i.e., those derived from the FIRST trial). Lastly, in order to see how much the treatment duration for Rd-treated patients impacted the results, we allowed patients to be treated until death, disease progression, or treatment discontinuation (without any maximum treatment duration imposed).
All analyses were undertaken from the perspective of a US third-party payer. A threshold of $125,000 per QALY was used in evaluations of cost-effectiveness, which was consistent with a prior examination of the cost-effectiveness of trastuzumab in US patients with metastatic breast cancerCitation45 and with an updated assessment of the benchmark value of a life year gained from dialysisCitation46. All future benefits and costs were discounted at 3% annually.
Results
Base case
On an undiscounted basis, relative to VMP, use of Rd as first-line therapy for ASCT-ineligible patients in the US with MM was expected to result in an additional 3.23 LYs (8.60 vs 5.37 for VMP), 1.30 progression-free LYs (PFLYs; 3.72 vs 2.42), 1.94 post-progression LYs (PPLYs; 4.89 vs 2.95) and 2.09 QALYs (5.35 vs 3.27; ). After discounting at an annual rate of 3%, the expected gains were 2.22 LYs, 1.06 PFLYs, 1.16 PPLYs, and 1.47 QALYs.
Table 7. Base case results: cost-effectiveness outcome (average per patient).
Discounted lifetime total costs of care per patient were $324,795 for Rd and $245,819 for VMP, a difference of $78,977. The incremental cost was primarily attributable to higher total expected costs of Rd relative to VMP ($213,803 vs $81,052), which were partially offset by higher post-progression costs for VMP relative to Rd ($110,922 vs $164,767). The incremental cost per QALY gained with Rd vs VMP was $53,826; the incremental cost per LY gained was $35,552.
Sensitivity analyses
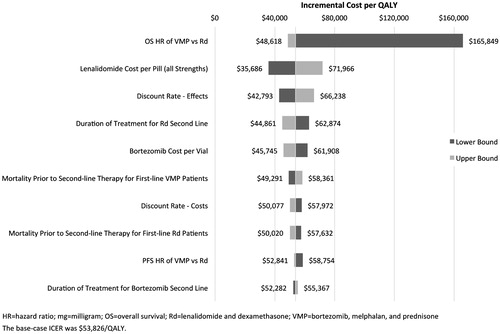
Results of deterministic sensitivity analyses are displayed in . The model was most sensitive to changes in the HR for OS associated with Rd vs VMP, the cost per capsule of lenalidomide (all strengths and lines), and the discount rate applied to effectiveness outcomes. It was least sensitive to the costs per day of prednisone, dexamethasone, and thalidomide, the treatment durations for bortezomib and thalidomide in the third line, and the AE rates for VMP.
Figure 4. Tornado diagram illustrating results of deterministic sensitivity analyses.
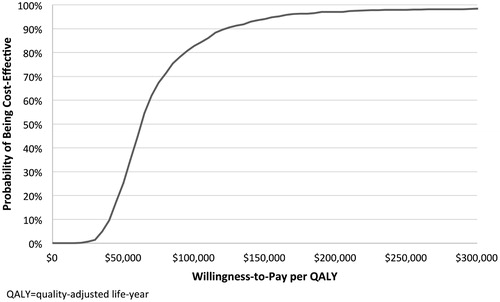
Results of probabilistic sensitivity analyses are shown in and. In probabilistic sensitivity analyses, 99.6% of simulations resulted in a positive incremental cost-effectiveness ratio (i.e., quadrant I), indicating that Rd was associated with greater life expectancy, albeit at a higher cost. At a willingness-to-pay (WTP) threshold of $125,000 per QALY gained, Rd was found to be cost-effective in 90.6% of simulations.
Figure 5. Incremental cost-effectiveness plane for probabilistic sensitivity analyses.
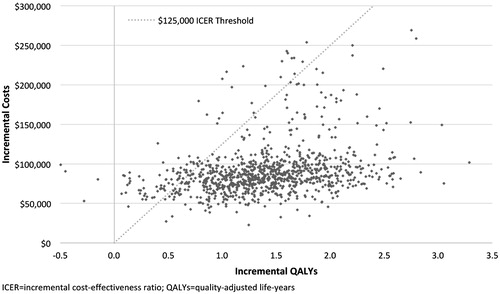
Figure 6. Cost-effectiveness acceptability curve.
Scenario analyses
In a scenario analysis that assumed 50% of bortezomib vials would be re-used by other patients, expected total costs of patients treated with VMP decreased by $10,867 ($234,952 vs the base-case estimate of $245,819). The resulting estimated incremental cost per QALY gained with Rd vs VMP was $61,233; the corresponding value for the incremental cost per LY gained was $40,444.
In a second scenario analysis in which the utilities over time assumed for VMP-treated patients were set equal to those assumed for Rd-treated patients, expected total QALYs of VMP-treated patients increased by 0.07 years (2.86 vs the base-case estimate of 2.79). This resulted in an incremental cost per QALY gained with Rd vs VMP of $56,503, an increase of $2676 from the base-case. As expected, the incremental cost per LY gained remained unchanged from the base case.
In a third scenario analysis in which Rd use was assumed to continue until death, disease progression, or discontinuation (i.e., without a duration cap imposed), expected total healthcare costs in patients treated with this regimen increased by $10,142 ($334,937 vs the base-case estimate of $324,795; no other values changed relative to base-case estimates). The resulting estimated incremental cost per QALY gained with Rd vs VMP was $60,738; the corresponding value for the incremental cost per LY gained was $40,118.
Discussion
While the use of lenalidomide and bortezomib as first-line therapy in MM has improved outcomes, questions remain regarding increased costs. In the absence of direct random-ized clinical comparisons between these two agents, this analysis modeled the long-term implications based on indirect comparison methods. In the base case analyses, use of Rd was estimated to result in a gain of 3.23 LYs relative to VMP; the corresponding gain in QALYs was 2.09 (all undiscounted). The resulting estimates of cost-effectiveness—$53,826 per QALY gained and $35,552 per LY gained—were well within the range of other novel oncology treatmentsCitation45,Citation47–49. Given that Rd is intended for continuous use until disease progression or death while VMP has a finite duration of therapy, it is not surprising that our findings were most sensitive to assumptions concerning OS of VMP relative to Rd and the cost of lenalidomide.
As evidenced by the availability of other agents with relatively high ICERs, treatment decisions in oncology in the US are not based on a formal dollar threshold for value. In a recent survey of oncologists regarding willingness to use various hypothetical agents based on price and expected gains in survival, the median response was associated with a treatment that was $125,000 more than standard care and that yielded an additional 6 months of life (this translates to a cost per LY gained of $250,000)Citation50. One benchmark commonly cited in the US (i.e., $50,000 per QALY) was based on the cost of dialysis for 1 yearCitation51, this benchmark was re-evaluated and updated in 2009 to $129,000 per QALYCitation46.
Although no other economic models have been conducted to compare these two regimens specifically, other models have been developed to compare different first-line regimens in MM. Garrison et al.Citation14 used a Markov model to evaluate MP, VMP, MPT, and MPR (MPR is identical to MPL; referred to as MPR and MPR-R without and with R maintenance, respectively). Results from their analysis indicated VMP was associated with lower costs and greater benefit than the MPR-R regimenCitation14. However, several aspects of that model warrant further inspection. For example, based on the reported mean total expected cost of VMP ($39,754) and the mean duration of VMP therapy (39 weeks, which would provide a total of 40 doses as opposed to 52 doses associated with the full 54-week course of therapy), it appears that the authors assumed a cost per dose of bortezomib of $994 (i.e., $39,754/40). Since the actual price of bortezomib is nearly twice as high (i.e., ∼$1613 per 3.5 mg vial)Citation23, we surmise that their cost calculations only considered the quantity of bortezomib administered, and not the full cost of the single-use vial. Had full-vial costs been used, VMP costs would have been ∼50% higher. There is also a question concerning the granulocyte colony-stimulating factor (G-CSF) costs ascribed to every patient on the MPR-R regimen in the model, at a cost of $3000 every month for neutropenia treatment and an additional $922 every month for G-CSF prophylaxis, despite the lack of evidence of such in the clinical trial and the fact that routine G-CSF prophylaxis is not recommended for patients receiving lenalidomide. The assumptions of clinical benefit from VMP also warrant closer inspection. In an earlier publication of their analysisCitation52, the authors noted that, of the total survival benefit attributed to VMP, 94% of it was due to LY gains from post-progression treatment and 6% from extension of progression-free survival attributable to VMP; however, this breakout of pre- vs post-progression benefit was not included in the final publication.
Kim et al.Citation53 evaluated the cost-effectiveness of lenalidomide maintenance therapy for patients with MM. Based on use of an unconventional measure evaluating the Average Cumulative Cost per Progression-Free Survivor, it was deemed that the addition of lenalidomide to MP in the induction and also in the maintenance setting was ‘prohibitively costly’. Further, it was assumed that all patients remained on therapy until progression of the disease, which would result in a duration of therapy that would be double that noted in FIRST with Rd, with corresponding impact on drug and AE costs. The present model used conventional economic methods, reported duration and utilization from clinical trial data, and provided transparency regarding LYs gained before and after progression. Using these techniques, the present model showed that Rd provided additional LYs and QALYs at a roughly commensurate higher cost compared with VMP, with a relatively similar cost per LY ($5894 in favor of Rd) and an ICER well within the ratios seen for other advances in oncology, and represented a cost-effective option as first-line treatment for ASCT-ineligible MM relative to VMP.
There are certain limitations associated with this model that merit mention. Effectiveness comparisons were based on an NMA that used MP and MPT to ‘bridge’ between the two relevant studies (i.e., FIRST for Rd; VISTA for VMP). A key assumption of an NMA is the homogeneity of individuals across all included studies. While patients across the five studies were comparable in most respects, patients enrolled in IFM 99-06, IFM 01-01, and the study conducted by Sacchi et al.Citation16 showed trends toward being less likely to have more advanced disease and more likely to have bone lesions (not reported in Sacchi et al.Citation16). These differences should have had little impact on the estimate of relative efficacy of Rd vs VMP, because only relative efficacy (i.e., HRs of OS or PFS) from each study was considered in the NMA analysis to preserve randomization. In addition, the relative treatment efficacy of MPT vs MP had no heterogeneity (I2 = 0) across both IFM trials, demonstrating that differences in baseline factors, particularly age, do not have much impact on the relative treatment efficacyCitation15.
Another limitation is that use of a partitioned survival model required complete estimates of PFS and OS for each of the two regimens. The duration of follow-up in FIRST did not extend to the lifetime of all patients enrolled in the study, so data were extrapolated based on parametric models. Information on PFS was relatively complete (∼70% of Rd patients had progressed or died by the end of follow-up), but corresponding information for OS was not (4-year survival was 59% among Rd patients). The degree to which parameterized functions calculated to represent OS curves for Rd and VMP approximate actual long-term survival is not known.
Utility values used in this analysis were calculated from the full patient populations of the FIRST and VISTA trials and are not limited to US patients. In addition, UK population tables were used to generate utility score from collected PRO data. Deterministic sensitivity analysis suggested that utility values had minimal impact on the calculated ICER.
On a related matter, the methods of utility estimation for Rd and VMP differed due to the nature of the available data. Unlike the FIRST trial, where EQ-5D responses were converted directly to health-state utilities, a mapping algorithm was used to convert EORTC QLQ-C30 values obtained during the conduct of VISTA to EQ-5D values, which were subsequently converted to utilities. Furthermore, the derived utilities for VMP were adjusted to ensure both modeled Rd- and VMP-treated patients started with the same baseline utility (i.e., that observed in the Rd arm of the FIRST trial). Although the mapping study was conducted in the target population, we cannot be sure that the mapped EQ-5D values would have been the same had they been collected in the VISTA trial. In order to test the impact of utility values used for VMP, a scenario was conducted in which the utilities of VMP-treated patients were assumed equal to those of Rd-treated patients. This resulted in a relatively modest increase in the ICER of Rd relative to VMP of $2677 per QALY.
Our model assumed constant costs for each time period in a disease state with a particular regimen. A recent analysis by Arikian et al.Citation54 showed that, for patients with MM who received first-line therapy with either lenalidomide or bortezomib, monthly total costs (drug and medical) were roughly $16,000 in the initial quarter and declined steadily each quarter until plateauing at a 68% reduction 18 months later, and then rose sharply upon beginning second-line therapy. This finding, and similar work by Gaultney and Uyl-de GrootCitation55 showing that patients in later lines of therapy had higher monthly costs, suggest an economic benefit for Rd due to the longer extension of time until the next therapy and consequent longer period of time in a below-average cost state.
Conclusions
Continuous first-line therapy has been associated with improved disease management and outcomes. Results of our model showed that use of Rd as first-line therapy in the US was estimated to provide more LYs and QALYs relative to VMP in transplant-ineligible patients with MM at a commensurately higher cost. Despite the additional costs incurred with continuous treatment, the extension of clinical benefit resulted in cost-effectiveness ratios within accepted levels published in other front-line oncology settings. As such, Rd may be a cost-effective alternative to VMP as initial treatment for transplant-ineligible patients with MM.
Transparency
Declaration of funding
This work was supported by research funding provided by Celgene Corporation, Summit, NJ, USA.
Declaration of financial/other relationships
SZU has served as a consultant to Celgene Corporation. AB, SG, and CGP are employed by Evidera Inc., a contract research organization that received funding from Celgene Corporation for this study. GB, WY, AEH, and YN are employed by and have an ownership interest in Celgene Corporation. JME peer reviewers on this manuscript have no relevant financial or other relationships to disclose.
Acknowledgments
The authors thank Meg Franklin of Franklin Pharmaceutical Consulting for medical writing assistance, and MediTech Media, for medical editing assistance, sponsored by Celgene Corporation.
Related Research Data
References
- National Comprehensive Cancer Network (NCCN). NCCN clinical practice guidelines in oncology (NCCN Guidelines(R)): Multiple Myeloma Version 1.2015. Fort Washington, PA: National Comprehensive Cancer Network, 2014. http://www.nccn.org/professionals/physician_gls/pdf/myeloma.pdf. Accessed September 22, 2014
- Siegel RL, Miller KD, Jemal A. Cancer statistics, 2015. CA Cancer J Clin 2015;65:5-29
- SEER. SEER stat fact sheets: myeloma. Bethesda, MD: SEER, 2014. http://seer.cancer.gov/statfacts/html/mulmy.html. Accessed September 22, 2014
- Kristinsson SY, Anderson WF, Landgren O. Improved long-term survival in multiple myeloma up to the age of 80 years. Leukemia 2014;28:1346-8
- Pulte D, Redaniel MT, Brenner H, et al. Recent improvement in survival of patients with multiple myeloma: variation by ethnicity. Leuk Lymphoma 2014;55:1083-9
- Kumar SK, Dispenzieri A, Lacy MQ, et al. Continued improvement in survival in multiple myeloma: changes in early mortality and outcomes in older patients. Leukemia 2014;28:1122-8
- Palumbo A, Anderson K. Multiple myeloma. N Engl J Med 2011;364:1046-60
- Benboubker L, Dimopoulos MA, Dispenzieri A, et al. Lenalidomide and dexamethasone in transplant-ineligible patients with myeloma. N Engl J Med 2014;371:906-17
- San Miguel JF, Schlag R, Khuageva NK, et al. Persistent overall survival benefit and no increased risk of second malignancies with bortezomib-melphalan-prednisone versus melphalan-prednisone in patients with previously untreated multiple myeloma. J Clin Oncol 2013;31:448-55
- Kumar A, Hozo I, Wheatley K, et al. Thalidomide versus bortezomib based regimens as first-line therapy for patients with multiple myeloma: a systematic review. Am J Hematol 2011;86:18-24
- Picot J, Cooper K, Bryant J, et al. The clinical effectiveness and cost-effectiveness of bortezomib and thalidomide in combination regimens with an alkylating agent and a corticosteroid for the first-line treatment of multiple myeloma: a systematic review and economic evaluation. Health Technol Assess 2011;15:1-204
- San Miguel JF, Schlag R, Khuageva NK, et al. Bortezomib plus melphalan and prednisone for initial treatment of multiple myeloma. N Engl J Med 2008;359:906-17
- Mateos MV, Richardson PG, Shi H, et al. Higher cumulative bortezomib dose results in better Overall Survival (OS) in patients with previously untreated Multiple Myeloma (MM) receiving bortezomib-melphalan-prednisone (VMP) in the phase 3 VISTA study. Blood 2013;122:1968
- Garrison LP, Jr Wang ST, Huang H, et al. The cost-effectiveness of initial treatment of multiple myeloma in the U.S. with bortezomib plus melphalan and prednisone versus thalidomide plus melphalan and prednisone or lenalidomide plus melphalan and prednisone with continuous lenalidomide maintenance treatment. Oncologist 2013;18:27-36
- Weisel K, Doyen C, Dimopoulos MA, et al. P645 - A systematic literature review and network meta-analysis of treatments for patients with transplant-ineligible newly diagnosed multiple myeloma. Paper presented at: 20th Annual European Hematology Association Congress; June 11–14, 2015; Vienna, Austria
- Sacchi S, Marcheselli R, Lazzaro A, et al. A randomized trial with melphalan and prednisone versus melphalan and prednisone plus thalidomide in newly diagnosed multiple myeloma patients not eligible for autologous stem cell transplant. Leuk Lymphoma 2011;52:1942-8
- Facon T, Mary JY, Hulin C, et al. Melphalan and prednisone plus thalidomide versus melphalan and prednisone alone or reduced-intensity autologous stem cell transplantation in elderly patients with multiple myeloma (IFM 99-06): a randomised trial. Lancet 2007;370:1209-18
- Hulin C, Facon T, Rodon P, et al. Efficacy of melphalan and prednisone plus thalidomide in patients older than 75 years with newly diagnosed multiple myeloma: IFM 01/01 trial. J Clin Oncol 2009;27:3664-70
- Mateos MV, Richardson PG, Schlag R, et al. Bortezomib plus melphalan and prednisone compared with melphalan and prednisone in previously untreated multiple myeloma: updated follow-up and impact of subsequent therapy in the phase III VISTA trial. J Clin Oncol 2010;28:2259-66
- Fleurence RL, Hollenbeak CS. Rates and probabilities in economic modelling: transformation, translation and appropriate application. Pharmacoeconomics 2007;25:3-6
- Wolters Kluwer Health. Medi-Span Drug Information Database, average wholesale acquisition cost. Greenwood Village, CO: Wolters Kluwer Health, 2014. http://www.medispan.com/average-wac-pricing-file/. Accessed September, 2014
- Truven Health Analytics. RED BOOK Online®. Baltimore, MD: Truven Health Analytics, 2014. http://micromedex.com/products/product-suites/clinical-knowledge/redbook. Accessed July 16, 2014
- Centers for Medicare & Medicaid Services (CMS). Average Sales Price (ASP) Pricing File. Payment Allowance Limits for Medicare Part B Drugs. Effective July 1, 2014 through September 30, 2014. Baltimore, MD: Centers for Medicare & Medicaid Services, 2014. http://www.cms.gov/. Accessed November, 2014
- Centers for Medicare & Medicaid Services (CMS). Administrative cost. Hospital Outpatient Prospective Payment System. 2014 File. Payment Rate. Baltimore, MD: Centers for Medicare & Medicaid Services, 2014. http://www.cms.gov/Medicare/Medicare-Fee-for-Service-Payment/HospitalOutpatientPPS/index.html. Accessed November, 2014
- Brown GC, Brown MM, Menezes A, et al. Cataract surgery cost utility revisited in 2012: a new economic paradigm. Ophthalmology 2013;120:2367-76
- Calhoun EA, Chang CH, Welshman EE, et al. Evaluating the total costs of chemotherapy-induced toxicity: results from a pilot study with ovarian cancer patients. Oncologist 2001;6:441-5
- Dranitsaris G, Maroun J, Shah A. Severe chemotherapy-induced diarrhea in patients with colorectal cancer: a cost of illness analysis. Support Care Cancer 2005;13:318-24
- Dworkin RH, White R, O'Connor AB, et al. Health care expenditure burden of persisting herpes zoster pain. Pain Med 2008;9:348-53
- Eber MR, Laxminarayan R, Perencevich EN, et al. Clinical and economic outcomes attributable to health care-associated sepsis and pneumonia. Arch Intern Med 2010;170:347-53
- Elting LS, Escalante CP, Cooksley C, et al. Outcomes and cost of deep venous thrombosis among patients with cancer. Arch Intern Med 2004;164:1653-61
- Gatchel RJ, Polatin PB, Noe C, et al. Treatment- and cost-effectiveness of early intervention for acute low-back pain patients: a one-year prospective study. J Occup Rehabil 2003;13:1-9
- Goulart B, Ramsey S. A trial-based assessment of the cost-utility of bevacizumab and chemotherapy versus chemotherapy alone for advanced non-small cell lung cancer. Value Health 2011;14:836-45
- Nichols GA, Arondekar B, Herman WH. Medical care costs one year after identification of hyperglycemia below the threshold for diabetes. Med Care 2008;46:287-92
- Ramsey SD, Clarke L, Kamath TV, et al. Evaluation of erlotinib in advanced non-small cell lung cancer: impact on the budget of a U.S. health insurance plan. J Manag Care Pharm 2006;12:472-8
- Singh G, Lingala V, Wang H, et al. Use of health care resources and cost of care for adults with constipation. Clin Gastroenterol Hepatol 2007;5:1053-8
- Sorensen S, Ellis L, Wu Y, et al. Budgetary impact on a U.S. health plan adopting abiraterone acetate plus prednisone for the treatment of patients with metastatic castration-resistant prostate cancer. J Manag Care Pharm 2013;19:799-808
- Centers for Medicare & Medicaid Services (CMS). Clinical Diagnostic Laboratory Fee Schedule. National Limit Payment. Baltimore, MD: Centers for Medicare & Medicaid Services, 2014. http://www.cms.gov/Medicare/Medicare-Fee-for-Service-Payment/ClinicalLabFeeSched/clinlab.html. Accessed November, 2014
- Kropff M, Baylon HG, Hillengass J, et al. Thalidomide versus dexamethasone for the treatment of relapsed and/or refractory multiple myeloma: results from OPTIMUM, a randomized trial. Haematologica 2012;97:784-91
- Richardson PG, Sonneveld P, Schuster MW, et al. Bortezomib or high-dose dexamethasone for relapsed multiple myeloma. N Engl J Med 2005;352:2487-98
- Stadtmauer EA, Weber DM, Niesvizky R, et al. Lenalidomide in combination with dexamethasone at first relapse in comparison with its use as later salvage therapy in relapsed or refractory multiple myeloma. Eur J Haematol 2009;82:426-32
- Delforge M, Minuk L, Eisenmann JC, et al. Health-related quality-of-life in patients with newly diagnosed multiple myeloma in the FIRST trial: lenalidomide plus low-dose dexamethasone versus melphalan, prednisone, thalidomide. Haematologica 2015;100:826-33
- Delforge M, Dhawan R, Robinson D, Jr, et al. Health-related quality of life in elderly, newly diagnosed multiple myeloma patients treated with VMP vs. MP: results from the VISTA trial. Eur J Haematol 2012;89:16-27
- Proskorovsky I, Lewis P, Williams CD, et al. Mapping EORTC QLQ-C30 and QLQ-MY20 to EQ-5D in patients with multiple myeloma. Health Qual Life Outcomes 2014;12:35
- Cavenagh JD, Belch AR, Hulin C, et al. Cost-effectiveness in newly diagnosed multiple myeloma (NDMM): Lenalidomide plus low-dose dexamethasone (Rd) versus bortezomib plus melphalan and prednisone (VMP). Milan, Italy: European Hematology Association, 2014
- Elkin EB, Weinstein MC, Winer EP, et al. HER-2 testing and trastuzumab therapy for metastatic breast cancer: a cost-effectiveness analysis. J Clin Oncol 2004;22:854-63
- Siddiqui M, Rajkumar SV. The high cost of cancer drugs and what we can do about it. Mayo Clin Proc 2012;87:935-43
- Griffiths RI, Gleeson ML, Mikhael J, et al. Comparative effectiveness and cost of adding rituximab to first-line chemotherapy for elderly patients diagnosed with diffuse large B-cell lymphoma. Cancer 2012;118:6079-88
- Handorf EA, McElligott S, Vachani A, et al. Cost effectiveness of personalized therapy for first-line treatment of stage IV and recurrent incurable adenocarcinoma of the lung. J Oncol Pract 2012;8:267-74
- Shankaran V, Mummy D, Koepl L, et al. Survival and lifetime costs associated with first-line bevacizumab use in older patients with metastatic colorectal cancer. Oncologist 2014;19:892-9
- Ubel PA, Berry SR, Nadler E, et al. In a survey, marked inconsistency in how oncologists judged value of high-cost cancer drugs in relation to gains in survival. Health Aff (Millwood) 2012;31:709-17
- Giacomini M. How good is good enough? Standards in policy decisions to cover new health technologies. Healthc Policy 2007;3:91-101
- Wang ST, Huang H, Ba-Mancini A, et al. The cost-effectiveness of bortezomib plus melphalan and prednisone versus lenalidomide plus melphalan and prednisone with continuous lenalidomide maintenance treatment for the initial treatment of multiple myeloma in the United States. Blood 2010;116:2563
- Kim MY, Sposto R, Swaika A, et al. Pharmacoeconomic implications of lenalidomide maintenance therapy in multiple myeloma. Oncology 2014;87:224-31
- Arikian SR, Milentijevic D, Binder G, et al. Patterns of total cost and economic consequences of progression for patients with newly diagnosed multiple myeloma. Curr Med Res Opin 2015;31:1105-15
- Gaultney JG, Uyl-de Groot CA. Efficient allocation of novel agents in multiple myeloma: a work in progress. Oncologist 2013;18:5-7