
Abstract
Aim:
A cost-effectiveness analysis was performed for sequential treatments of chronic myelogenous leukemia (CML) with tyrosine kinase inhibitors (TKIs) after failure of 1st line imatinib, from a commercial payer perspective in the US.
Methods:
A Markov model was developed to simulate lifetime treatment costs and health outcomes for TKI sequences for treatment of patients resistant or intolerant to 1st-line imatinib. Five health states were included, chronic phase 2nd-line TKI, chronic phase 3rd-line TKI, chronic phase post-TKI, advanced phases, and death. Efficacy (response achievement, loss of response, transformation, death) and safety (adverse events incidence, discontinuation) data are based on clinical trials. Resource utilization, costs, and utilities were based on product labels and publically available data. Uncertainty analyses were conducted for key inputs.
Results:
In patients failing imatinib, dasatinib-initiating treatment sequences provide the most survival (ΔLYs = 0.2–2.0), QALYs (ΔQALYs = 0.2–1.9), and accrue highest CML-related costs (ΔCosts = $64,000–$222,000). The average ICER per QALY for dasatinib- vs imatinib-initiating sequences is $100,000 for an imatinib-resistant population. The average ICER per QALY for dasatinib- vs nilotinib-initiating sequences is $170,000 for an imatinib-resistant population, and $160,000 for an imatinib-intolerant population.
Conclusions:
This analysis suggests that dasatinib is associated with increased survival and quality of life compared to high dose imatinib and to a smaller extent with nilotinib, among patients resistant or intolerant to 1st-line imatinib, primarily based on higher cytogenetic response rates observed in clinical studies of dasatinib. Head-to-head studies of sequential use of dasatinib and nilotinib are needed to validate the model findings of improved survival (LYs) with better quality-of-life (QALYs) for patients initiating dasatinib in 2nd-line. However, the model findings (in light of higher cytogenetic response rates with dasatinib) are supported by other studies showing improved quality-of-life for responders, and improved survival for patients achieving cytogenetic response.
Introduction
Various TKIs have been approved for treatment of CML since 2001, including Gleevec (imatinib mesylate), Sprycel (dasatinib), Tasigna (nilotinib), and Bosulif (bosutinib)Citation1–4. Imatinib was the first treatment to be launched and has been commonly used for treatment of newly diagnosed CML patients. After failure of imatinib, high-dose imatinib, dasatinib, nilotinib, and bosutinib are recommended for second-line treatment of CMLCitation5.
In the absence of randomized, head-to-head clinical trials for TKI use after failure of imatinib, economic analyses have been conducted to compare cost and health outcomes. Published cost-effectiveness analyses of TKIs have generally found that dasatinib offered better health outcomes than high-dose imatinib and nilotinib, at a higher cost (except for Sambrook et al.Citation6, which reported lower costs on dasatinib compared to high-dose imatinib)Citation6–12. However, the analyses may not reflect current knowledge or treatment patterns for CML. These economic studies considered efficacy data from clinical trials with short-term follow-up (1–2 years), and some have been criticized due to uncertainty in the long-term extrapolation of progression and survival dataCitation9,Citation10. However, long-term follow-up data (3–4 years) have become available, and cost-effectiveness analysis using these data could address these concerns. Second, the economic analyses did not assess sequential treatment of CML. The economic studies also restricted their focus to second-line treatment and did not consider efficacy and cost offsets produced by third-line TKI treatment, such as sequential use of bosutinibCitation13. Finally, most of the models assumed that patients receive treatment until progression or occurrence of serious adverse events, despite guideline recommendations of continuing treatment only if patients achieve a certain level of responseCitation5; the assumption of treatment until progression may over-estimate time on TKI treatment.
To address the limitations of existing cost-effectiveness analyses, we developed a new analysis that considers the long-term follow-up data from dasatinib and nilotinib clinical trials, the reason for failure of first-line imatinib (resistance or intolerance), guideline recommendations for treatment continuation conditional on response to treatment, and long-term progression and survival risk based on the type of response (cytogenetic or molecular).
Methods
Analysis overview
The cost-effectiveness analysis was conducted from the perspective of a third-party payer in the US, and compares up to six TKI sequences for 2nd and 3rd-line (). Patients failing 1st-line imatinib due to resistance or intolerance were analyzed separately. High-dose imatinib is considered only for the imatinib-resistant population because patients intolerant to imatinib are unlikely to receive high-dose imatinib as a 2nd-line treatment. Iclusig (ponatinib) and Synribo (Omacetaxine mepesuccinate) are now indicated for treatment of chronic phase CML, with T315I-postive mutation, after failure of two or more TKIs. However, these two agents are not considered in the analysis; at the time of model development, ponatinib was taken off the market because of the risk of life-threatening blood clots and severe narrowing of blood vessels, and omacetaxine was not granted approval. Currently, these agents are restricted to the sub-group of patients with T315I-positive mutation, which is not considered in the current analysisCitation5,Citation14–16.
Table 1. TKI sequences evaluated for patient populations.
Recommended doses were identified from FDA labels for dasatinib (100 mg once daily), nilotinib (400 mg twice daily), and bosutinib (500 mg once daily)Citation2–4. High-dose imatinib is not recommended in the FDA label, although dose escalation of imatinib (to 600 mg or 800 mg per day) is observed in clinical practice. The model considers the 800 mg per day dose because the majority of patients in clinical trials of high-dose imatinib used 800 mg per dayCitation17,Citation18.
Model structure
A Markov cohort model was developed in Microsoft Excel to estimate lifetime treatment costs and health outcomes using 3-month cycles, discounted at 3.0% per annumCitation19. The time horizon of the analysis is 40 years from the initiation of 2nd line treatment. The median age of onset of CML is 49 years, while the median age of 2nd-line treatment initiation is 57 years, which is based on the weighted average of the estimates reported in trials assessing TKIs after failure of imatinib; therefore, a 40-year time horizon will cover the lifetime of patients initiating second-line treatment.
presents the health states included in the model. Patients in all chronic phase states may experience transformation to advanced phases of CML or death. For patients treated with TKIs, the first 12 months of treatment are divided into a series of ‘tunnel states’ in order to implement stopping rules based on practice guidelines. Tunnel states are health states in which patients spend only one cycle (i.e., there is a 0% probability of remaining in the health state).
Figure 1. Model schematic.
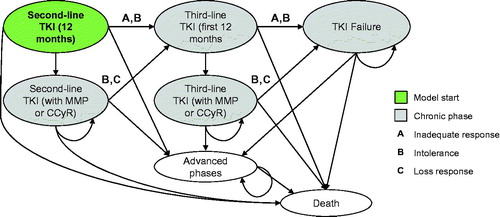
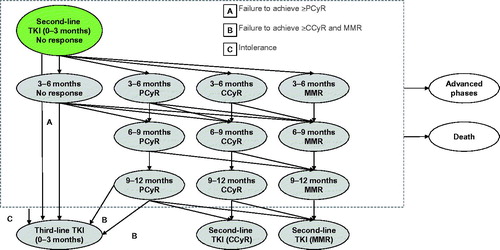
presents the tunnel states for 2nd-line TKIs. (3rd-line TKI tunnel states follow the same logic, but are not shown.) The allowed transitions are based on evaluation of major molecular response (MMR) every 3 months, and bone marrow cytogenetic tests (BMC) at 3, 6, 12, and 18 months for patients with less than a complete cytogenetic response (CCyR). National Comprehensive Cancer Network (NCCN) guidelines recommend changing TKIs for patients without at least a partial cytogenetic response (PCyR) at the 6 month assessment, and for patients without at least CCyR at the 12 month assessmentCitation5. The model does not consider hematologic response; NCCN guidelines recommend use of MMR and CCyR, which are more conservative response types than complete hematologic response (CHR)Citation5. Note that patients may discontinue due to intolerance at any time.
Figure 2. Detailed schematic of ‘second-line TKI (first 12 months)’ health states (dashed grey box).
Patients with inadequate response, intolerance, or loss of response in 3rd-line TKI health states transition to the ‘TKI failure’ health state, where they can experience transformation or death. Once patients have transformed to advanced phases, the model assumes that they cannot return to a chronic phase.
Efficacy inputs
Systematic literature reviews conducted by Loveman et al.Citation10 and Rogers et al.Citation9 were used to identify studies presenting clinical evidence for dasatinib, nilotinib, and high-dose imatinib, after failing imatinib. The reviews identified both clinical trials and observational studies; however, trial-based evidence was considered more appropriate as data sources for our current analysis than observational studies. Searches of MEDLINE and the American Society of Hematology abstract databases were also used to identify clinical trials of TKIs in 2nd- or 3rd-line use.
Clinical trials evaluating TKIs for 2nd-line treatment generally present outcomes for the combined population of patients resistant or intolerant to 1st-line imatinib; however, generally only one data point is provided for each individual sub-group (such as the percentage of patients achieving response for the trial follow-up)Citation17,Citation18,Citation20–26. Therefore, model inputs for response, transformation to advanced phases, and death were estimated by determining outcomes for the overall population, and then applying a relative risk specific to each sub-group. (Note that high-dose imatinib is only for use in the imatinib-resistant population, so relative risks were not applied for these inputs.) presents the derived inputs, and the Appendix provides details. All other inputs are shown in .
Figure 3. Efficacy inputs—response, transformation, and death.
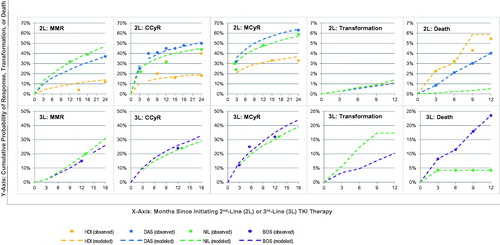
Table 2. Model inputs.
Response
The model assesses patient transitions by determining the level of response (MMR, CCyR, PCyR, and no response) up to 12 months of treatment, specific to population type and line of treatment. Probabilities of achieving MMR, CCyR, and major cytogenetic response (MCyR, defined as either CCyR or PCyR) between 3-12 months were based on interpolations from observed data. presents the response rates for the overall population, while sub-group-specific rates are obtained by applying relative risks. After 12 months, patients with MMR and CCyR continue treatment, and receive only QPCR tests every 3 months for monitoringCitation5.
Transformation to advanced phases and death
In the tunnel states representing the first 12 months of TKI treatment, the model applies transition probabilities for transformation or death specific to population type and line of treatment; these probabilities are independent of response type, since best response is generally achieved by 12 months. presents the cumulative probabilities of transforming and death for the overall population, based on observed data from clinical trials. Sub-group-specific data are obtained by applying relative risks. In the health states beyond 12 months, long-term risks of transformation and death were based on landmark analyses of patients achieving CCyR within 12 months.
Discontinuation: toxicities and loss of response
The probabilities of discontinuing due to toxicities are based on observed discontinuation rates and mean treatment durations from clinical trials. The model assumes that the risks are independent of response and population type.
After 12 months, patients with MMR or CCyR may also discontinue due to loss of response. The model assumes that this risk is constant, and is independent of response and population type, due to lack of published data. The probabilities were derived by estimating the proportion of patients losing response in clinical trials, which was generally included as part of the landmark analyses of progression-free survival (along with transformation or death).
Costs
In the 2nd and 3rd line TKI health states, patients accrue drug, monitoring, adverse event management, and routine care of CML-related costs. However, in the ‘post-TKI’ and ‘advanced phases’ health states, the model assumes that patients are not eligible to receive TKIs, and only considers costs associated with the routine care of CML. The costs are reported as 2014 USD.
Drug costs were estimated using publically available drug acquisition costs (average wholesale price from RedBook)Citation33, a 20% discount with copayment of $107Citation34, and a pharmacy dispensing fee of $1.22Citation35, recommended doses based on product labelsCitation2–4 and clinical trialsCitation17, and dose intensities reported in published clinical trialsCitation18,Citation20,Citation25,Citation26. Compliance is modeled by multiplying the annual drug costs by the dose intensities reported in clinical trial publications (high-dose imatinib: 100%Citation18; dasatinib: 98%Citation20; nilotinib: 99%Citation24; bosutinib: 96%Citation25).
Validation
Validation was implemented based on current ISPOR guidelinesCitation14. Technical validation was conducted by performing extreme-value sensitivity analyses, which sought to identify and correct potential inconsistencies in model behavior which could have been the result of programming or typing errors. An experienced programmer who was not part of the model design and programming team also performed a detailed review of the mathematical formulae and sequence of calculations.
Face validity of the model was established by comparing the model structure with the treatment guidelines and clinical trial protocols. Furthermore, external and predictive validity of the model was tested by comparing the model’s predictions with previously conducted economic analyses and long-term follow-up of trials.
Results
Base-case results
For patients resistant to 1st-line imatinib, 2nd-line dasatinib and nilotinib offered substantial gains in survival (1.8–1.9 years) vs high-dose imatinib, while dasatinib offered slight benefit vs nilotinib (0.2 years). Compared with the sequences including 2nd-line high-dose imatinib, dasatinib and nilotinib sequences offered greater benefit at higher cost; incremental cost-effectiveness ratios (ICERs) were $100,000 and $90,000 per QALY gained, respectively. The higher costs are attributable to the increased duration of 2nd-line TKI treatment, which was an additional 2.8 years with dasatinib at an average cost of $8777 per month, and 2.3 years with nilotinib at an average cost of $8992 per month. presents the results for each line of therapy.
Table 3. Model results for the imatinib-resistant population.
For patients intolerant to 1st-line imatinib, 2nd-line dasatinib provided an additional 0.47 QALYs vs nilotinib at an increased cost of $64,000 (ICER = $138,000) when bosutinib is used in 3rd-line, or an additional 0.45 QALYs (ICER = $143–000) when dasatinib or nilotinib are alternated in 2nd- and 3rd-line (). The increased cost with dasatinib is attributable to the increased time spent on 2nd-line therapy vs nilotinib (57 vs 47 months), at an average cost per month of $8760 (vs $8970 with nilotinib).
Table 4. Model results for the imatinib-intolerant population.
Multi-way uncertainty analyses
Six scenarios were analyzed to evaluate the impact of uncertainty in response, progression, and death risks in the model inputs:
Scenario 1: The model base case assumes that treatment decisions are based on availability of both cytogenetic and QPCR testing. However, these scenarios test if only QPCR testing is performed (Scenario 1a) or if only cytogenetic testing is performed (Scenario 1b).
Scenario 2: In the base case, the model considers different response rates for 3rd-line therapies. Dasatinib and nilotinib inputs were based on a prospective study assessing a small number of patients (dasatinib n = 34; nilotinib n = 14)Citation22. This scenario evaluated dasatinib and nilotinib response rates that are equal to bosutinib’s, since bosutinib data is based on a trial with a larger patient sampleCitation25.
Scenario 3: This scenario assumes that transformation and survival risks, up to 12 months after treatment initiation, are independent of the 2nd-line treatment choice. Probabilities of transformation and survival for 2nd line dasatinib and high dose imatinib were assumed to be the same as those for nilotinib.
Scenario 4: This scenario assumes that transformation and survival risks, up to 12 months after treatment initiation, are independent of the population. Probabilities of transformation and survival for imatinib-intolerant patients were assumed to be the same as those of the imatinib-resistant population, since most patients discontinue 1st-line imatinib due to resistance.
Scenario 5: This scenario assumes that 3rd-line transformation and survival risks, up to 12 months after treatment initiation, are independent of the treatment choice. Probabilities of transformation and survival for dasatinib and nilotinib were assumed to be the same as those of bosutinib, since bosutinib data is based on a trial with a larger patient sampleCitation25.
Scenario 6: In the base case, the model assumes that QPCR testing is performed every 3 months and cytogenetic testing at 3-, 6-, and 12-months. In order to reflect a scenario with poor compliance to NCCN guidelines, where patient monitoring may not happen so regularly, this scenario evaluates response assessment only at 12-months.
presents the results of scenario analyses for the sequence with the most QALYs (Sequence 4). Most of the scenarios tested were associated with similar results as the model base case. However, Scenario 1a was associated with lower QALYs and lower costs compared to the model base case, and Scenario 6 was associated with comparable QALYs but lower costs.
Table 5. Results of scenario analyses.
One-way uncertainty analyses
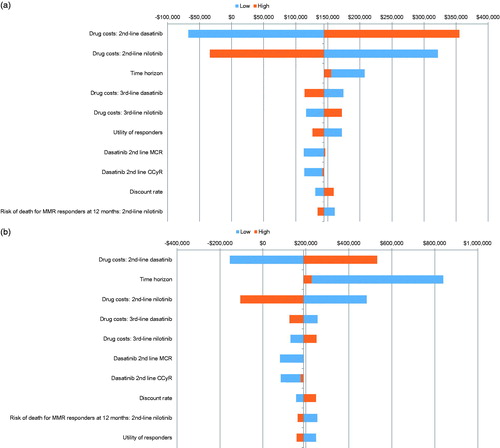
The model inputs, including response, transformation risk, mortality risk, utilities, and costs, were varied in one-way sensitivity analysis (±20% from the base case values). present the inputs, which are associated with highest uncertainty in model results (ICER per QALY of Sequence 4: dasatinib → nilotinib compared to Sequence 6: nilotinib → dasatinib) for the imatinib-intolerant and imatinib-resistant population, respectively. Drug costs, time horizon, cytogenetic response rates for second-line dasatinib, utilities for responders, and discount rate, presented the biggest impact on model results.
Figure 4. (a) One-way sensitivity analysis for imatinib-intolerant population. (b) One-way sensitivity analysis for imatinib-resistant population. *The inputs were varied ± 20% from the base case values.
Discussion
In the absence of head-to-head trials of 2nd-line TKIs, this study compared the clinical outcomes, costs, and cost-effectiveness of sequences of TKI therapies, using the most recent clinical data and a switching algorithm based on treatment guidelines.
In this analysis, life expectancy and quality-of-life (measured by LYs and QALYs) were highest when using dasatinib as a 2nd-line TKI (Sequences 3 and 4), among patients who are resistant or intolerant to 1st line imatinib. These results are primarily attributable to higher cytogenetic response rates observed in clinical trials of 2nd-line dasatinib, when compared with trials of 2nd-line nilotinib and high-dose imatinib. Higher response rates translate to improved survival, as observed in multiple landmark analyses of patients achieving cytogenetic responses within the first 12 months of treatmentCitation21,Citation23. Response rates also influence QALYs, as studies have shown improved quality-of-life for responders vs non-respondersCitation32. For all patients, the higher costs of dasatinib sequences are attributable to the increased time on 2nd-line TKI treatment, as the average monthly cost of treatment with dasatinib is lower than that of nilotinib or high-dose imatinib.
Although treatment guidelines suggest dose escalation of imatinib after resistance to the standard dose, this analysis presents superior life expectancy and quality-of-life with dasatinib and nilotinib compared to high-dose imatinib. Sequences with high-dose imatinib were associated with the lowest survival and quality-adjusted life-years (Sequences 1 and 2), attributable to lower response rates and higher progression and mortality risk observed in clinical trials of 2nd-line imatinib use. The repeat use of imatinib in second-line, despite dose escalation, did not produce comparable outcomes to alternative TKIs, such as dasatinib and nilotinib.
Cytogenetic response rate was the key driver of model results. Since a head-to-head comparison is not available, the response outcomes were based on two separate clinical trials evaluating dasatinib and nilotinib after resistance or intolerance to imatinibCitation26,Citation29. The patient populations in these trials were similar in terms of age, gender, disease duration, and exposure to prior treatments (imatinib and interferon). However, the definition of imatinib-intolerant patients differed between the two trials; the intolerant patients in the dasatinib trial included patients who discontinued imatinib due to toxicities, whereas the nilotinib trial included patients who did not achieve a MCyR (which is a resistance component) or patients who discontinued due to toxicities. While assessing the imatinib-intolerant population, the model used a definition similar to the dasatinib trial (i.e., resistance on imatinib is not included); therefore, the response outcomes reported in the nilotinib trial may not be considered ideal due to inclusion of resistance component. Hence, we have tested a scenario where the response outcomes for nilotinib were assumed similar to dasatinib for imatinib-intolerant population; the estimated QALYs (7.5) and lifetime costs ($611,139) for nilotinib → dasatinib sequence increased compared to the model base case.
NCCN guidelines recommend treatment decisions to be based on molecular or cytogenetic response. However, some physicians may employ the use of either cytogenetic or QPCR testing, but not both, for measuring treatment response. We tested a scenario where only QPCR testing is available; the estimated costs (Δcost ≈$300,000–$400,000) and QALYs (ΔQALYs ≈2 years) were lower compared to the model base case. This is likely attributable to the lower proportion of patients achieving MMR compared to CCyR (∼20%); hence, a higher proportion of patients switch to an alternate TKI, which may lead to reduced survival and quality-adjusted life-years as they cycle through available treatments more quickly.
The results of this analysis are similar to the results of other published economic analyses, which reported that dasatinib offers improved survival and quality-of-life compared to nilotinib and high-dose imatinib at a higher cost for patients failing 1st line imatinib, and which used different inputs and modeling techniquesCitation7–11. However, Hoyle et al.Citation11, Rogers et al.Citation9, and Loveman et al.Citation10 predict higher ICERs per QALY gained than our model predictions. Furthermore, their estimated survival and quality-of-life are considerably higher (range of LYs = 11–15; range of QALYs = 6–8) than our model predictions (LYs = 6–8; QALYs = 2–5). This is likely attributable to the different approaches used during model development, such as exclusion of switching rules based on response in the first 12 months of TKI therapy.
This analysis adds to the evidence base for treating CML with TKIs in several ways. First, previously conducted economic analyses were based on short-term follow-up clinical trial dataCitation18,Citation26,Citation29, which introduces uncertainty around extrapolation of progression and survival. This analysis’ use of long-term follow-up dataCitation21,Citation23 may reduce the uncertainty, although treatment outcomes remain unclear beyond 6 years of follow-up. The use of long-term follow-up data also enabled our model to consider improved survival and progression-free survival for patients achieving MMR and CCyRCitation17,Citation36. Second, the analysis follows recommendations of NCCN guidelines for treatment decisionsCitation5; these guidelines apply to the majority of patients in chronic phase CML, although some patients will fall outside of the pathways used in the analysis either due to mutations or high levels of comorbidity. Treatment guidelines recommend treatment continuation conditional on achievement of ≥PCyR at 6 months and CCyR or MMR at 12 months; while other economic analyses assumed treatment until progression or drug-related toxicityCitation6,Citation9–11. The model structure of five health states (chronic phase second-line treatment, chronic phase third-line treatment, chronic phase post-TKI treatment, progressed, and death) and intermediate tunnel states on TKI treatment (no response, PCyR, CCyR, and MMR at 3, 6, 9, and 12 months) are designed to track changing response levels on TKI treatment with time. This capability of model design allows testing the implications of discontinuing treatment based on inadequate response, in line with NCCN recommendationsCitation5.
There are several limitations of this analysis. First, data gaps exist, especially for response, progression, and mortality risks, and assumptions were used to derive these long-term model inputs. Although the model uses most recently published clinical trial data, head-to-head comparisons are not available, so network meta-analysis of efficacy data are not feasible. In order to estimate efficacy inputs, a number of assumptions and interpolations were used for response rates, with extrapolations for transformation and death; however, the uncertainties in these inputs were tested in the scenario analyses, and the lifetime QALYs and costs were relatively unchanged across the scenarios. Second, this analysis assumes perfect compliance with the treatment switching algorithm, in terms of changing TKIs based on response levels at 6 and 12 months. In practice, it is possible that patients would continue to receive a given TKI beyond 12 months without a CCyR, in hopes that CCyR would be achieved with a slightly longer duration. Third, this analysis considers the choice of TKI treatments in chronic phase only. Although dasatinibCitation2 and nilotinibCitation3 are indicated for treatment of advanced phases, the modeled patients spend a substantially longer time in chronic phase than in advanced phases, in this analysis and other economic analysesCitation10. Therefore, the model was simplified to not include TKI sequences in advanced phases. Finally, the model does not consider the cost or effectiveness of stem cell transplant, which could be used to treat certain patients who are not good candidates for TKI treatment. Therefore, stem cell transplant is not a relevant comparator to the TKI treatments. Stem cell transplants could potentially be used after failure of third-line TKI treatment, but could bias model results in favor of less-effective TKI sequences; these patients would be more likely to fail TKI treatment and have a chance at curative stem cell therapy.
Conclusions
For patients resistant or intolerant to 1st-line treatment with imatinib, dasatinib is associated with higher survival and quality-adjusted survival compared to high-dose imatinib and to a smaller extent compared to nilotinib, at a lower monthly cost. The model findings are primarily based on higher cytogenetic response rates observed in clinical studies of dasatinib and are supported by other studies showing improved quality-of-life for responders, and improved survival for patients achieving cytogenetic response. Head-to-head studies of sequential use of dasatinib and nilotinib are needed to validate these findings. Furthermore, the impact of change in monitoring practice with regards to use of QPCR testing rather than expensive cytogenetic testing on cost and health outcomes needs to be evaluated in detail.
Transparency
Declaration of funding
Funding for this study and development of this manuscript was provided by Bristol-Myers Squibb.
Declaration of financial/other relationships
JW, IS, and AA are employees of Evidera, which has received research funds from Bristol-Myers Squibb in connection with conducting this study and development of this manuscript. EF, DM, and BB are employees of Bristol-Myers Squibb and own stock in the company. JME peer reviewers on this manuscript have no relevant financial or other relationships to disclose.
Acknowledgement
The cost-effectiveness model was developed by Evidera, Inc. (Evidera). Evidera (Lexington, USA) was contracted by Bristol-Myers Squibb to produce the economic models, analysis and manuscript. The authors would like to thank research scientist, statisticians, cost specialists at Evidera and colleagues at Bristol-Myers Squibb for their valuable insight.
References
- Casali PG, Jost L, Sleijfer S, et al. Soft tissue sarcomas: ESMO clinical recommendations for diagnosis, treatment and follow-up. Ann Oncol Off J ESMO 2008;19(2 Suppl):ii89-93
- Le Cesne A, Judson I, Crowther D, et al. Randomized phase III study comparing conventional-dose doxorubicin plus ifosfamide versus high-dose doxorubicin plus ifosfamide plus recombinant human granulocyte-macrophage colony-stimulating factor in advanced soft tissue sarcomas: a trial of the European Organization for Research and Treatment of Cancer/Soft Tissue and Bone Sarcoma Group. J Clin Oncol Off J Am Soc Clin Oncol 2000;18:2676-84
- Samuels BL, Chawla S, Patel S, et al. Clinical outcomes and safety with trabectedin therapy in patients with advanced soft tissue sarcomas following failure of prior chemotherapy: results of a worldwide expanded access program study. Ann Oncol Off J ESMO 2013;24:1703-9
- Jelic S, Kovcin V, Milanovic N, et al. Randomised study of high-dose epirubicin versus high-dose epirubicin-cisplatin chemotherapy for advanced soft tissue sarcoma. Eur J Cancer 1997;33:220-5
- O'Brien S, Radich J, Abboud C, et al. Chronic Myelogenous Leukemia, Version 1.2014. J Natl Compr Canc Netw 2013;11(11):1327-40
- Ghatnekar O, Hjalte F, Taylor M. Cost-effectiveness of dasatinib versus high-dose imatinib in patients with Chronic Myeloid Leukemia (CML), resistant to standard dose imatinib – a Swedish model application. Acta Oncol 2010;49:851-8
- Quissak C, Litalien G, Alves M. Cost-effectiveness analysis of dasatinib for the treatment of imatinib resistant or intolerant CML patients in Brazil. Value Health 2008; A64(Abstract)
- Sambrook J, Zou D, Taylor MJ, et al. Cost-effectiveness analysis in Canada of dasatinib versus imatinib for the treatment of chronic myelogenous leukemia in patients with imatinib resistance. Blood (ASH Annual Meeting Abstracts) 2007;110 (Abstract 3328)
- Rogers G, Hoyle M, Coon JT, et al. Dasatinib and nilotinib for imatinib-resistant or -intolerant chronic myeloid leukemia: systematic review and economic evaluation. Health Technol Assess 2012;16(22);1-410.
- Loveman E, Cooper K, Bryant J, et al. Dasatinib, high-dose imatinib and nilotinib for the treatment of imatinib resistant chronic myeloid leukaemia: a systematic review and economic evaluation. Health Technol Assess 2012;16(23):iii-xiii, 1-137
- Hoyle M, Rogers G, Moxham T, et al. Cost-effectiveness of dasatinib and nilotinib for imatinib-resistant or -intolerant chronic phase chronic myeloid leukemia. Value Health 2011;14:1057-67
- Taylor M, Lewis L, Lebmeier M, et al. An economic evaluation of dasatinib for the treatment of imatinib resistant patients with chronic myelogenous leukemia. Value Health 2011;14:A1-A214. Abstract
- Hochhaus A, Druker B, Sawyers C, et al. Favorable long-term follow-up results over 6 years for response, survival, and safety with imatinib mesylate therapy in chronic-phase chronic myeloid leukemia after failure of interferon-treatment. Blood 2008 Feb 1;111(3):1039-43.
- Eddy DM, Hollingworth W, Caro JJ, et al. Model transparency and validation: a report of the ISPOR-SMDM modeling good research practices task force-7. Value Health 2012;15:843-50
- FDA Drug Safety Communication. FDA requires multiple new safety measures for leukemia drug Iclusig; company expected to resume marketing. US Food and Drug Administration, 2013. http://www.fda.gov/Drugs/DrugSafety/ucm379554.htm. Accessed January 26, 2014
- US Food and Drug Administration. Synribo (Omacetaxine): Highlights of prescribing information. 2012. http://www.accessdata.fda.gov/drugsatfda_docs/label/2012/203585lbl.pdf. Accessed January 26, 2014
- Jabbour E, Kantarjian HM, Jones D, et al. Imatinib mesylate dose escalation is associated with durable responses in patients with chronic myeloid leukemia after cytogenetic failure on standard-dose imatinib therapy. Blood 2009;113:2154-60
- Kantarjian H, Pasquini R, Hamerschlak N. Dasatinib or high-dose imatinib for chronic-phase chronic myeloid leukemia after failure of first-line imatinib: a randomized phase 2 trial. Blood 2007;109:5143-50
- Weinstein MC, Siegel JE, Gold MR, et al. Recommendations of the panel on cost-effectiveness in health and medicine. JAMA 1996;276(15):1253-8.
- Shah NP, Kim D-W, Kantarjian H. Potent, transient inhibition of BCR-ABL with dasatinib 100 mg daily achieves rapid and durable cytogenetic responses and high transformation-free survival rates in chronic phase chronic myeloid leukemia patients with resistance, suboptimal response or intolerance to imatinib. Haematologica 2010;95:2154-60
- Shah NP, Guilhot F, Cortes JE, et al. Long-term outcome with dasatinib after imatinib failure in chronic-phase chronic myeloid leukemia: follow-up of a phase 3 study. Blood 2014;123:2317-24
- Garg RJ, Kantarjian H, O'Brien S, et al. The use of nilotinib or dasatinib after failure to 2 prior tyrosine kinase inhibitors: long-term follow-up. Blood 2009;114:4361-8
- Giles F, Coutre Pl, Pinilla-Ibarz J, et al. Nilotinib in imatinib-resistant or imatinib-intolerant patients with chronic myeloid leukemia in chronic phase: 48-month follow-up results of a phase II study. Leukemia 2013;27:107-12
- Kantarjian HM, Giles FJ, Bhalla KN, et al. Nilotinib is effective in patients with chronic myeloid leukemia in chronic phase after imatinib resistance or intolerance: 24-month follow-up results. Blood 2011;117:1141-5
- Khoury HJ, Cortes JE, Kantarjian HM, et al. Bosutinib is active in chronic phase chronic myeloid leukemia after imatinib and dasatinib and/or nilotinib therapy failure. Blood 2012;119:3403-12
- Kantarjian HM, Giles F, Gattermann N, et al. Nilotinib (formerly AMN107), a highly selective BCR-ABL tyrosine kinase inhibitor, is effective in patients with Philadelphia chromosome -positive chronic myelogenous leukemia in chronic phase following imatinib resistance and intolerance. Blood 2007;110:3540-6
- Kantarjian H, O'Brien S, Talpaz M, et al. Outcome of patients with Philadelphia chromosome-positive chronic myelogenous leukemia post-imatinib mesylate failure. Cancer 2007;109:1556-60
- Kantarjian H, Pasquini R, Lévy V, et al. Dasatinib or high-dose imatinib for chronic-phase chronic myeloid leukemia resistant to imatinib at a dose of 400 to 600 milligrams daily: two-year follow-up of a randomized phase 2 study (START-R). Cancer 2009;115(18):4136-47
- Shah NP, Kantarjian HM, Kim D-W, et al. Intermittent target inhibition with dasatinib 100 mg once daily preserves efficacy and improves tolerability in imatinib-resistant and -intolerant chronic-phase chronic myeloid leukemia. J Clin Oncol 2008;26:3204-12
- Pavey T, Hoyle M, Ciani O, et al. Dasatinib, nilotinib and standard-dose imatinib for the first-line treatment of chronic myeloid leukaemia: systematic reviews and economic analyses. Health Technol Assess 2012;16(42):iii-iv, 1-277
- Medicare 2014 outpatient payment fee schedule and physician fees. Centers for Medicare & Medicaid Services. Medicare Payment Limits File. 2014
- Szabo SM, Davis C, Cortes J, Holoyoake, Levy AR. A multinational study for patient preference values for health states for chronic myelogenous leukemia. Value Health 2010;13(1):103-11
- Redbook Online [online database]. Greenwood Village, CO: Truven Health Analytics. Accessed January 26, 2014
- Clayton B, Fein A, Gleason P, et al. 2013-2014 Prescription drug benefit cost and plan design report. Copayment for specialty at retail 30. Table 13. Average copayment Q20 amounts for four-tier plan designs. 2013. Pharmacy Benefit Management Institute. Available online: https://www.pbmi.com/shop/prescription-drug-benefit-cost-and-plan-designreports/2013-2014-prescription-drug-benefit-cost-plan-designreport/. Accessed January 26, 2014.
- Clayton B, Fein A, Gleason P, et al. 2013-2014 Prescription drug benefit cost and plan design report. Overall dispensing fee for branded drugs in specialty pharmacies. Q22 Table 25 Average [Median] dispensing fee by pharmacy channel. 2013. Pharmacy Benefit Management Institute. https://www.pbmi.com/shop/prescription-drug-benefit-cost-andplan-design-reports/2013-2014-prescription-drug-benefit-cost-plandesign-report/. Accessed January 26, 2014.
- Druker BJ, Guilhot F, O’Brien SG, et al. Five-year follow-up of patients receiving imatinib for chronic myeloid leukemia. N Engl J Med 2006;355:2408-17
- Jabbour E, Kantarjian HM, Saglio G, et al. Early response with dasatinib or imatinib in chronic myeloid leukemia: 3-year follow-up from a randomized phase 3 trial (DASISION). Blood 2014;123:494-500
Appendix: Model inputs
As explained in the ‘Efficacy Inputs’ section, modeled probabilities of response, transformation to advanced phases of CML, and death are based on clinical trials of dasatinib and nilotinib for treatment of patients failing 1st line imaitnib. This Appendix presents the details of derivations for the overall population; as described in the methods section, the model applies relative risks to probabilities estimated for the overall population.
Table A5. Second-line: observed and interpolated death probabilities.
Table A6. Third-line: observed and interpolated response rates on bosutinib.
Table A7. Third-line: observed and interpolated response rates on dasatinib/nilotinib.
Table A8. Third-line observed and interpolated probabilities of transformation on dasatinib/nilotinib and bosutinib.
Table A9. Third-line: observed and interpolated probabilities of death on dasatinib/nilotinib and bosutinib.
Table A1. Second-line: observed and interpolated CCyR rates.
Table A2. Second-line: observed and interpolated MCyR rates.
Table A3. Second-line: observed and interpolated MCyR rates.
Table A4. Second-line: observed and interpolated transformation probabilities.
Second-line
Response rates
CCyR
Shah et al.Citation20 was the only study that presented a Kaplan-Meier (KM) curve for the cumulative probability of achieving CCyR for patients who have previously failed imatinib therapy. A Weibull distribution was fit to the digitized KM curve for time to CCyR. Table A1 presents the observed data and the Weibull distribution estimates for CCyR on dasatinib.
None of the published studies of nilotinib as 2nd line treatment provide KM curves for time to CCyR. Kantarjian et al.Citation24 reported that 44% of patients on nilotinib achieved CCyR after a minimum follow-up of 24 months and Shah et al.Citation20 reported 50% achieved CCyR on dasatinib at 24 months. This represents a relative risk of CCyR achievement on nilotinib vs dasatinib of 0.88, which was applied to the Weibull distribution for CCyR on dasatinib. Table A1 presents the trial observed data and interpolated estimates for CCyR on nilotinib.
MCyR
A KM curve for time to MCyR is not available in published studies of dasatinib or nilotinib as 2nd line treatment. Shah et al.Citation20 reports that 50% of patients on dasatinib achieved CCyR and 63% achieved MCyR. This gives a relative risk of 1.26 for achieving MCyR vs CCyR for dasatinib. The probabilities of achieving MCyR at other time points are estimated by applying the relative risk to the probabilities of CCyR on dasatinib. Table A2 presents the observed data and MCyR estimates on dasatinib.
Kantarjian et al.Citation24,Citation26 report that 48% of patients on nilotinib achieved MCyR at 12 months, and 59% at 24 months. The model assumes that the relative risk ratio (1.26) of achieving MCyR vs CCyR on dasatinib is applicable to nilotinib as well, and applies the relative risk to the interpolated probabilities of CCyR on nilotinib. Table A2 provides a comparison of trial observed data and interpolated estimates for MCyR on nilotinib.
MMR
A KM curve for time to MMR is not available in published literature for patients receiving dasatinib or nilotinib as 2nd line treatment. In studies of dasatinib and nilotinib as first-line TKI treatments (DASISION and ENESTnd)Citation37, patients took longer to achieve MMR than CCyR. When Weibull distributions were fit to the digitized KM curves for CCyR and MMR in first-line studies, the shape parameter for time to MMR was approximately twice that of CCyR for dasatinib, nilotinib, and imatinib study arms. We assume that this relationship would also be observed if KM curves were available in second-line. Shah et al.Citation20 observed that 37% of patients achieved MMR at 24-month follow-up; with this information, and the derived shape parameter, the lambda parameter of the MMR Weibull distribution was estimated. Probabilities of achieving MMR on dasatinib between 3–18 months were estimated using the Weibull distribution and are presented in Table A3.
Kantarjian et al.Citation24 reported that 32% and 39% of patients on nilotinib had achieved MMR by 12 and 18 months. Compared with the predicted probabilities for MMR on dasatinib at 12 and 18 months, the relative risks are 1.321 and 1.25; the average relative risk (1.28) is applied to the probabilities of MMR at all time points for dasatinib. Table A3 shows the observed and interpolated probabilities of MMR on nilotinib.
Transformation to advanced phases
Shah et al.Citation21 observed that 10 of the 165 patients (6.06%) in the dasatinib 100 mg arm experienced transformation to advanced phases by 6 years. Using the reported estimates and assuming constant risk over time, the 3-month probability of experiencing transformation was estimated to be 0.26%. Table A4 presents the estimated cumulative probability of transformation, assuming a constant hazard.
Giles et al.Citation23 reported the KM curve for progression-free survival (inclusive of transformation to advanced phases, treatment failure, and death events). Using the proportion of patients experiencing transformation (10.8%), failure (85.3%), and death (3.9%), the cumulative probabilities of experiencing transformation, failure, and death were estimated from the progression-free survival curve. Table A4 provides the observed KM curve for progression-free survival (PFS), estimated probabilities of experiencing transformation, and transition probabilities for each cycle.
Mortality
Shah et al.Citation21 presents a KM curve for overall survival for patients receiving 2nd line dasatinib. Using the KM curve, the cumulative probability of death was estimated. Table A5 presents the estimated cumulative and incident probability of death.
Giles et al.Citation23 present a KM curve for progression-free survival (inclusive of progression, treatment failure, and death events). Using the proportion of patients experiencing progression (10.8%), failure (85.3%), and death (3.9%), the probability of death was estimated. Table A5 provides the observed KM curve for progression-free survival (PFS), estimated cumulative probability of death, and incident probability of death.
Third-line
Response rates
Bosutinib
Khoury et al.Citation25 reported patients achieving MCyR at 12.4 weeks, 24 weeks, and at the estimated mean of 12 months (based on the median of 8.3 months, and assuming the durations of treatment were exponentially distributed). A Weibull distribution was fit to these data in order to interpolate the probability of achieving MCyR on bosutinib between 3–18 months.
The probability of achieving CCyR was derived by applying the relative risk of achieving MCyR vs CCyR from Khoury et al.Citation25 (1.35) to the probability of achieving MCyR on bosutinib.
As with MMR estimation for second-line dasatinib, the Weibull parameters for bosutinib were estimated by doubling the Weibull shape parameter for MCyR, and solving for the lambda parameter using an MMR probability of 15% at ∼12 months (assumed mean duration of treatment in Khoury et al.Citation25). Table A6 shows the observed and interpolated response rates on bosutinib.
Dasatinib and Nilotinib
Garg et al.Citation22 observed a 32% probability of MCyR and a 24% probability of CCyR with a median follow-up of 13 months (range = 0.5–41 months) for patients with chronic CML who are treated with dasatinib or nilotinib after failure of two TKIs. The estimated probabilities for bosutinib MCyR and CCyR at 13 months are 36% and 27%, respectively (Table A6). This comparison suggests an average relative risk of 0.88 for MCyR and CCyR on dasatinib or nilotinib, vs bosutinib. To estimate the probabilities of MCyR and CCyR on dasatinib or nilotinib, the model applies the relative risk of 0.88 to the derived probabilities of MCyR and CCyR on bosutinib.
Twenty per cent of patients in Garg et al.Citation22 achieved MMR on dasatinib or nilotinib. Assuming that this probability applies at 13 months (as with MCyR and CCyR), and that there is a 17% chance of MMR with bosutinib at 13 months, the relative risk of MMR for dasatinib or nilotinib vs bosutinib is 1.17. This relative risk is applied to the derived probabilities of MMR on bosutinib. Table A7 shows the observed and interpolated response rates on dasatinib or nilotinib.
Transformation to advanced phases
Garg et al.Citation22 present a KM curve for event-free survival (inclusive of transformation to advanced phase, loss of response, and death) for patients receiving dasatinib or nilotinib after failure of two TKIs. In the study, out of 19 patients, nine had transformation, six had loss of response, and four died. By applying the proportion of patients with transformation (9/19 = 47.36%) to the digitized event-free survival curve, the probabilities of transformation are estimated. Table A8 provides the observed KM curve for event-free survival and estimated probabilities of experiencing transformation.
Khoury et al.Citation25 present the KM curve for progression-free survival for bosutinib, which includes 20 patients with transformation, 25 patients with lost response (patients had ‘unsatisfactory response’), and four dead patients. By applying the proportion of patients with transformation (20/49 = 40.81%) to the probabilities of progression events or death, the probabilities of transformation are estimated. Table A8 provides the observed KM curve for progression-free survival and estimated probability of experiencing transformation.
Mortality
Garg et al.Citation22 and Khoury et al.Citation25 present KM curves for overall survival on dasatinib or nilotinib, and bosutinib, respectively. Table A9 presents the probabilities of death, derived from the digitized KM curve for overall survival.