
Abstract
Objectives:
Atazanavir (ATV) and darunavir (DRV) are protease inhibitors approved for HIV treatment in combination with ritonavir (/r). The objectives of this study were to compare persistence (time to treatment discontinuation/modification), adherence, and healthcare costs among patients with human immunodeficiency virus (HIV) initiating ATV/r or DRV/r.
Methods:
This retrospective cohort study used commercial and Medicaid administrative insurance claims data. Patients initiating ATV/r or DRV/r from 2006–2013 with continuous enrollment for ≥6 months before and ≥3 months after initiation were included. Patients were followed from initiation until discontinuation/modification (≥30 day gap in ATV or DRV or initiation of a new antiretroviral medication), during which time adherence (proportion of days covered [PDC], with PDC ≥80% or 95% considered adherent) and per-patient per-month (PPPM) total healthcare costs were measured. DRV/r patients were propensity score matched to ATV/r patients at a 1:1 ratio to achieve balance on potentially confounding demographic and clinical factors. Commercial and Medicaid samples were analyzed separately, as were antiretroviral (ART)-naïve and experienced patients.
Results:
The final samples comprised 2988 commercially-insured and 1158 Medicaid-insured patients. There were no significant differences in hazards of discontinuation/modification between the ATV/r or DRV/r cohorts. With respect to odds of being adherent, the only marginally significant result was comparing odds of achieving PDC ≥80% among ART-naïve Medicaid patients, which favored ATV/r. All other adherence comparisons were not significant. Although ATV/r cohorts tended to have lower PPPM costs, the majority of these differences were not statistically significant.
Conclusions:
Patients with HIV treated with either ATV/r or DRV/r had similar time to treatment discontinuation/modification, adherence, and monthly healthcare costs. Results were similar across the pre-specified sub-groups. These findings are useful not only as an insight into clinical practice, but also as a resource for healthcare providers and payers evaluating treatment options for HIV+ individuals.
Introduction
For the more than 1.1 million people in the US living with human immunodeficiency virus (HIV) infection, antiretroviral therapy (ART) plays a vital role in maintaining or improving immune functionCitation1. While ART has been shown to extend the lives of individuals with HIV, patient adherence and persistence with treatment are necessary to maximize clinical benefitsCitation2,Citation3. Adherence rates of <80% have been associated with virologic failure in addition to development of drug-resistant HIVCitation4–6. Similarly, decreased persistence, indicated by treatment interruption and discontinuation, has been linked to antiretroviral drug resistance and increased mortalityCitation7. Although patient-related factors such as substance abuse, depression, and anxiety are often the primary contributors to non-adherence, medication factors, including dosing frequency, pill burden, and side-effects, have also been associated with reduced adherenceCitation8,Citation9. Healthcare providers may select a protease inhibitor (PI)-based regimen for patients with sub-optimal or unknown adherence, as PIs have a higher barrier to viral mutations and drug resistanceCitation10.
As part of the current guidelines for the use of antiretroviral agents developed by the US Department of Health and Human Services, atazanavir (ATV) boosted with ritonavir (/r) and darunavir (DRV) boosted with ritonavir (/r) are listed as ‘alternative’ and ‘recommended’ options for ART-naïve patients, respectivelyCitation10. Both are also approved for treatment-experienced patientsCitation11,Citation12. While the tolerability and metabolic effects of ATV and DRV have been studied extensively, to date, few analyses have included head-to-head comparisons of these two regimens. In the study presented here, we used US commercial and Medicaid administrative claims data to compare the persistence, adherence, and all-cause total healthcare costs among patients with HIV initiating ATV/r or DRV/r in a real world setting.
Methods
Study design and data source
This was a retrospective observational cohort study using the 2006–2013 Truven Health Analytics MarketScan Commercial Claims and Encounters (Commercial) and Multi-State Medicaid (Medicaid) databases. Both databases include inpatient medical, outpatient medical, and outpatient pharmacy claims. The Commercial database includes data for more than 50 million employees and their dependents (annually), covered under a variety of fee-for-service and managed care health plans. The Medicaid database contains data for over 8 million individuals (annually) covered by the Medicaid programs from 10 geographically dispersed states of varying size and sociodemographic composition. The release of additional identifying information regarding the states contained in the Medicaid database is restricted by confidentiality agreements. All records contained within the databases are statistically de-identified and fully compliant with the conditions designated by the Health Insurance Portability and Accountability Act (HIPAA) Privacy Regulations. Institutional Review Board approval was not required, as the data did not contain any individually identifiable data.
Patient selection and study period
Patients selected for this study were those aged 18 years or older who initiated an ATV/r or DRV/r regimen between July 1, 2006 and March 31, 2013. The date of initiation of ATV or DRV was defined as the index date, and the initiated PI (ATV or DRV) was known as the index therapy. Ritonavir boosting was defined as a claim for ritonavir within 7 days before, or 13 days after, the index ATV or DRV claim. In addition to the ATV/r or DRV/r component of the ART regimen, patients were required to have two nucleoside reverse transcriptase inhibitors (NRTIs: abacavir, didanosine, emtricitabine, lamivudine, stavudine, tenofovir, zidovudine, zalcitabine). All ART components of the index therapy filled within 14 days of the index date were considered part of the index therapy. If a patient had a claim for another ARV (other than ATV, DRV, ritonavir, or NRTIs) during the first 14 days after index date, they were excluded from the study. Patients were required to have continuous medical and pharmacy benefit enrollment for at least 6 months before the index date (baseline period) and at least 3 months after the index date; however, patients were not required to be on ATV/r or DRV/r for any pre-specified amount of time. During the 6-month baseline period and the 3-month period post-index, patients were required to have at least one inpatient or outpatient medical claim with an International Classification of Diseases, Ninth Revision, Clinical Modification (ICD-9-CM) diagnosis code for HIV infection (ICD-9-CM 042, 795.51, V08) in any diagnosis position on the claim. Patients who had prescription claims for ATV or DRV in the 6 months prior to the index date were excluded from the analysis.
The study period consisted of the 6-month baseline period prior to the index date, the index date, and the variable length follow-up period while on therapy. The follow-up period began with the index date and continued until the earliest of any of the following events: (1) a continuous gap of ≥30 days without index PI or ritonavir ‘on hand’ after the end of a prior prescription based on the service date and days’ supply field on prescription claims, (2) a prescription claim for a PI (other than index drug), a non-nucleoside reverse transcriptase inhibitor, a fusion inhibitor (enfuvirtide), or a CCR5 antagonist (maraviroc) that was not part of the initial regimen, (3) disenrollment from insurance benefits, or (4) the study end date of June 30, 2013. The follow-up period was not truncated by a claim for an integrase inhibitor so that the costs associated with this commonly-observed treatment modification (to increase effectiveness) would be included in cost estimatesCitation13,Citation14. However, a claim for an integrase inhibitor was considered a treatment modification, as described below.
Outcomes
The primary outcomes were persistence (operationalized as time to treatment discontinuation/modification) with and adherence to ATV or DRV, and healthcare costs. Time to treatment discontinuation/modification was defined as the number of days from the index date until a claim for an integrase inhibitor or the end of follow-up as described above, whichever happened first. Patients were classified as having discontinued/modified therapy if they experienced a 30-day gap without ATV or DRV ‘on hand’ or had a claim for any third agent that was not part of the initiated regimen, including integrase inhibitors. All other patients were considered censored at the end of follow-up. A sensitivity analysis using ≥60 days without drug ‘on hand’ in ATV, DRV, or ritonavir as the definition of a gap was conducted.
Adherence to index PI and all-cause healthcare costs were measured during the follow-up period. Adherence was measured using the proportion of days covered (PDC), which was calculated as the proportion of days that the patient had ATV or DRV ‘on hand’ during the follow-up period based on prescription fill dates and prescription days supplied. ART adherence was measured as a proportion, ranging from 0–100%, and as a series of categorical variables (e.g., PDC ≥80% vs PDC <80%, PDC ≥95% vs PDC <95%). All-cause healthcare costs were measured in per-patient per-month (PPPM) units to account for variability in the duration of follow-up. Costs were expressed in 2013 constant dollars, adjusted using the medical care component of the Consumer Price IndexCitation15, and included both insurer- and patient-paid portions. Inpatient admissions, emergency room visits, outpatient visits, and outpatient prescription costs were included.
Covariates
Covariates, including both demographic and clinical characteristics, are listed in and . Demographic characteristics were measured on the index date. Geographic region of residence was available for commercially-insured patients only; while race was only available for Medicaid patients. Timing of the index date based on changes in available darunavir formulations and dosing recommendations was captured as a categorical variable for the following time periods: July 1, 2006–October 20, 2008 (approval of twice daily dosing), October 21, 2008–December 12, 2010 (approval of once daily, two pill dosing for treatment-naïve patients), December 13, 2010–November 8, 2012 (approval of once daily, two pill dosing for treatment-experienced patients with no DRV resistance associated mutations), and November 8, 2012–March 31, 2013 (approval of once daily, one pill dosing). Clinical characteristics measured during the 6-month baseline period included measures of overall health and co-morbid conditions, including AIDS-defining conditionsCitation16, based on the presence of at least one non-diagnostic medical claim with relevant ICD-9-CM diagnosis code. Additionally, specific healthcare utilization and total all-cause healthcare costs in the baseline period were captured. ART characteristics, including the components of the initial ART regimen, were also measured. Lastly, ART status was captured as ART-experienced or ART-naïve based on the presence or absence of claims for antiretroviral medication prior to the index date using all available claims history starting in 2004.
Table 1. Demographic characteristics of unmatched patients with HIV initiating either ritonavir-boosted atazanavir or ritonavir-boosted darunavir antiretroviral regimens.
Table 2. Clinical characteristics of unmatched patients with HIV initiating either ritonavir-boosted atazanavir or ritonavir-boosted darunavir antiretroviral regimens during the 6 months prior to initiation.
Statistical analysis
Patients identified in the Commercial and Medicaid databases were analyzed separately as patients in the two databases may differ with respect to: socioeconomic status, which cannot be controlled for in claims databases, gender composition, insurance reimbursement rates, and other characteristics. Demographic and baseline clinical characteristics for ATV/r and DRV/r cohorts were compared in bivariate analyses using t-tests and chi-squared tests. Propensity score matching was conducted to achieve balance in all characteristics, listed in and , between the two cohorts. For the Medicaid sample, state of residence was also included in the propensity score model. Patients were directly matched 1:1 on prior ART status to allow for separate analysis within populations, since prior ART experience may affect the relationship between index therapy and outcomes. Balance was assessed using standardized differencesCitation17.
Results from models are presented overall and separately for ART-naïve and ART-experienced patients. In the matched samples, time to treatment discontinuation/modification was modeled using Cox proportional hazards regression. Odds of being adherent (PDC ≥80% or PDC ≥95%) were evaluated using logistic regression models. Only patients with a follow-up period of >30 days were included in this analysis, as patients with less follow-up were likely to have artificially high PDC values (e.g., a patient who fills only one 30-day prescription before discontinuing has a PDC of 100%). Finally, log-linear regression models were fit to compare PPPM healthcare costs between the two cohorts and incremental cost differences were generated. P-values less than 0.05 were considered statistically significant. Analyses were conducted using SAS 9.3.
Results
Patient sample
Between July 1, 2006 and March 31, 2013, there were 21,745 patients initiating an ATV/r or DRV/r regimen in the Commercial database and 11,967 patients in the Medicaid database. After applying the study inclusion and exclusion criteria, the final unmatched study sample comprised 4303 Commercial and 2967 Medicaid patients. In the Commercial database, 2732 patients initiated ATV/r, while 1571 initiated DRV/r, and, in the Medicaid database, 2171 patients initiated ATV/r and 796 initiated DRV/r (Supplemental Table 1).
displays the baseline demographic characteristics of the unmatched study sample. In both the Commercial and Medicaid databases, ATV/r and DRV/r patients had similar mean age. In both samples, the DRV/r cohort had a significantly larger proportion of male patients. Prior to matching, patients initiating ATV/r were generally healthier during the baseline period than patients initiating DRV/r, as shown in . A significantly smaller proportion of ATV/r patients had a hospitalization or a diagnosis of an AIDS-defining condition during the baseline period. Across cohorts, less than half of the patients were ART-experienced, with a significantly greater proportion of DRV/r patients being ART-experienced compared to ATV/r patients (45.3% vs 42.1% in Commercial, p = 0.042 and 47.4% vs 41.2% in Medicaid, p = 0.003 for DRV/r and ATV/r, respectively). The majority of patients in both samples initiated tenofovir and emtricitabine as part of their initial regimen.
Treatment discontinuation/modification, adherence, and costs
After propensity score matching, there were 2988 commercially-insured and 1518 Medicaid-insured HIV patients initiating ATV/r or DRV/r. Adequate balance was achieved on all included demographic and clinical characteristics except for distribution of the timing of index date, which was then included as a covariate in the subsequent models. The average follow-up period was ∼11 months for patients in the Commercial sample and ∼9 months for patients in the Medicaid sample. Results for the three outcomes in the matched samples are presented in and and .
Figure 1. Hazard ratio of time to treatment discontinuation/modification among propensity score matched ATV/r and DRV/r cohorts. Abbreviations: ART=antiretroviral therapy; ATV/r=ritonavir boosted atazanavir; CI = confidence interval; DRV/r = ritonavir boosted darunavir.
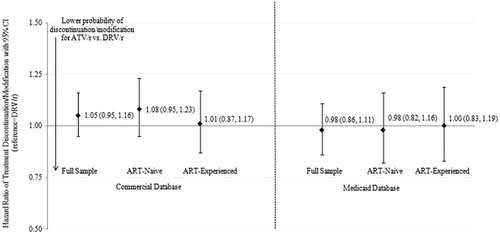
Figure 2A & B. Odds ratio of being adherent (PDC > = 80% or PDC > = 95%) among propensity score matched ATV/r and DRV/r cohorts Abbreviations: ART = antiretroviral therapy; ATV/r = ritonavir boosted atazanavir; CI = confidence interval; DRV/r=ritonavir boosted darunavir, PDC=proportion of days covered.
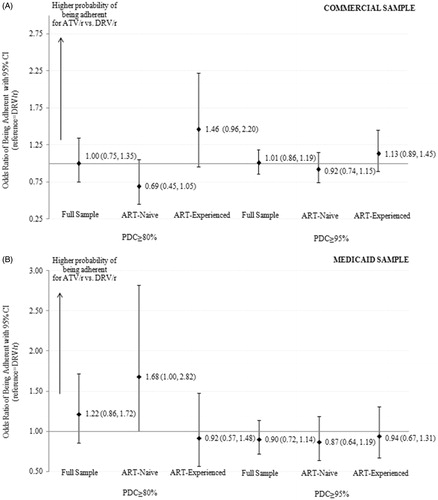
Table 3. Propensity score matched results comparing treatment discontinuation/modification, adherence, and all-cause healthcare costs among patients with HIV initiating ritonavir-boosted atazanavir or ritonavir-boosted antiretroviral regimens.
Across the cohorts, the average time to treatment discontinuation/modification or censoring ranged from 8–12 months. In the Commercial matched sample, the incidence rates of treatment discontinuation/modification ranged from 53.4 events per 100 person years (PYs) in the ART-experienced DRV/r cohort to 60.3 per 100 PYs in the ART-naïve ATV/r cohort. The incidence rates in the Medicaid matched sample were notably higher, ranging from 82.5 per 100 PYs in the ART-naïve ATV/r cohort to 95.0 per 100 PYs in the ART-naïve DRV/r cohort (). The hazard ratios comparing treatment discontinuation/modification between the two cohorts were insignificant in all samples with the effect estimates near 1.00 (). In the sensitivity analysis, when the length of the allowable gap was increased from 30 days to 60 days, the treatment discontinuation/modification rates fell to 48.2 per 100 PYs for the ATV/r cohort and 45.0 per 100 PYs for the DRV/r cohort in the Commercial sample. Similarly, the rates fell to 70.8 per 100 PYs for the ATV/r cohort and 80.0 per 100 PYs for the DRV/r cohort in the Medicaid sample. All model estimates comparing hazards of treatment discontinuation/modification between cohorts were non-significant in the sensitivity analysis.
During the follow-up period, between 85–95% of patients in the study cohorts had a PDC ≥80% and between 50–66% had a PDC ≥95% (). In the Commercial sample, there were no significant differences in the odds of being adherent between the ATV/r and DRV/r cohorts using either the 80% or the 95% cut-off (). In the ART-naïve Medicaid sample, the comparison of odds of having PDC ≥80% was marginally significant and favored ATV/r. All other adherence results were non-significant.
Unmatched analyses of all-cause PPPM healthcare costs revealed that initiators of DRV/r tended to have greater total and service-specific costs, although the differences were not always statistically significant (Supplemental Table 2). In both the Commercial and Medicaid samples, unmatched outpatient pharmacy prescription costs were significantly greater in the DRV/r cohort (p < 0.001). After matching, median all-cause PPPM healthcare costs were ∼$3000 for the patient samples (). In all models, the ATV/r cohort tended to have 5–15% lower costs than the DRV/r cohort; these cost differences were significant only in the full Commercial sample.
Discussion
In this real-world analysis of commercially-insured and Medicaid-insured patients with HIV initiating ATV/r or DRV/r, no evidence of differences in persistence or adherence were found. All-cause monthly healthcare costs while on therapy tended to be lower for ATV/r patients, although these differences were not statistically significant in all models. The results were consistent within sub-groups of ART-naïve and ART-experienced patients. This analysis is the first to compare these outcomes among patients initiating these ART regimens using two large claims databases.
Given that both ATV/r and DRV/r are the most commonly used PIs, the similarities and differences in important health outcomes such as treatment persistence, adherence, and healthcare costs among patients initiating these two PIs are particularly relevant and clinically important. Previous research in the Medicaid database found that initiation of preferred ART regimens (based on the March 2012 guidelines) was associated with lower hazards of discontinuation and greater odds of being adherent vs non-preferred regimensCitation18. There were no significant differences found in monthly healthcare costsCitation18. However, the main analysis evaluated preferred regimens as a whole and did not specifically compare ATV/r-based regimens vs DRV/r-based regimens. A sub-analysis compared preferred regimens ATV/r plus tenofovir/emtricitabine, DRV/r plus tenofovir/emtricitabine, raltegravir plus tenofovir/emtricitabine to efavirenz/tenofovir/emtricitabine in terms of adherence and monthly costsCitation19,Citation20. In the unadjusted sub-analysis, a larger proportion of ATV/r patients were adherent (PDC ≥80%) compared to DRV/r patients (85.9% vs 81.6%, p = 0.261)Citation19. Unadjusted PPPM costs were lower for ATV/r patients than for DRV/r patients ($4379 vs $4925, p = 0.445), but these differences were not statistically significantCitation20. Sample sizes for ATV/r (n < 500) and DRV/r (n < 150) in this Medicaid-based sub-analysis were smallCitation19,Citation20.
To our knowledge, there are no published analyses directly comparing these two regimens in terms of persistence and adherence in a real-world setting. Other outcomes have been compared between the two PIs such as tolerability and efficacy. An analysis of medically-attended adverse events in Medicaid claims data reported that patients on ATV/r had significantly fewer gastrointestinal issuesCitation21. DRV/r patients had fewer jaundice events, although the number of events in the study population was very smallCitation21. Monthly all-cause healthcare costs were evaluated in that analysis, with ATV/r patients having significantly lower average PPPM costs (unadjusted mean monthly costs: ATV/r = $3879 vs DRV/r = $5354; adjusted cost difference = $1086, p-value <0.001)Citation21.
Several analyses have focused on clinical outcomes. Most have found that outcomes, such as bone mineral density lossesCitation22, fasting lipids and development of metabolic syndromeCitation23, hepatoxicity among individuals without hepatitis CCitation24, and metabolic profileCitation25, were similar between ATV/r and DRV/r arms. However, some analyses have noted differences. Stein et al.Citation26 reported that carotid artery intima-media thickness, a surrogate marker of cardiovascular disease, progressed more slowly in ATV/r patients over a 3-year follow-up. Saumoy et al.Citation27 found an increase in low-density lipoprotein in DRV/r patients, but an increase in triglycerides in ATV/r patients. A 2015 study by Martinez et alCitation28 also found that ATV/r was associated with higher triglycerides and subcutaneous fat and an analysis published in 2014, reported no differences in total cholesterolCitation29.
Additionally, a study conducted by the AIDS Clinical Trial Group known as ACTG 5257 compared ATV/r, DRV/r, and the integrase inhibitor raltegravir, in terms of virologic failure and discontinuation due to lack of tolerabilityCitation30. The analysis was an open label trial in which ART-naïve patients were randomized to receive one of the three medications and were followed prospectively for 2–4 yearsCitation30. The three medications had equivalent rates of virologic failureCitation30. However, the cumulative incidence of discontinuation due to a tolerability issue was significantly larger among patients initiating ATV/r (14% of patients) compared to those initiating DRV/r (5% of patients) and raltegravir (1% of patients), primarily due to discontinuations due to jaundice/hyperbilirubinemiaCitation30. The researchers also analyzed a composite outcome of virologic failure and tolerability and found that raltegravir was superior to both ATV/r and DRV/r. DRV/r was found to be superior to ATV/r. In an Italian-based analysis by Cozzi-Lepri et al.Citation31, 9.8% of ATV/r patients and 6.5% of DRV/r patients (p = 0.04) discontinued due to intolerance/toxicity over a 2 year follow-up. In a multivariable model controlling for patient characteristics, ATV/r was associated with significantly increased risk of discontinuation due to intolerance/toxicity (HR = 2.01, 95% CI = 1.23–3.28)Citation31. However, there were no significant differences between the two groups when all-cause discontinuation was evaluatedCitation31. Lastly, an analysis by Jarrin et al.Citation32 found that the rates of treatment modification to initiated ART was similar for ATV/r patients (30.2 per 100 person-years, 95% CI = 21.4–42.4) and DRV/r patients (26.0, 95% CI = 15.7–43.1) in a Spanish cohort.
The incidence of discontinuation for participants in the studies described above, regardless of therapy, is much lower overall than what is reported for the present claims-based study. There may be several explanations related to differences in study design. First, absolute rates of discontinuation are affected by the definition of discontinuation. The ACTG 5257 analysis considered discontinuation due to lack of tolerability or virologic failure as failure events, whereas the study presented here considers all-cause discontinuation, which could encompass other reasons, such as economic hardship or other circumstances. Reasons for discontinuation are not available in claims data. Discontinuation rates are also affected by the length of allowable gaps in therapy in claims-based analyses. In a sensitivity analysis in this study, when the length of the allowable gap was increased from 30 days to 60 days, the discontinuation/modification rates were smaller for both cohorts in both samples compared to the main analysis. This is because patients were allowed to have a larger number of days without drug ‘on hand’ after the end of the prior prescription. The effect of changing the definition of the allowable gap would not be expected to differ between ATV/r and DRV/r patients unless planned or unplanned treatment holidays between 30–60 days long were more common in one group than the other. This may have occurred with earlier formulations of DRV which required patients to take more doses per day compared to ATV, which, in turn, meant patients had a larger number of pills per fill. This could have resulted in different dosing patterns. Second, treatment discontinuation in a clinical trial or prospective cohort setting may be less common than in the real-world because the frequent contact with study personnel and distribution of medications through regular visits as part of the clinical trial/cohort may increase persistence and adherence to study medications.
While rates of discontinuation may differ by study design, they may also differ by the populations analyzed. The current analysis showed a notable difference between incidence of treatment discontinuation/modification in the Commercial and Medicaid samples. Overall, the incidence rate of discontinuation/modification in the Commercial sample was 56.1 per 100 PYs compared to 90.2 per 100 PYs in Medicaid. Differences in ART persistence between the two populations have not been described thoroughly in the literature. Published analyses have largely focused on the differences in timing of ART initiation where the results still remain unclear. One analysis of women only found that having private insurance was associated with significantly increased odds of not being on ART, after controlling for race and lifestyle factorsCitation33. Another analysis found that patients insured through Medicaid initiated ART at significantly lower CD4 counts than patients with commercial insuranceCitation34. More research is needed to explain the differences in persistence reported in the two populations here. Potential explanations that should be evaluated include differences in adherence resulting in treatment failure and the need to change regimens, differences in the use of concomitant medications as they may impact tolerability, and differences in socioeconomic or lifestyle factors which may affect an individual’s ability to fill his or her ART prescriptions.
This analysis has limitations that should be noted. First, administrative claims data are collected for billing purposes. Diagnostic coding, including failure of diagnoses to be coded, may be driven by reimbursement rather than clinical factors. This could result in non-differential misclassification of clinical characteristics. Second, only ART prescriptions covered by commercial and Medicaid insurance appear in the MarketScan databases. ART prescriptions filled through other mechanisms or provided as samples are not captured. Third, the calculations of persistence and adherence are based on service dates and days’ supply field on prescription claims, rather than patient self-report or other types of measurements. It is assumed that patients took the medication as directed. Fourth, payments on capitated claims are not available and, therefore, were imputed based on the average payments for non-capitated claims in the MarketScan data in the same year and region with the same procedure code. These measurement caveats are the same for both PI cohorts. Fifth, as this was an observational analysis, the possibility of uncontrolled confounding exists even after controlling for measured confounders through propensity score matching and regression adjustment. For example, controlling for index year may not fully account for the effect of differences in drug formulations of DRV during the study period. Additionally, although patients were classified as treatment-naïve and treatment-experienced to reduce differences between the cohorts, complete treatment history was not available. Therefore, patients may be misclassified as treatment-naïve and the treatment-experienced. Within the treatment-experienced group, heterogeneity may still exist with regards to prior treatments and other treatment-related characteristics. If prior treatments or other characteristics differed between the ATV/r and DRV/r treatment-experienced cohorts which were associated with the study outcomes, our results may be biased. Lastly, these results may not be generalizable to patients insured through Medicare or to patients who are uninsured.
Both ATV and DRV fixed dose combinations with cobicistat, a pharmacokinetic enhancer, have been approved in the US, which may improve adherence when compared with regimens with ritonavir. Whereas ATV/r and DRV/r comprise two separate pills, the ATV and DRV fixed doses combinations with cobicistat are combined in a single pill, resulting in a reduction in pill burden for patients on these therapies. In addition to the anticipated overall improvement in adherence and persistence related to decreased pill burden, there may be other differential factors that lead to differences in outcomes with the new formulations of ATV and DRV. This analysis should be updated when sufficient real-world data exists with the use of ATV and DRV fixed dose combinations with cobicistat in the US.
Conclusion
The analysis included large samples of HIV patients insured through commercial plans and Medicaid. After propensity score matching, there was no evidence of differences in terms of time to treatment discontinuation/modification or adherence between patients with HIV initiating ATV/r regimens and patients initiating DRV/r regimens. While ATV/r patients tended to have lower all-cause costs, these differences were generally not statistically significant. This analysis is important because it is reflective of clinical practice and real-world outcomes for two populations insured through different mechanisms. When considering initiation of a PI-containing regimen, these findings may prove beneficial to healthcare providers, payers, and HIV+ patients, as treatment patterns and costs are important to understand when treating a chronic condition.
Transparency
Declaration of funding
Truven Health Analytics was provided funding by Bristol-Myers Squibb to conduct this research.
Declaration of financial/other relationships
CR and LR are employees of Bristol-Myers Squibb. AMF, SSJ, and MB are employees of Truven Health Analytics.
Supplemental_Tables.docx
Download MS Word (15.7 KB)Acknowledgments
The authors would like to acknowledge Boris Ivanov and Bong Chul Chu of Truven Health Analytics for programming and statistical support.
References
- Monitoring selected national HIV prevention and care objectives by using HIV surveillance data–United States and 6 U.S. dependent areas–2011. Atlanta, GA: Centers for Disease Control and Prevention, 2013. http://www.cdc.gov/hiv/pdf/2011_Monitoring_HIV_Indicators_HSSR_FINAL.pdf. Accessed September 30, 2014
- Bhaskaran K, Hamouda O, Sannes M, et al. Changes in the risk of death after HIV seroconversion compared with mortality in the general population. JAMA 2008;300:51-9
- Lima VD, Harrigan R, Bangsberg DR, et al. The combined effect of modern highly active antiretroviral therapy regimens and adherence on mortality over time. J Acquir Immune Defic Syndr 2009;50:529-36
- Maggiolo F, Ravasio L, Ripamonti D, et al. Similar adherence rates favor different virologic outcomes for patients treated with nonnucleoside analogues or protease inhibitors. Clin Infect Dis 2005;40:158-63
- Nachega JB, Hislop M, Dowdy DW, et al. Adherence to nonnucleoside reverse transcriptase inhibitor-based HIV therapy and virologic outcomes. Ann Intern Med 2007;146:564-73
- Sethi AK, Celentano DD, Gange SJ, et al. Association between adherence to antiretroviral therapy and human immunodeficiency virus drug resistance. Clin Infect Dis 2003;37:1112-18
- Bae JW, Guyer W, Grimm K, et al. Medication persistence in the treatment of HIV infection: a review of the literature and implications for future clinical care and research. AIDS 2011;25:279-90
- O'Connor JL, Gardner EM, Mannheimer SB, et al. Factors associated with adherence amongst 5295 people receiving antiretroviral therapy as part of an international trial. J Infect Dis 2013;208:40-9
- Sax PE, Meyers JL, Mugavero M, et al. Adherence to antiretroviral treatment and correlation with risk of hospitalization among commercially insured HIV patients in the United States. PLoS One 2012;7:e31591
- Guidelines for the use of antiretroviral agents in HIV-1-infected adults and adolescents. Washington, DC: Department of Health and Human Services Panel on Antiretroviral Guidelines for Adults and Adolescents, http://aidsinfo.nih.gov/ContentFiles/AdultandAdolescentGL.pdf. Accessed May 6, 2015
- Reyataz Prescribing Information. Princeton, NJ: Bristol-Myers Squibb, 2015. http://packageinserts.bms.com/pi/pi_reyataz.pdf. Accessed May 6, 2015
- Prezista Prescribing Information. Titusville, NJ: Janssen Pharmaceuticals, 2013. https://www.prezista.com/sites/default/files/pdf/us_package_insert.pdf. Accessed May 6, 2015
- Cahn P, Pozniak AL, Mingrone H, et al. Dolutegravir versus raltegravir in antiretroviral-experienced, integrase-inhibitor-naïve adults with HIV: week 48 results from the randomised, double-blind, non-inferiority SAILING study. Lancet 2013;382:700-8
- Molina JM, Lamarca A, Andrade-Villanueva J, et al. Efficacy and safety of once daily elvitegravir versus twice daily raltegravir in treatment-experienced patients with HIV-1 receiving a ritonavir-boosted protease inhibitor: randomised, double-blind, phase 3, non-inferiority study. Lancet Infect Dis 2012;12:27-35
- Consumer Price Index Detailed Report January 2014. Washington, DC: US Bureau of Labor Statistics, http://www.bls.gov/cpi/cpid1401.pdf. Accessed September 30, 2015
- AIDS-defining conditions, ICD-9-CM codes for AIDS indicator diseases. Harrisburg, PA: Pennsylvania Department of Health. http://www.portal.state.pa.us/portal/server.pt/community/hiv___aids/14241/attachment_archive/557348. Accessed February 6, 2015
- D'Agostino RB Jr. Propensity score methods for bias reduction in the comparison of a treatment to a non-randomized control group. Stat Med 1998;17:2265-81
- Johnston SS, Juday T, Farr AM, et al. Comparison between guideline-preferred and non-preferred first-line HIV antiretroviral therapy. Am J Manag Care 2014;20:448-55
- Juday T, Farr AM, Johnston SS, et al. Antiretroviral adherence among Medicaid-insured HIV patients initiating current guideline-preferred antiretroviral therapy regimens. Poster presented at: International Society of Pharmacoeconomics and Outcomes Research 18th Annual International Meeting; May 2013; New Orleans, LA
- Juday T, Johnston SS, Farr AM, et al. Healthcare expenditures among Medicaid-insured HIV patients initiating antiretroviral therapy regimens “preferred” under current treatment guidelines in the United States. Poster presented at: International Society of Pharmacoeconomics and Outcomes Research 18th Annual International Meeting; May 2013; New Orleans, LA
- Johnston SS, Juday T, Esker S, et al. Comparative incidence and health care costs of medically attended adverse effects among U.S. Medicaid HIV patients on atazanavir- or darunavir-based antiretroviral therapy. Value Health 2013;16:418-25
- Brown TT, Moser C, Currier J, et al. Changes in bone mineral density after initiation of antiretroviral treatment with tenofovir disoproxil fumaratre/emtricitabine plus atazanavir/ritonavir, darunavir/ritonavir, or raltegravir. J Infect Dis 2015;212:1241-9
- Ofotokun I, Na LH, Landovitz RJ, et al. Comparison of the metabolic effect of ritonavir-boosted darunavir or atazanavir versus raltegravir, and the impact of ritonavir plasma exposure: ACTG 5257. Clin Infect Dis 2015;60:1842-51
- Lapadula G, Costarelli S, Chatenoud L, et al. Risk of liver enzyme elevation during treatment with ritonavir-boostesd protease inhibitors among HIV mono-infected and HIV/HCV-coinfected patients. J Acquir Immune Defic Syndr 2015;69:312-18
- Aberg JA, Tebas P, Overton ET, et al. Metabolic effects of darunavir/ritonavir versus atazanavir/ritonavir in treatment-naïve, HIV type 1-infected subjects over 48 weeks. AIDS Res Hum Retroviruses 2012;28:1184-95
- Stein JH, Ribaudo HJ, Hodis HN, et al. A prospecitve randomized clinical trial of antiretroviral therapies on carotid wall thickness. AIDS 2015;29:1775-83
- Saumoy M, Ordonez-Llanos J, Martinez E, et al. Atherogenic properties of lipoproteins in HIV patients starting atazanavir/ritonavir or darunavir/ritonavir: a substudy of the ATADAR randomized study. J Antimicrob Chemother 2015;70:1130-8
- Martinez E, Gonzalez-Cordon A, Ferrer E, et al. Differential body composition effects of protease inhibitors recommended for initial treatment of HIV infection: a randomized clinical trial. Clin Infect Dis 2015;60:811-20
- Martinez E, Gonzalez-Cordon A, Ferrer E, et al. Early lipid changed with atazanavir/ritonavir or darunavir/ritonavir. HIV Med 2014;15:330-8
- Lennox JL, Landovitz RJ, Ribaudo HJ, et al. Efficacy and tolerability of 3 nonnucleoside reverse transcriptase inhibitor-sparing antiretroviral regimens for treatment-naïve volunteers infected with HIV-1: a randomized, controlled equivalence trial. Ann Intern Med 2014;161:461-71
- Cozzi-Lepri A, Antinori A, Bonora S, et al. An observational comparison of first-line combination antiretroviral treatment (cART) with 2 NRTI and ATV/r or DRV/r in HIV-infected patients in Italy. J Int AIDS Soc 2014;17(4 Suppl 3):19771
- Jarrin I, Hernandez-Novoa B, Alejos B, et al. Persistence of novel first-line antiretroviral regimes in a cohort of HIV-positive subjects, CoRIS 2008-2010. Antivir Ther 2013;18:161-70
- Lillie-Blanton M, Stone VE, Jones AS, et al. Association of race, substance abuse, and health insurance coverage with use of highly active antiretroviral therapy. Am J Public Health 2010;100:1493-9
- Schneider G, Juday T, Wentworth C 3rd, et al. Impact of health care payer type on HIV stage of illness at time of initiation of antiretroviral therapy in the USA. AIDS Care 2013;25:1470-6