
Abstract
Objective:
To examine direct cost to patients associated with oral oncolytics for the management of multiple myeloma (MM) both before and after financial assistance, and assess the effect on adherence.
Methods:
In this retrospective study, pharmacy claims were analyzed for those patients with a diagnosis of MM who received thalidomide, lenalidomide, or pomalidomide from a large specialty pharmacy in the US between January 1, 2011, and December 31, 2013. Average direct cost to patients, per prescription, was analyzed both before and after financial assistance. Adherence was assessed through an analysis of medication possession ratio (MPR) for those patients who filled a prescription ≥2 times throughout the 3-year time period.
Results:
A total of 77,821 prescriptions for thalidomide, lenalidomide, and pomalidomide were filled by 6731 unique patients between January 1, 2011, and, December 31, 2013. The average direct cost to patients, per prescription, for any of these three agents was $227.23 prior to financial assistance and $80.11 after financial assistance, representing an average patient savings of $147.14 per prescription. Prior to financial assistance, the average direct cost to patients was ≤$50 for 57.6% of all prescriptions. After financial assistance, 86.2% of patients had a direct cost of ≤$50 per prescription. Adherence, as assessed by MPR, did not vary significantly based on direct cost to the patient.
Limitations:
This study included patients receiving therapy from a single specialty pharmacy for a single indication. There may be patients included in the analysis who received prescriptions from other pharmacies prior to or after the prescriptions available for analysis. Most of the prescriptions included in the analysis were for lenalidomide.
Conclusions:
This retrospective study demonstrated that the specialty pharmacy helped patients significantly reduce their direct cost expenditures by securing funding and co-pay assistance.
Introduction
The costs associated with cancer care in the US have been steadily increasing, with more dramatic increases expected in the years to comeCitation1. The National Cancer Institute has estimated that cancer care accounted for ∼$125 billion in medical care expenditures in the US in 2010Citation2. This cost is expected to increase to ∼$160 billion by 2020Citation2. While the cost of cancer care increases, concerns are mounting regarding the potential influence of patient out-of-pocket (OOP) costs related to drug therapy, and how these increases may affect therapy abandonment, drop-off, and overall adherenceCitation3–6.
Multiple myeloma (MM) is a form of cancer that develops in plasma cells, a type of white blood cellCitation7. Proliferation of malignant cells ultimately leads to destruction of the bone and marrow failureCitation7. MM is ranked as the 14th most common cancer diagnosis and currently represents 1.4% of all new cancersCitation8. While MM remains an incurable illness with currently available treatment options, a rapidly evolving treatment landscape has led to improvements in projected response ratesCitation7. Patients diagnosed with myeloma in 1975 had a 5-year survival rate of 26.3%Citation7. This 5-year survival rate improved to 39.5% in 2002 and further increased to 45.1% between 2004 and 2010Citation8. Improvements in survival rates have been influenced by the introduction of novel therapies, including the oral oncolytic thalidomide and its analogs lenalidomide and pomalidomide, which all possess immunomodulatory, antiangiogenesis, and anti-tumor propertiesCitation7,Citation9. In addition, the injectable proteasome inhibitors bortezomib and carfilzomib have also played a role in improving patient outcomesCitation7. As drug development moves toward identification of the ideal regimen for the treatment of MM, further improvements in outcomes are anticipatedCitation7,Citation10.
Although the increased availability of novel oncolytics for the management of MM and other cancers has allowed for improvements in outcomes, cost has become a growing concern for both payers and patientsCitation11. Costs associated with the treatment of MM include therapy itself, procedures, tests, and other indirect costs of care such as travel, lodging, and timeCitation12. In a study designed to assess the personal financial effects of MM and its treatment, the mean percentage of patient income used for MM-related expenses was 36% during the first 12 months of treatment and 28% during the most recent 12 monthsCitation12. These percentages were determined based on an average of patient-reported percentages, as collected via a mailed questionnaireCitation12. Previously published literature has not specifically evaluated the direct cost to patients, in the form of prescription co-pays, associated with oral oncolytics used for the treatment of MM.
Multiple studies have established an inverse relationship between patient OOP costs, including all medical care expenditures that are not reimbursed by insurance, and oral oncolytic adherenceCitation5,Citation13. Specialty pharmacies are uniquely positioned to understand the direct cost to patients associated with oral oncolytic therapies. For the purposes of this study, direct cost to patients is defined as cost left uncovered by insurance, or the co-pay or co-insurance incurred for an individual prescription. Given the growing concerns related to the cost of cancer care for patients with a diagnosis of MM, we conducted a study at a large specialty pharmacy in the US to examine direct cost to patients, both before and after financial assistance, and its effect on adherence.
Growing costs associated with the treatment of MM may largely be attributed to increased survival as well as the predominance of branded agents among the preferred available treatment optionsCitation11. Some payers have reacted to the cost concerns for oncology products by imposing higher cost sharing and co-pays for cancer treatments, particularly for oral oncology agents; as a result, various sources of financial assistance have emerged to alleviate patient financial burdenCitation13,Citation14. We sought to assess the ability of a specialty pharmacy to impact the direct cost to patients associated with the treatment of MM using thalidomide, lenalidomide, and pomalidomide through co-ordination of financial assistance. Use of these three oral oncolytics for the treatment of MM is consistent with National Comprehensive Cancer Network guidelinesCitation7. We hypothesized that co-ordination of financial assistance at a specialty pharmacy would significantly reduce direct cost to patients for treatment of MM using oral oncolytic therapy.
Patients and methods
This retrospective study evaluated patients with a diagnosis of MM who received thalidomide, lenalidomide, or pomalidomide from a large specialty pharmacy in the US between January 1, 2011, and December 31, 2013. The study was initiated with the collection of all oncology pharmacy claims data from a pharmacy claims database for the defined date range. This time period of 3 calendar years was selected to ensure a large sample size and capture variations in co-pay related to seasonality of insurance deductibles. A total of 397,838 oncology claims were submitted, and 335,186 of those were dispensed. Patients selected for this analysis had a diagnosis of MM with pharmacy claims for thalidomide, lenalidomide, or pomalidomide. Of the 87,398 claims submitted for these three medications, 77,822 were dispensed.
The resulting 77,822 prescriptions were representative of 8860 unique treatments. A treatment is defined as a specific drug being dispensed for a specific patient. Patients receiving only one dispense artificially bolster co-pay and adherence measures. Therefore, patients who only had one fill for any of these three drugs throughout the study’s time period were excluded from the analysis. After applying this single-fill exclusion criterion, there were 1558 unique treatments excluded. The final sample size included 76,263 claims for thalidomide, lenalidomide, or pomalidomide, representing 7302 unique treatments.
The amount of financial assistance received by each individual patient was determined by analyzing retail cost, third-party payer information, charitable foundation assistance, and manufacturer co-pay card assistance. Further analysis was conducted to determine the amount of co-pay assistance applied across various time points.
Adherence was assessed through an analysis of medication possession ratio (MPR) for those patients who filled a prescription ≥2 times throughout the 3-year time period. MPR for each therapy was determined using IBM SPSS, version 22. MPR is calculated as the total medication days supplied within the refill interval divided by the number of days in the refill intervalCitation15. MPR is a well-known measure commonly used to estimate patient adherenceCitation16. MPR values that were greater than 100% were capped at 100% to avoid artificially inflated averages. Direct cost to patients was evaluated to determine whether there was an effect on patient adherence. Cost categories (e.g., $0, <$10, ≥$10 to <$20, etc.) for this analysis were chosen based on those utilized in previously published literatureCitation4,Citation5,Citation17.
Results
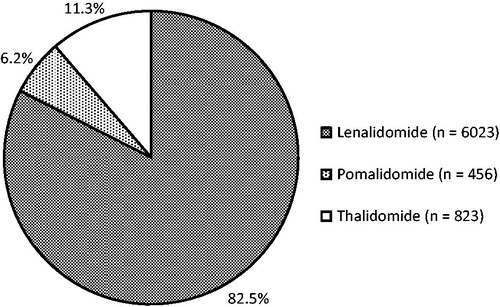
A total of 76,263 prescriptions for thalidomide, lenalidomide, and pomalidomide were filled by 6731 unique patients between January 1, 2011, and December 31, 2013. The average age of males included in the sample was 71.5 years, while the average age of females included in the sample was 72.6 years. A total of 7302 unique treatments were identified; 6192 patients received only one of the three drug therapies throughout the data collection period. An additional 507 patients received two of the three agents, and 32 received all three agents at separate time points throughout the study period. These patients received the agents either sequentially or after a therapy-free interval; no concomitant use was found. Most of these therapy regimens consisted of lenalidomide, which represented 82.5% of all therapies included in the analysis (n = 6023); the remaining regimens included thalidomide (11.3%; n = 823) or pomalidomide (6.2%; n = 456). shows a graphic breakdown of unique therapies.
Figure 1. Unique therapies.
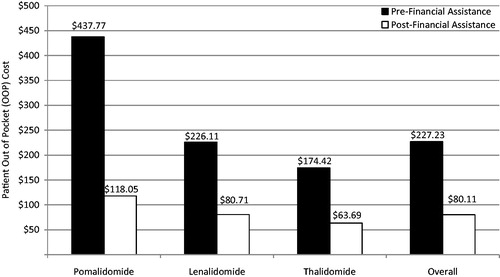
Prior to financial assistance, the average direct cost to the patient, per prescription, for any of these three agents was $227.23. Following co-pay assistance, the average direct cost to the patient, per prescription, decreased to $80.11, for an average saving of $147.14. shows average direct cost to the patient per prescription, both before and after financial assistance, by individual agent.
Figure 2. Pre- and post-financial assistance patient out-of-pocket (OOP) cost per prescription.
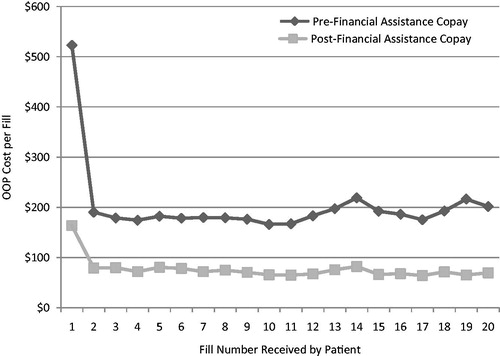
The average direct cost to the patient for the first fill, both before and after financial assistance, was significantly higher than the co-pays observed for subsequent fills (). The average direct cost to the patient associated with the first fill was reduced by $359.31, on average, following financial assistance. The direct cost to the patient associated with the first fill before financial assistance was 3.2-times higher than it was after financial assistance; for the second fill, it was 2.4-times higher.
Figure 3. Pre- and post-assistance patient out-of-pocket (OOP) cost by fill number.
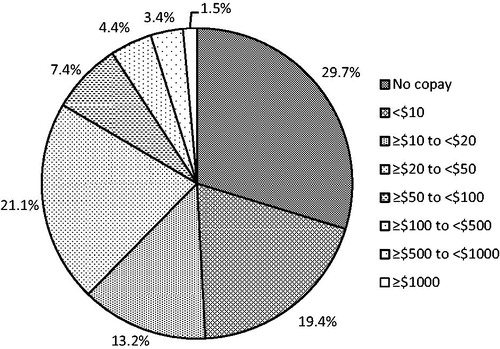
Of the 7302 unique treatments identified, financial assistance was utilized for 32.8%. Financial assistance was provided through foundation support (93%) or manufacturer co-pay card (7%). shows the levels of direct cost to the patient post-financial assistance. Prior to financial assistance, the average direct cost to the patient was ≤$50 for 57.6% of all prescriptions. After financial assistance was applied, the average direct cost to the patient was ≤$50 per prescription for 86.2% of all prescriptions. After financial assistance, the average direct cost to the patient was <$10 for 49.1% of all prescriptions.
Figure 4. Level of patient out-of-pocket (OOP) cost per prescription following application of financial assistance.
Adherence was assessed through an analysis of MPR for patients who filled a prescription ≥2 times throughout the 3-year time period. MPR was assessed for 7302 unique treatments. The average MPR for all therapies included in the analysis was 0.85. The MPRs for thalidomide, lenalidomide, and pomalidomide were 0.83, 0.85, and 0.91, respectively. These values are slightly lower than the overall average MPR value of 0.91 for all oral oncolytics that were filled at a specialty pharmacy during the same time period in which this study was conducted (). A patient with an MPR value of 0.80 or greater can be considered adherent to their medication(s)Citation15. An independent samples t-test was used to determine the relationship between adherence and direct cost to the patient by comparing MPR values of patients whose co-pays were less than $50 vs greater than or equal to $50 after assistance was applied. Results of the statistical test concluded that adherence, as assessed by MPR, did not vary significantly based on direct cost to the patient after financial assistance (p = 0.098). The lack of variation of MPR values based on direct cost to the patient was also observed in initial co-pay () as well as the average co-pay over the course of treatment for patients ().
Figure 5. Medication possession ratio (MPR) by therapy.
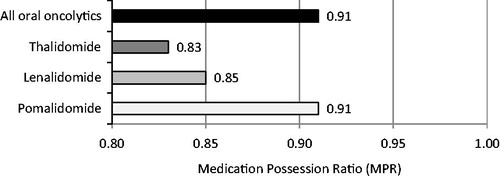
Table 1. MPR by average initial co-pay.
Table 2. MPR by average overall co-pay.
Discussion
Previously published studies have documented a correlation between specialty medication prescription abandonment and patient OOP costCitation5,Citation17. There is also evidence suggesting that patients with higher co-pays are more likely to discontinue or be non-adherent to oral oncolytic therapyCitation13. In a 2014 clinical report, ∼17% of patients with higher co-pays and 10% with lower co-pays discontinued tyrosine kinase inhibitors during the first 180 days following initiation of therapy for the treatment of chronic myeloid leukemia (adjusted risk ratio [aRR] = 1.70; 95% CI = 1.30–2.22)Citation13. Higher co-pays were defined as those within the top quartile of all co-paysCitation13. In the same study, patients with higher co-pays were 42% more likely to be non-adherent to therapy (aRR = 1.42; 95% CI = 1.19–1.69)Citation13.
For some therapeutic categories, such as rheumatoid arthritis, insurers often require higher cost sharing for certain agents than for others to incentivize adherence to a formularyCitation18. These payers have sometimes tried to prevent patients from utilizing financial assistance programs, viewing the use of these programs as an attempt to subvert the formularyCitation19. However, for oncology, the health plans that have higher co-payments are not typically attempting to enforce a preferred formulary alternative, but instead are attempting to decrease their cost for oral oncolytics. For commercial insurers, a lower cost-sharing level is often applied for injectable oncolytics because of historic distinctions between medical and pharmacy benefit structures rather than the intent to steer utilizationCitation20. This discrepancy has resulted in the institution of ‘co-pay equity’ laws in most states to provide a more equitable situation for patients, regardless of the method of administration of their oncology treatmentCitation21.
In a cross-sectional cohort study designed to investigate abandonment rates of oral oncolytic medications and identify factors that may impact the likelihood of abandonment, high cost sharing was identified as a factor contributing to the likelihood of prescription abandonmentCitation5. In that study, prescription abandonment was four times more likely for claims having an OOP cost of greater than $500 compared with those that were $100 or lessCitation5. Taken together, these studies show a clear correlation between patient OOP cost and increased rate of prescription abandonment, decreased duration of therapy, and non-adherence for specialty products.
In this retrospective study, we sought to evaluate the range of direct costs to patients taking oral agents for the treatment of MM to understand the extent to which they are subject to high direct costs. Our data provided a clear picture of the direct cost to patients associated with the utilization of oral oncolytics for the treatment of MM. Our data also showed that specialty pharmacies are uniquely positioned to help alleviate the patient burden of this cost through the co-ordination of financial assistance. Further, this study suggested that a successful financial assistance program can create widespread economic relief for patients and ensure sustained access to therapy for this population.
Several limitations to this study were identified. First, the study included patients receiving therapy from a single specialty pharmacy for a single indication. Extrapolation of study results to a larger patient population may, therefore, be difficult, although this pharmacy did represent a substantial percentage of all use of these products in the US during the specified time period. Second, there may have been patients included who received prescriptions from other pharmacies or sources prior to or after the prescriptions available for study here; no data were available to assess that possibility. The data may, therefore, not include all fills, particularly first fills, for some patients. Third, most regimens consisted of lenalidomide (n = 6023; 82.5% of all regimens). The remaining regimens included thalidomide (n = 823; 11.3% of all regimens) or pomalidomide (n = 456; 6.2% of all regimens), representing a relatively small proportion of the sample population.
Conclusions
A direct cost to patients of $50 or less was incurred by 86.2% of patients receiving oral immunomodulatory agents for the treatment of MM from a large specialty pharmacy in the US. Although there was a wide range of patient cost responsibility prior to financial assistance, utilization of financial assistance for 32.8% of dispensed prescriptions contributed to a lower direct cost to patients. Adherence, as assessed by MPR, did not vary significantly based on direct cost to the patient. This retrospective study demonstrated that the specialty pharmacy helped patients significantly reduce their direct cost expenditures by securing funding and co-pay assistance and suggested a positive effect on sustaining access to therapy for this patient population.
Transparency
Declaration of funding
No financial sponsorship was provided in the preparation of this article.
Declaration of financial/other relationships
GB is employed by and a stock owner for Celgene. The remaining authors, each of whom was employed by Diplomat during the period of time in which the analysis was conducted, have received no individual remuneration or other compensation from Celgene for authoring this article or conducting the study or analysis. Diplomat, a specialty pharmacy that dispenses a significant number of specialty medications manufactured by Celgene, also did not receive any direct financial compensation for its participation in this study or for the participation of its employees in the authorship of this article.
Acknowledgments
The authors received editorial assistance from MediTech Media, sponsored by Celgene Corporation.
References
- National Cancer Institute. Cancer Trends Progress Report – 2011/2012 Update. National Cancer Institute; Bethesda, MD, USA. http://progressreport.cancer.gov/sites/default/files/archive/report2011.pdf. Accessed October 31, 2015
- Mariotto AB, Yabroff KR, Shao Y, et al. Projections of the cost of cancer care in the United States: 2010-2012. J Natl Cancer Inst 2011;103:117-28
- Klein IR, Boccia RV, Cannon E, et al. Evolving strategies for the management of multiple myeloma: a managed care perspective. Am J Manag Care 2014;20:S45-S60
- Goldman DP, Joyce GF, Zheng Y. Prescription drug cost sharing. JAMA 2007;298:61-9
- Streeter SB, Schwartzberg L, Husain N, et al. Patient and plan characteristics affecting abandonment of oral oncolytic prescriptions. Am J Manag Care 2011;17:SP38-SP44
- Ito K, Elkin E, Blinder V, et al. Cost-effectiveness of full coverage of aromatase inhibitors for Medicare beneficiaries with early breast cancer. Cancer 2013;119:2494-502
- National Comprehensive Cancer Network. Multiple Myeloma. Version 2. 2015. National Comprehensive Cancer Network; Fort Washington, PA, USA. http://www.nccn.org/professionals/physician_gls/pdf/myeloma.pdf. Accessed October 30, 2015
- National Cancer Institute 2015. SEER Stat Fact Sheets: Myeloma. National Cancer Institute; Bethesda, MD, USA. http://seer.cancer.gov/statfacts/html/mulmy.html. Accessed February 23, 2015
- Thalomid [package insert]. Summit, NJ: Celgene Corporation, 2015
- Benboubker L, Dimopoulos MA, Dispenzieri A, et al. Lenalidomide and dexamethasone in transplant-ineligible patients with myeloma. N Engl J Med 2014;371:906-17
- Cook R. Economic and clinical impact of multiple myeloma to managed care. J Manag Care Pharm 2008;14:S18-S11
- Goodwin JA, Coleman EA, Sullivan E, et al. Personal financial effects of multiple myeloma and its treatment. Cancer Nurs 2013;36:301-8
- Dusetzina SB, Winn AN, Abel GA, et al. Cost sharing and adherence to tyrosine kinase inhibitors for patients with chronic myeloid leukemia. J Clin Oncol 2014;32:306-11
- Rajurkar SP, Presant CA, Bosserman LD, et al. A copay foundation assistance support program for patients receiving intravenous cancer therapy. J Oncol Pract 2011;7:100-2
- Peterson AM, Nau DP, Cramer JA, et al. A checklist for medication compliance and persistency studies using retrospective databases. Value Health 2007;10:3-12
- Fairman K, Motherall B. Evaluating medication adherence: which measure is right for your program? J Manag Care Pharm 2000;6:499-506
- Gleason PP, Starner CI, Gunderson BW, et al. Association of prescription abandonment with cost share for high-cost specialty pharmacy medications. J Manag Care Pharm 2009;15:648-58
- Happe LE, Clark D, Holliday E, et al. A systematic literature review assessing the directional impact of managed care formulary restrictions on medication adherence, clinical outcomes, economic outcomes, and health care resource utilization. J Manag Care Pharm 2014;20:677-84
- Silverman E 2013. Bye, bye co-pay cards? Why Express Scripts is excluding dozens of drugs. Forbes; Jersey City, NJ, USA. http://www.forbes.com/sites/edsilverman/2013/10/21/bye-bye-co-pay-cards-why-express-scripts-is-excluding-dozens-of-drugs/. Accessed October 30, 2015
- Franken A, Kirk M. Cancer Treatment Parity Act of 2013. United States Senators. Saint Paul, MN, USA; 2013. http://www.franken.senate.gov/files/documents/131220ChemoParity.pdf. Accessed October 31, 2015
- Mulcahy N 2015. ‘Parity’ laws for costly oral cancer drugs not a solution. Medscape Medical News; New York, NY, USA. http://www.medscape.com/viewarticle/832706. Accessed October 30, 2015