
Abstract
Objective:
Prophylactic treatment with granulocyte-colony stimulating factors (G-CSFs) is indicated for chemotherapy patients with a significant risk of febrile neutropenia. This study estimates the annual economic burden on patients and caregivers of clinic visits for prophylactic G-CSF injections in the US.
Methods:
Annual clinic visits for prophylactic G-CSF injections (all cancers) were estimated from national cancer incidence, chemotherapy treatment and G-CSF utilization data, and G-CSF sales and pricing information. Patient travel times, plus time spent in the clinic, were estimated from patient survey responses collected during a large prospective cohort study (the Prospective Study of the Relationship between Chemotherapy Dose Intensity and Mortality in Early-Stage (I–III) Breast Cancer Patients). Economic models were created to estimate travel costs, patient co-pays and the economic value of time spent by patients and caregivers in G-CSF clinic visits.
Results:
Estimated total clinic visits for prophylactic G-CSF injections in the US were 1.713 million for 2015. Mean (SD) travel time per visit was 62 (50) min; mean (SD) time in the clinic was 41 (68) min. Total annual time for travel to and from the clinic, plus time at the clinic, is estimated at 4.9 million hours, with patient and caregiver time valued at $91.8 million ($228 per patient). The estimated cumulative annual travel distance for G-CSF visits is 60.2 million miles, with a total transportation cost of $28.9 million ($72 per patient). Estimated patient co-pays were $61.1 million, ∼$36 per visit, $152 per patient. The total yearly economic impact on patients and caregivers is $182 million, ∼$450 per patient.
Limitations:
Data to support model parameters were limited. Study estimates are sensitive to the assumptions used.
Conclusions:
The burden of clinic visits for G-CSF therapy is a significant addition to the total economic burden borne by cancer patients and their families.
Introduction
Cancer patients with solid tumors or non-myeloid malignancies receiving myelosuppressive anti-cancer drug therapy often have suppressed white blood cell counts and are at risk for febrile neutropenia (FN) and infections. FN is a potentially life-threatening conditionCitation1 and the costs of treating FN and its clinical sequelae are substantial, both to patients and to the healthcare system. Incidence of inpatient neutropenic complications among cancer patients receiving chemotherapy ranges from 11–19%Citation2–4, depending on the therapy regimen, with the cost of treatment for an inpatient neutropenic event in the US averaging over $22,000Citation5. Treatment with granulocyte colony-stimulating factors (G-CSFs) at least 24 h after administration of myelosuppressive chemotherapy (MC) is indicated for patients whose risk factors are associated with a clinically significant incidence of FN, as observed in clinical trialsCitation6. G-CSFs are safe and effective in decreasing the incidence of chemotherapy-induced FN, the major dose-limiting side-effect of chemotherapy. As compared to overall FN-related hospitalizations, real-world incidence of inpatient neutropenic events among patients treated with G-CSFs ranges from only ∼2–5%Citation7–9, and the American Society of Clinical Oncology (ASCO) and the National Comprehensive Cancer Network Clinical Practice Guidelines in Oncology (NCCN Guidelines) each recommend prophylaxis with a G-CSF when FN risk is high (≥ 20%), based on either chemotherapy regimen risk alone or a combination of regimen risk, patient risk factors (e.g., age, type and number of comorbidities, pre-existing neutropenia or infection), and disease characteristics (e.g., tumor type and stage)Citation10–12.
Because G-CSFs rapidly induce the proliferation of myeloid progenitor cells—which may be especially sensitive to myelotoxic agents, and could adversely impact the risk of FN—prescribing information specifies that G-CSFs should not be administered between 14 days before and 24 h after administration of myelosuppressive chemotherapy. Consequently, most doses of G-CSFs given in the US are usually administered during a separate visit after the chemotherapy session. Relatively few doses are self-administered at home by the patient or an informal caregiver such as a spouse or other family member. For patients on short-acting, daily-dosed G-CSFs, multiple additional clinic visits are required during each chemotherapy cycle, the time and costs of which can be burdensome for patients and the informal caregivers who accompany them on these visits. Travel time plus time in the clinic for each injection has been reported to be typically 2 h or moreCitation13–15, and travel costs plus out-of-pocket co-pays not covered by insurance can add up quicklyCitation16–18. Travel barriers (including long travel times) may be deterrents to proper clinical care in cancer patientsCitation19–34, leading to sub-optimal outcomes.
To better understand the total economic impacts of G-CSF therapy after MC, this study estimated the total time and cost burden on patients and informal caregivers of clinic visits for G-CSF injections in the US for 1 year.
Patients and methods
This study used a population modeling approach based on secondary data sources. The project consisted of a literature review for the collection of empirical data to use in generation of model estimates, development of national estimates of oncology office/hospital outpatient department (OPD) visit volume for G-CSF therapy, creation of per-visit cost and utilization estimation models, and generation of patient and caregiver cost estimates based on cost and utilization parameters found in the literature, from government and private websites and from patient questionnaire data collected as part of an ongoing prospective observational study (the Prospective Study of the Relationship between Chemotherapy Dose Intensity and Mortality in Early-Stage (I–III) Breast Cancer Patients, also called the ‘CABS’ studyCitation35). Deterministic models were created in Microsoft Excel to estimate the patient and caregiver economic burden of post-MC G-CSF therapy under the current standard of care, as of early 2015. This included treatment with both daily dosed (filgrastim, tbo-filgrastim) as well as long-acting (pegfilgrastim) G-CSF injections. No intervention effects or G-CSF market changes were estimated (e.g., for a change in the mix or volume of G-CSFs used as a result of biosimilars entering the US market). Our estimates attempted to mirror current clinical practice in the use of G-CSFs for primary prophylaxis in the prevention of chemotherapy-induced FN. G-CSF use in other settings (e.g., hospital inpatient, pharmacy) or for other indications (e.g., treatment of severe chronic FN, use in myeloid malignancies and hematologic cancers except Non-Hodgkins Lymphoma) were also excluded from the estimates.
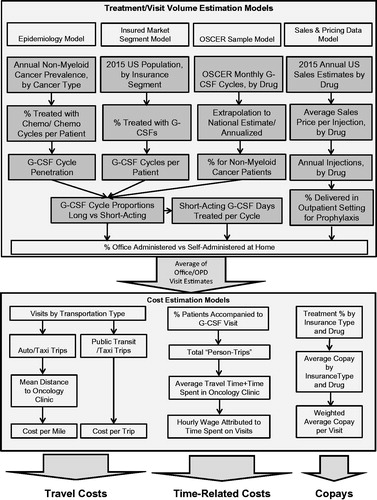
Factors associated with G-CSF treatment decisions that were included in the models were type and stage of cancer, whether or not myelosuppressive chemotherapy is used to treat each case, whether or not G-CSFs are used prophylactically to reduce risk of FN and for how many cycles, what type of G-CSF is prescribed, how many days per cycle G-CSFs are prescribed (for daily G-CSFs), and whether the treatments will be self-administered at home or given in the clinic. Inputs which determined the patient and caregiver costs per office visit included the travel time to the clinic, an average travel speed (to convert travel time to miles), what mode of transportation the patient used to get to the clinic, whether they were accompanied by someone else to the clinic, how much time was spent at the clinic for the G-CSF therapy, and how much of the cost of the visit was not covered by the patient’s insurance ().
Figure 1. Treatment volume and cost estimation model overview.
Definition of costs
The models estimated direct and indirect economic costs to patients and to informal caregivers who accompany patients to G-CSF office visits. Direct costs included out-of-pocket costs for transportation and office visit costs not covered by insurance (co-pays). Indirect costs included mileage allowances for use of private autos for travel to the clinic, and opportunity costs of patient and caregiver time spent traveling to and from the clinic visit and of the time in the clinic. Patient time was valued using a foregone wage approach, while caregiver time was valued based on a combination of a foregone wage and a replacement cost approachCitation36. These time valuation methods are consistent with standard practices in cost-effectiveness researchCitation37. More specifically, patient time was valued at the national average hourly wage for all occupations, and the economic value of caregiver time was calculated as the average of (a) state minimum wages, (b) average Home Health Aide wages, and (c) the median private pay cost of hiring a home health aide (see for sources). For mileage allowances, patient-driven miles were valued at the IRS Medical mileage rate, which is what the patient could theoretically value their mileage at in a Federal tax return. Caregiver miles are valued based on a replacement cost approach using the IRS business mileage rate.
Table 1. Summary of data sources and assumptions used for estimating patient and caregiver costs.
Costs were estimated for all US non-myeloid cancer patients undergoing chemotherapy and traveling to oncology offices or hospital OPD clinics for prophylactic treatment with G-CSFs during a single calendar year. Where necessary, cost estimates were updated to 2015 US dollars using the Medical component of the Consumer Price Index (US Bureau of Labor StatisticsCitation52).
Literature search
We conducted a literature search for studies of the utilization of G-CSFs in the treatment and prevention of FN in non-myeloid cancer patients in the US, and the patient and caregiver time and cost burden of office visits for cancer-related therapy. We also reviewed information from government and private websites to augment the literature search. All articles, reports, and data-sets found that had estimates relevant to our models were selected for use in populating the models with either base case and/or alternate assumptions and estimates to be used in sensitivity analysis.
Models, estimates, and data sources
Annual treatment/visit volume
There were no national estimates of the treatment volume of interest available from any public or private source that we could find. Therefore, we developed estimates from four modeling perspectives, each of which used a different set of primary inputs, and averaged the results for our base case estimate. Data sources for each model are described in . The perspectives of these models were:
Epidemiologic perspective. This model started with national estimates of cancer prevalence, estimates of proportions of patients by cancer type who received chemotherapy, G-CSF penetration rates as a percentage of chemotherapy cycles in each cancer type, percentage of G-CSF treatments by setting and by G-CSF type (daily vs long-acting).
OSCER sample-based model. This model used data from the Oncology Services Comprehensive Electronic Records (OSCER) database, which includes data on cancer patients from a large US-based national sample of outpatient community and hospital-affiliated oncology practices that utilize a common EMR system for data capture. The OSCER database includes ∼600,000 cancer patients from over 400 clinical sites around the countryCitation53–55. A methodology to extrapolate this sample data to national estimates has been developed and validatedCitation53, and the database includes many statistics on G-CSF utilization. Data from OSCER provided the national estimates used in the second model.
Sales and pricing data perspective. This model used total sales data from Amgen public filingsCitation56 and average sales price data from MedicareCitation49 to estimate the annual number of G-CSF injections given in the US. Other sources were used to estimate the proportion given prophylactically in the clinic setting.
Insured market segment perspective. The last model started with estimates of the total US insured population by insured market segment and estimated the proportion of each segment that received G-CSF therapy, using data from the literature, from databases, and from Amgen data on file.
Travel and time estimates: The CABS studyCitation35
During 2014–2015, data were collected during chemotherapy treatment on patient-reported time and travel burdens associated with G-CSF injections/visits. This information included patient travel times, plus time in the clinic, method of travel to the clinic, whether the patient was accompanied by someone, and other aspects of the patient burden of G-CSF visits. Responses by 598 patients completing Phase I of the data collection were available in early 2015, and were used to estimate these time and travel parameters in our model. CABS study patients were broadly distributed across the US to provide a nationally-representative sample of travel and time estimates. By region, 18% were in the Midwest, 20% Northeast, 25% South Atlantic, 24% South Central, and 13% Western region. Most patients/clinics in the study were in urban areas; rural and suburban patients represented only ∼8% of respondents.
Cost estimates
Once estimates of total national annual visit volume and estimates of per treatment travel and time were created, models were developed to quantify the cost burden per visit to patients and caregivers. Cost estimates were developed for travel costs, time-related costs, and patient cost-sharing for the cost of the office visit not covered by insurance (co-pays). A summary description of data sources and major assumptions used to generate these estimates is shown in .
Validity and reliability
To ensure validity and reliability of our models and estimates, most estimates and assumptions used in the base case were cross-checked and validated for reasonableness against alternate data sources. The ranges of these alternate estimates were used in sensitivity analysis (see next paragraph). For example, the self-reported travel time and time in the clinic averages from the CABS data, and the percentage of clinic visits where the patient drove him/herself or was accompanied and driven by another, were compared to similar estimates from the literature to ensure reasonableness. As another example, model-derived estimates of G-CSF cycle penetration rates by cancer type were compared to similar estimates from other studies in the published literature. Models were checked for internal consistency (between-model consistency of inputs, and reasonable comparability of outputs).
Sensitivity analysis
We ran a series of one-way sensitivity analyses to determine the key drivers of costs estimated in the model. We ran this for the estimated total costs of travel, plus patient and caregiver time lost due to G-CSF visits, and insurance cost-sharing combined. Ten key variables or parameters in the model were tested. The effects of changes from the baseline assumption for each single variable in the analysis were isolated in the model by holding all other factors constant (at baseline estimates) and then modifying the test variable through a range of reasonable alternate assumptions. We compared model results for total (cumulative) costs under these alternate assumptions to the baseline result. We developed plausible ranges of values from the literature to define the boundaries for the one-way sensitivity analyses. Sources and rationales for our assumptions are given in and the accompanying footnotes.
Table 2. Sensitivity analysis: Plausible ranges of values, sources, and rationales.
Results
The estimated total number of clinic visits for prophylactic G-CSF injections in the US following MC for all non-myeloid malignancies was 1.713 million visits for ∼403,000 patients in 2015. The range of total annual visit estimates from the four treatment volume estimation models was 1,668,000 (Sales and Pricing model) to 1,743,000 (Epidemiology model). Two-thirds of CABS patients reported that they were accompanied to the visit by an informal caregiver, which translates to 1.14 million accompanied visits in our national estimate.
Mean (SD) travel time per visit was 62 (50) min; mean (SD) time in the clinic was 41 (68) min. The estimated round-trip travel distance per visit was 35.1 miles. Most trips (98%) were reported to be by automobile, with 1% of trips by taxi and 1% by public transit. Patients drove themselves to the clinic for 33.5% of visits, with a companion driving for 64.5% of visits. Transportation costs were assigned to the caregiver for automobile trips where the patient did not drive, and were valued at the higher IRS business mileage rate, as noted in the methods. Therefore, cumulative transportation costs were higher for caregivers than for patients.
The cumulative annual travel costs for G-CSF clinic visits were $28.9 million ($72 per patient), and the cumulative annual travel distance was estimated at 60.2 million miles. The total national patient and informal caregiver time commitment for 1 year for travel to and from the clinic, plus time at the clinic, was 4.9 million hours (12.1 h per patient), valued at $91.8 million ($228 per patient). Patient co-pays were estimated at $61.1 million ($35.64 per visit). The total economic impact of lost time, transportation costs, and patient cost-sharing was $182 million, or $451 per patient. The average patient and caregiver cost burden per visit was $106, of which half was for the value of time lost for the visit.
Summary results from the models are shown in .
Table 3. 2015 Estimated patient and caregiver cost burden of G-CSF clinic visits.
Table 4. 2015 Patient and caregiver cost burden per patient and per visit.
Table 5. 2015 Estimated patient and caregiver travel and time burden of G-CSF visits.
Sensitivity analysis
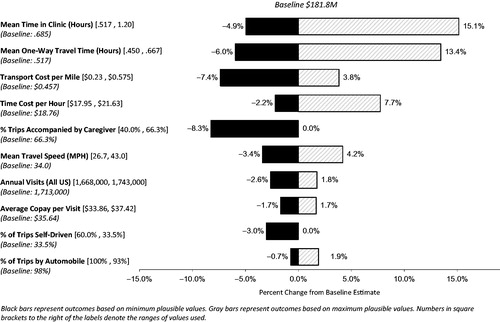
summarizes the results of the one-way sensitivity analysis. The largest effects on the model cost estimates result from the assumptions of time spent in the oncology clinic and travel time to the clinic. The range of results varied from 5% below baseline to 15% above baseline when we substituted the alternate assumptions for mean time spent in the clinic, and the range of costs varied from 6% below baseline to 13% above baseline when we applied the alternate assumptions for travel time to the clinic. Unit costs for travel per mile and the cost of lost time per hour had the next largest effects. Depending on which IRS mileage rate(s) were used, the results varied from −7% to +4% of baseline costs. This model is sensitive to this variable because almost all of the trips to the clinic are via automobile. The hourly wage applied to caregiver time also moderately affects the overall cost estimates in the model, ranging from −2% from baseline when using the foregone wage approach to +8% when using the replacement cost approach.
Figure 2. One-way sensitivity analysis—key factors influencing costs.
Discussion
Using a deterministic model based on parameters derived from recent primary research and from published literature, we estimated the total annual costs to US patients and informal caregivers of oncology clinic visits for prophylactic G-CSF therapy to be ∼$182 million for 2015, or roughly $450 per patient, across all non-myeloid cancer types. This compares to an estimated range of $1730–$2364 in total annual out-of-pocket costs for actively treated cancer patients, depending on insurance statusCitation61–63. The travel burden on patients and informal caregivers in this study was estimated to be ∼60 million miles, and time devoted to going to oncology clinics for G-CSF injections after MC was estimated at 4.9 million hours, or over 12 h per patient treated.
Treatment with G-CSFs significantly reduces the risk and incidence of FN in cancer patients undergoing chemotherapy. In the pivotal, placebo-controlled trial of pegfilgrastim, overall incidence of FN was 17% with placebo vs 1% with pegfilgrastim treatment—a 94% reduction in FNCitation64. However, as evidenced in recent literature, G-CSFs are currently used sub-optimally relative to clinical guidelines for patients at high risk for FN following chemotherapy, and FN hospitalizations continue to negatively impact the delivery of optimal chemotherapy dosesCitation65–69. Reasons for such sub-optimal outcomes may include not using G-CSFs prophylactically, as indicated (i.e., not using G-CSFs on the first and every cycle, and/or daily G-CSF use lasting less than the indicated 10–11 days per cycleCitation70), and administering them contrary to the approved prescribing directions (i.e., some patients receive G-CSFs on the same day as the last administration of chemotherapyCitation71).
Patient non-adherence to chemotherapy follow-up visits may also be a factor, as patients engage in cost-coping strategies in light of the high economic costs of adherence to prescribed treatmentCitation63,Citation72. To the extent that the time and economic burden on patients reduces the likelihood of attendance at follow-up visits for G-CSF prophylaxis, efforts should be made to reduce these burdens. Travel barriers and high out-of-pocket costs have been shown to have detrimental effects on cancer patients and on the likelihood of receiving optimal careCitation19–21,Citation28–31. Conversely, patients being treated with G-CSFs after MC have reported better satisfaction with their care when they have to make fewer follow-up visits per cycleCitation57 and have even reported a willingness-to-pay significantly more in out-of-pocket costs to reduce the number of G-CSF injections per cycleCitation72. One way to reduce the number of injections per cycle is through the use of longer-acting G-CSFs like pegfilgrastim. Follow-up visits can also be reduced or eliminated if patients self-administer G-CSFs at home, but prohibitive pharmacy co-pays and doctor and patient concerns about proper timing and frequency of administration may limit the use of this option. A third alternative is G-CSF administration in the home via a timed-release mechanism administered by a clinician during the chemotherapy visitCitation73.
This study fills a gap in the literature by estimating the total US national economic burden of G-CSF visits on patients and caregivers, and further translates this burden to a per patient and per visit level. However, there are additional patient and caregiver costs that were not captured by this study. Specifically, we did not estimate lost work time, which could be in addition to the time estimated to travel to and from the clinic visit and the time spent in the clinic. Estimates of lost work time that could be directly attributed to the G-CSF visit were not available. Other incidental costs which were not captured include parking fees, tolls, and telephone charges to co-ordinate clinic visits, but these costs are likely to be quite minimalCitation57,Citation74.
This was an economic analysis using a population-based modeling approach, with inherent limitations. These include limitations of the empirical estimates drawn from the CABS study and from the literature. In particular, precise data on the number of G-CSF office visits across the US are lacking, as well as the current mix of short vs long-acting G-CSF injections. The variation in office visit time and travel distance estimates from the literature was high. Better measurement of total US G-CSF market share by payer category, by drug, by indication, and by setting would improve the precision of cost estimates such as those that we undertook to examine. Our estimates of the opportunity cost of patient and caregiver time do not reflect actual wages of the patients and caregivers, but are generalized assumptions based on national average wages. Finally, the cost of office visit co-pays is subject to many variables including availability of secondary/supplemental insurance for Medicare patients, state-level (Medicaid) or insurer-specific (Commercial) benefit designs, and whether any cost-sharing is borne by the uninsured. In general, we attempted to be conservative in the estimates and assumptions used throughout the process.
Another important element that was of interest in this study but which we could not evaluate was any disparity between travel time and cost for rural vs urban patients. The CABS data (source of our travel time estimates) contained almost no rural patients, making estimates for rural patient travel from this primary data source untenable. Previous research has suggested that transportation barriers for rural cancer patients may lead to sub-optimal careCitation19–21,Citation28, so an understanding of the magnitude of this issue for these patients would be useful. Although the lack of rural patient data probably adds to the overall conservatism in our model cost estimates, future research on G-CSF therapy should include a better sampling of rural patients.
Conclusions
The patient and informal caregiver time and cost burden of clinic visits for G-CSF therapy following myelosuppressive chemotherapy is a significant addition to the total economic burden borne by cancer patients and their families. Travel barriers and out-of-pocket costs may translate into sub-optimal access to, or adherence to, needed care. Administration practices which reduce the economic and time burden of G-CSF therapy should be thoroughly explored between clinicians and patients. Finally, further research is needed on the impacts of travel distance and costs in the delivery of G-CSF therapy and any consequences of sub-optimal care, especially for rural patients.
Transparency
Declaration of funding
This study was sponsored by Amgen, Inc. The study sponsor played a role in study design, interpretation of data, and writing of this manuscript.
Declaration of financial/other relationships
JMS received consulting fees from Amgen, Inc. related to this study. XL, MR, and ST are, or were, employees of Amgen, Inc. at the time this study was conducted and own stock and/or stock options in Amgen Inc. JME peer reviewers on this manuscript have no relevant financial or other relationships to disclose.
Acknowledgments
The authors wish to thank Wayne Sheldon, Amgen, Inc., who provided data analysis support for this study.
References
- Lyman GH, Michels SL, Reynolds MW, et al. Risk of mortality in patients with cancer who experience febrile neutropenia. Cancer 2010;116:5555-63
- Crawford J, Dale DC, Kuderer NM, et al. Risk and timing of neutropenic events in adult cancer patients receiving chemotherapy: the results of a prospective nationwide study of oncology practice. J Natl Compr Canc Netw 2008;6:109-18
- Weycker D, Barron R, Kartashov A, et al. Incidence, treatment, and consequences of chemotherapy-induced febrile neutropenia in the inpatient and outpatient settings. J Oncol Pharm Pract 2014;20:190-8
- Weycker D, Li X, Edelsberg J, et al. Risk and consequences of chemotherapy-induced febrile neutropenia in patients with metastatic solid tumors. JOP 2015;11:47-54
- Michels SL, Barron RL, Reynolds MW, et al. Costs associated with febrile neutropenia in the US. Pharmacoeconomics 2012;30:809-23
- Amgen, Inc. Neulasta® (pegfilgrastim) Prescribing Information. Amgen, Inc., 2014. http://pi.amgen.com/united_states/neulasta/neulasta_pi_hcp_english.pdf. Accessed May 7, 2015 Thousand Oaks, CA
- Weycker D, Malin J, Kim J, et al. Risk of hospitalization for neutropenic complications of chemotherapy in patients with primary solid tumors receiving pegfilgrastim or filgrastim prophylaxis: a retrospective cohort study. Clin Ther 2009;31:1069-81
- Weycker D, Malin J, Barron R, et al. Comparative effectiveness of filgrastim, pegfilgrastim, and sargramostim as prophylaxis against hospitalization for neutropenic complications in patients with cancer receiving chemotherapy. Am J Clin Oncol 2012;35:267-74
- Weycker D, Li X, Figueredo J, et al. Risk of chemotherapy-induced febrile neutropenia in cancer patients receiving pegfilgrastim prophylaxis: does timing of administration matter? Support Care Cancer 2015; Published online ahead of print 25 November 2015:1-8
- Smith TJ, Khatcheressian J, Lyman GH, et al. 2006 update of recommendations for the use of white blood cell growth factors: an evidence-based clinical practice guideline. JCO 2006;24:3187-205
- Flowers CR, Seidenfeld J, Bow EJ, et al. Antimicrobial prophylaxis and outpatient management of fever and neutropenia in adults treated for malignancy: American Society of Clinical Oncology Clinical Practice Guideline. JCO 2013;31:794-810
- National Comprehensive Care Network. NCCN clinical practice guidelines in oncology: myeloid growth factors version 1. NCCN. 2015. http://www.nccn.org/professionals/physician_gls/f_guidelines.asp. Accessed October 13, 2015 Fort Washington, PA
- Fortner BV, Tauer K, Zhu L, et al. Medical visits for chemotherapy and chemotherapy-induced neutropenia: a survey of the impact on patient time and activities. BMC Cancer 2004;4:22
- Houts AC, Loh GA, Fortner BV, et al. Patient and caregiver time burden associated with anaemia treatment in different patient populations. Support Care Cancer 2006;14:1195-204
- Haithcox S, R Ramnes C, Lee H, et al. The impact of frequent injections for hematopoietic growth factor support on patients receiving chemotherapy: an observational study. BMC Nurs 2003;2:22
- Tomic K, Long S, Li X, et al. A retrospective study of patients’ out-of-pocket costs for granulocyte colony-stimulating factors. J Oncol Pharm Pract January 2013 :1078155212473001. doi:10.1177/1078155212473001. 2013 Dec;19(4):328-37.
- Houtven CHV, Ramsey SD, Hornbrook MC, et al. economic burden for informal caregivers of lung and colorectal cancer patients. Oncologist 2010;15:883-93
- Lauzier S, Lévesque P, Mondor M, et al. Out-of-Pocket costs in the year after early breast cancer among Canadian women and spouses. JNCI J Natl Cancer Inst 2013;105:280-92
- Payne S, Jarrett N, Jeffs D. The impact of travel on cancer patients’ experiences of treatment: a literature review. Eur J Cancer Care (Engl) 2000;9:197-203
- Goodwin JS, Hunt WC, Samet JM. Determinants of cancer therapy in elderly patients. Cancer 1993;72:594-601
- Guidry JJ, Aday LA, Zhang D, et al. Transportation as a barrier to cancer treatment. Cancer Pract 1997;5:361-6
- Athas WF, Adams-Cameron M, Hunt WC, et al. Travel distance to radiation therapy and receipt of radiotherapy following breast-conserving surgery. JNCI J Natl Cancer Inst 2000;92:269-71
- Meden T, St. John-Larkin C, Hermes D, et al. Relationship between travel distance and utilization of breast cancer treatment in rural northern Michigan. JAMA 2002;287:111
- Rutter CE, Yu JB, Wilson LD, et al. Assessment of national practice for palliative radiation therapy for bone metastases suggests marked underutilization of single-fraction regimens in the United States. Int J Radiat Oncol Biol Phys 2015;91:548-55
- Wu JSY, Kerba M, Wong RKS, et al. Patterns of practice in palliative radiotherapy for painful bone metastases: impact of a regional rapid access clinic on access to care. Int J Radiat Oncol Biol Phys 2010;78:533-8
- Huang LC, Ma Y, Ngo JV, et al. What factors influence minority use of NCI cancer centers? Cancer 2014;120:399-407
- Haddad AQ, Singla N, Gupta N, et al. Association of distance to treatment facility on quality and survival outcomes after radical cystectomy for bladder cancer. Urology 2015;85:876-82
- Lin CC, Bruinooge SS, Kirkwood MK, et al. Association between geographic access to cancer care, insurance, and receipt of chemotherapy: geographic distribution of oncologists and travel distance. JCO August 2015: JCO.2015.61.1558. doi:10.1200/JCO.2015.61.1558. 2015 Oct 1;33(28):3177-85.
- Massarweh NN, Chiang Y-J, Xing Y, et al. Association between travel distance and metastatic disease at diagnosis among patients with colon cancer. J Clin Oncol 2014;32:942-8
- Punglia RS, Weeks JC, Neville BA, et al. Effect of distance to radiation treatment facility on use of radiation therapy after mastectomy in elderly women. Int J Radiat Oncol Biol Phys 2006;66:56-63
- Schroen AT, Brenin DR, Kelly MD, et al. Impact of patient distance to radiation therapy on mastectomy use in early-stage breast cancer patients. J Clin Oncol 2005;23:7074-80
- Onega T, Duell EJ, Shi X, et al. Determinants of NCI Cancer Center attendance in medicare patients with lung, breast, colorectal, or prostate cancer. J Gen Intern Med 2009;24:205-10
- Onega T, Cook A, Kirlin B, et al. The influence of travel time on breast cancer characteristics, receipt of primary therapy, and surveillance mammography. Breast Cancer Res Treat 2011;129:269-75
- Peipins LA, Graham S, Young R, et al. Racial disparities in travel time to radiotherapy facilities in the Atlanta metropolitan area. Soc Sci Med 2013;89:32-8
- Li X, Barron R, Tzivelekis S, et al. A prospective study of patterns of chemotherapy, G-CSF use, and burden of G-CSF injections in early-stage breast cancer (ESBC). San Antonio, TX, 2015 Poster presented at the 2015 San Antonio Breast Cancer Symposium 9 December 2015
- AARP Public Policy Institute. Valuing the Invaluable 2015 Update: undeniable progress, but big gaps remain. AARP, 2015. http://www.aarp.org/content/dam/aarp/ppi/2015/valuing-the-invaluable-2015-update-undeniable-progress.pdf. Accessed July 17, 2015 Washington DC
- Tranmer JE, Guerriere DN, Ungar WJ, et al. Valuing patient and caregiver time: a review of the literature. Pharmacoeconomics 2005;23:449-59
- Howlader N, Noone A-M, Krapcho M, et al. SEER Cancer Statistics Review, 1975–2012. Bethesda, MD: National Cancer Institute, 2015. http://seer.cancer.gov/csr/1975_2012/. Accessed May 22, 2015
- American Cancer Society. Cancer treatment & survivorship facts & figures 2014–2015. Atlanta, GA: American Cancer Society, 2015. http://www.cancer.org/acs/groups/content/@research/documents/document/acspc-042801.pdf. Accessed June 9, 2015
- Chemocare.com. How long is chemotherapy given? - What is chemotherapy? - Chemocare. http://chemocare.com/chemotherapy/what-is-chemotherapy/how-long-is-chemotherapy-given.aspx. Accessed September 8, 2015 Chemocare.com, Cleveland OH, 2015
- Amgen, Inc. Data on File. Amgen, Inc., 2015 Thousand Oaks, CA
- Phillips J, Ritter S, Starner C, et al. Filgrastim (Neupogen) and pegfilgrastim (Neulasta): cost analysis and utilization management opportunity assessment. 2012 https://www.primetherapeutics.com/specialty/assets/pdf/NeupogenNeulastaUMOpportunity.pdf. Accessed May 12, 2015 Poster presented at the AMCP 24th Annual Meeting April 20, 2012 San Francisco CA
- Bureau of Labor Statistics. Occupational Employment Statistics (OES) data as of May 2014. Bureau of Labor Statistics. http://www.bls.gov/oes/current/oes_nat.htm#00-0000. Accessed April 8, 2015 National Conference of State Legislatures, Washington DC. Published 2015 Poster presented at the AMCP 24th Annual Meeting April 20, 2012 San Francisco CA.
- National Conference of State Legislatures. State Minimum Wages | 2015 Minimum Wage by State. http://www.ncsl.org/research/labor-and-employment/state-minimum-wage-chart.aspx#1. Accessed September 14, 2015
- Genworth Financial. Genworth 2014 Cost of Care Survey, April 2014. 2014. https://www.genworth.com/dam/Americas/US/PDFs/Consumer/corporate/130568_032514_CostofCare_FINAL_nonsecure.pdf. Accessed September 3, 2015 Genworth Financial, Richmond VA
- Internal Revenue Service. Standard mileage rates. IRS. 2015. http://www.irs.gov/Tax-Professionals/Standard-Mileage-Rates. Accessed September 8, 2015 Washington DC
- APTA. 2014 Public Transportation Fact Book. Washington, DC: American Public Transportation Association, 2014. http://www.apta.com/resources/statistics/Documents/FactBook/2014-APTA-Fact-Book.pdf. Accessed September 3, 2015
- TaxiFareFinder. Summary taxi rates for US Cities. TaxiFareFinder. http://www.taxifarefinder.com/rates.php. Published 2015. Accessed September 3, 2015
- Centers for Medicare & Medicaid Services. ASP Drug Pricing Files. Centers for Medicare & Medicaid Services. 2015. http://www.cms.gov/apps/ama/license.asp?file=/McrPartBDrugAvgSalesPrice/downloads/2015-April-ASP-Pricing-File.zip. Accessed September 3, 2015 Baltimore MD
- Kaiser Family Foundation. Medicaid benefits: physician services. Kaiser Family Foundation, 2015. http://kff.org/medicaid/state-indicator/physician-services/. Accessed September 11, 2015
- Medicare Payment Advisory Commission (US). Health Care spending and the Medicare Program: a data book June 2015. Washington, DC: Medicare Payment Advisory Commission, 2015. http://www.medpac.gov/documents/data-book/june-2015-databook-health-care-spending-and-the-medicare-program.pdf?sfvrsn=0. Accessed August 27, 2015 Washington DC
- Bureau of Labor Statistics. Consumer Price Index - Urban (CPI-U) Medical Care. Bureau of Labor Statistics Data. http://data.bls.gov/timeseries/CUUR0000SAM?output_view=pct_12mths. Accessed August 31, 2015 Washington DC 2015
- Quach D, Liede A, Byekwaso S, et al. Projection methods using oncology electronic health records to produce nationally representative estimates. 2013. http://obroncology.com/imshealth/content/ISPE%202013_Quach%20poster_13Aug2013.pdf. Accessed May 28, 2015 Poster presented at 29th International Conference on Pharmacoepidemiology & Therapeutic Risk Management, August 25-28 2013, Montreal Canada
- DeMartino JK, Larsen JK. Data needs in oncology: “Making sense of the big data soup”. J Natl Compr Canc Netw 2013;11(2 Suppl):S-1-S-12
- Hernandez RK, Quigley J, Pirolli M, et al. Patients with bone metastases from solid tumors initiating treatment with a bone-targeted agent in 2011: a descriptive analysis using oncology clinic data in the US. Support Care Cancer 2014;22:2697-705
- Amgen, Inc. SEC Filings. Amgen, Inc. http://investors.amgen.com/phoenix.zhtml?c=61656&p=irol-sec. Accessed May 27, 2015 Thousand Oaks CA 2015
- Beveridge RA, Rifkin RM, Moleski RJ, et al. Impact of long-acting growth factors on practice dynamics and patient satisfaction. Pharmacother J Hum Pharmacol Drug Ther 2003;23:101S-109S
- Meehan K, Tchekmedyian, S, Ciesla G. The burden of weekly epoetin alfa injections to patients and their caregivers abstract 2186. J Support Oncol 2003;1(Suppl):28
- Shreay S, Desrosiers M-P, Corey-Lisle P, et al. A retrospective study to evaluate the time burden associated with outpatient red blood transfusions indicated for anemia due to concomitantly administered chemotherapy in cancer patients. Support Care Cancer 2013;21:1335-40
- Meehan K, Tchekmedyian, S, Smith S. An activity-based costing estimate of anemia correction activities in an oncology practice. Abstract 5595. Blood 2002;100:
- Davidoff AJ, Erten M, Shaffer T, et al. Out-of-pocket health care expenditure burden for Medicare beneficiaries with cancer. Cancer 2013;119:1257-65
- Finkelstein EA, Tangka FK, Trogdon JG, et al. The personal financial burden of cancer for the working-aged population. Am J Manag Care 2009;15:801-6
- Bestvina CM, Zullig LL, Yousuf Zafar S. The implications of out-of-pocket cost of cancer treatment in the USA: a critical appraisal of the literature. Future Oncol 2014;10:2189-99
- Vogel CL, Wojtukiewicz MZ, Carroll RR, et al. First and subsequent cycle use of pegfilgrastim prevents febrile neutropenia in patients with breast cancer: a multicenter, double-blind, placebo-controlled phase III study. J Clin Oncol 2005;23:1178-84
- Weycker D, Barron R, Edelsberg J, et al. Risk and consequences of chemotherapy-induced neutropenic complications in patients receiving daily filgrastim: the importance of duration of prophylaxis. BMC Health Serv Res 2014;14:189
- Ramsey SD, McCune JS, Blough DK, et al. Colony-stimulating factor prescribing patterns in patients receiving chemotherapy for cancer. Am J Manag Care 2010;16:678-86
- Rajan SS, Carpenter WR, Stearns SC, et al. Short-term costs associated with primary prophylactic G-CSF use during chemotherapy. Am J Manag Care 2013;19:150-9.
- Morrison VA, Wong M, Hershman D, et al. Observational study of the prevalence of febrile neutropenia in patients who received filgrastim or pegfilgrastim associated with 3–4 week chemotherapy regimens in community oncology practices. J Manag Care Pharm 2007;13:337-48
- Barnes G, Pathak A, Schwartzberg L. G-CSF utilization rate and prescribing patterns in United States: associations between physician and patient factors and GCSF use. Cancer Med 2014;3:1477-84.
- Chrischilles EA, Cosler LE, Delgado DJ. Pharmacoeconomics and considerations for injectable products: focus on colony-stimulating factors. JCMP 2003;9:4-21
- Weycker D, Li X, Barron R, Figueredo J, et al. Risk of febrile neutropenia (FN) in cancer patients (pts) receiving myelosuppressive chemotherapy and pegfilgrastim prophylaxis (PEG-P): does day of administration matter? J Clin Oncol 2015;33(Suppl):abstract e17697
- Johnson P. A discrete choice experiment to examine preferences and willingness to pay for prophylactic granulocyte colony-stimulating factors (G-CSF) in previously treated breast cancer patients. J Clin Oncol 2013;31(Suppl):abstract e17509
- Amgen, Inc. Neulasta® Onpro™ Kit. Amgen, Inc. http://www.neulastahcp.com/characteristics/neulasta-onpro-kit/. Accessed December 29, 2015 Thousand Oaks, CA 2015
- Bennett CL, Calhoun EA. Evaluating the total costs of chemotherapy-induced febrile neutropenia: results from a pilot study with community oncology cancer patients. Oncologist 2007;12:478-83