
Abstract
Background Lung cancer is the most common type of cancer in the world and is associated with significant mortality. Nivolumab demonstrated statistically significant improvements in progression-free survival (PFS) and overall survival (OS) for patients with advanced squamous non-small cell lung cancer (NSCLC) who were previously treated. The cost-effectiveness of nivolumab has not been assessed in Canada. A contentious component of projecting long-term cost and outcomes in cancer relates to the modeling approach adopted, with the two most common approaches being partitioned survival (PS) and Markov models. The objectives of this analysis were to estimate the cost-utility of nivolumab and to compare the results using these alternative modeling approaches.
Methods Both PS and Markov models were developed using docetaxel and erlotinib as comparators. A three-health state model was used consisting of progression-free, progressed disease, and death. Disease progression and time to progression were estimated by identifying best-fitting survival curves from the clinical trial data for PFS and OS. Expected costs and health outcomes were calculated by combining health-state occupancy with medical resource use and quality-of-life assigned to each of the three health states. The health outcomes included in the model were survival and quality-adjusted-life-years (QALYs).
Results Nivolumab was found to have the highest expected per-patient cost, but also improved per-patient life years (LYs) and QALYs. Nivolumab cost an additional $151,560 and $140,601 per QALY gained compared to docetaxel and erlotinib, respectively, using a PS model approach. The cost-utility estimates using a Markov model were very similar ($152,229 and $141,838, respectively, per QALY gained).
Conclusions Nivolumab was found to involve a trade-off between improved patient survival and QALYs, and increased cost. It was found that the use of a PS or Markov model produced very similar estimates of expected cost, outcomes, and incremental cost-utility.
Introduction
Background on lung cancer
In Canada, as in the rest of the world, lung cancer is a major health burden. Lung cancer is one of the most common types of cancer, and in 2012 there was an estimated 1.8 million new lung cancer cases worldwideCitation1. Based on Canadian Cancer Statistics, a total of 26,600 new cases of lung cancer were estimated for 2015Citation2, and lung cancer remains the second and third most common cancer for males and females, respectivelyCitation2,Citation3. Survival rates from lung cancer are low because most patients are not diagnosed until the disease is already at an advanced stage. Consequently, the majority of patients with lung cancer die within the first year of their diagnosis. In fact, lung cancer is the leading cause of death from cancer, and an estimated 20,900 Canadians died from lung cancer in 2015Citation2. The prognosis of advanced NSCLC is very poor, with median OS from diagnosis of 4.9 months, and 1- and 2-year OS rates of 23% and 7%, respectivelyCitation4.
In addition to the high mortality associated with lung cancer, a large portion of patients experience a significant decline in their quality-of-life (QoL) due to severe morbidity from local and metastatic spread of disease. According to an analysis by the Public Health Agency of Canada in 2008, lung cancer was the third most costly malignant neoplasm in Canada and accounted for more than $390 million in direct and indirect costsCitation5. This financial burden included $346 million in direct healthcare costs (i.e., hospital, drug, and physician costs), and almost $44 million in indirect costs resulting from lost productivity due to illness or premature death.
Lung cancers are broadly divided into NSCLC and small cell lung cancer for treatment purposes. NSCLCs represent ∼80% of all lung cancers and the two main sub-types or histologies are squamous and adenocarcinoma. Squamous and non-squamous NSCLC account for ∼20% and 80%, respectively, of all advanced NSCLCCitation6. Evaluation of the sub-type and stage of lung cancer is an integral component of treatment planning. Staging, which determines the location and how advanced the cancer is, is critical in NSCLC as it is used as a prognostic indicator and informs the therapeutic decision-making processCitation7.
Current lung cancer treatment
As the majority of patients with NSCLC are diagnosed in the advanced stage of disease, current goals of treatment are rarely curative and usually focus on controlling the spread of the disease. Generally, the aims of current therapies are to prolong survival, alleviate symptoms, and/or improve the QoL of the patient. Recent trials have shown evidence that patients with squamous histology have worse OS than patients with adenocarcinomaCitation8,Citation9. Also, differences exist in the molecular profile of squamous and non-squamous NSCLC. For example, mutations of the Epidermal Growth Factor Receptor (EGFR), or anaplastic lymphoma kinase (ALK), are rare in squamous cancersCitation10. Although chemotherapy offers only limited benefit in terms of survival and is highly toxic, leading to hospitalization rates as high as 51%Citation11, it remains the mainstay of treatment for squamous NSCLC patients. Consequently, patients with squamous NSCLC have a significant unmet medical need.
The current standard of care (SOC) for NSCLC in CanadaCitation6,Citation12,Citation13 is aligned with the American Society of OncologyCitation14,Citation15, the National Comprehensive Cancer NetworkCitation7, and European Society Medical Oncology guidelinesCitation16. For NSCLC patients who progress during or following first-line therapy, docetaxel and erlotinib are the established second-line agentsCitation6,Citation12,Citation13. Erlotinib has been shown to be modestly superior to placebo in second- and third-line squamous NSCLCCitation17. Conventional anti-cancer therapies generally act through cytotoxicity. However, in recent years, other approaches to cancer treatment have been investigated. Specifically there has been an increase in knowledge regarding the relationship between cancer and the host’s immune system.
Nivolumab is a fully human immunoglobulin G4 (IgG4) monoclonal antibody (HuMAb) that binds to PD-1 receptors and blocks their interaction with PD-L1 and PD-L2, thereby preventing activation of the PD-1 pathway and, thus, enhancing T-cells response. This results in increased activity of the immune system against tumor cells. Health Canada is currently reviewing the use of nivolumab with the indication for the treatment of patients with locally advanced (stage 3B) or metastatic (stage 4) NSCLC with progression on or after chemotherapy. The indication under review includes both squamous and non-squamous histologies. The cost-effectiveness of nivolumab has not previously been assessed in Canada.
Choice of modeling approaches for cancer interventions
A highly contentious component of modeling cancer diseases and interventions relates to the modeling approach used to estimate long-term costs and effects. Uncertainty in economic evaluations is typically addressed using one-way and probabilistic sensitivity analyses. However, these approaches address parameter (i.e., stochastic) uncertainty or modeling assumptions (i.e., time horizon or discount rates). Structural uncertainty (i.e., alternative model structures or alternative modeling approaches) is typically not addressed in most economic evaluations due to the additional time and resources required for their consideration. The choice of model structure is rarely discussed in published studies, but can affect the results producedCitation18. Many papers describe good modeling practices, but few describe how to choose from the many types of available models.
Markov models are commonly used for the economic evaluation of health technologies as they may offer more flexibility in terms of data source and number of health states. However, simplifying assumptions are often made in many Markov models due to limited disease data or model complexity (e.g., multiple transition probabilities, potential interactions, and cycle length). Partitioned Survival (PS) models are commonly used in oncology applications as they represent a more straightforward modeling option when patient level-data are available. The advantage of developing PS models is that this approach uses survival data which has already been produced in reporting the clinical trial results and circumvents the need to estimate transition probabilities.
Estimating the cost-effectiveness of cancer therapies is critically dependent not only on the relative efficacy of treatments observed in clinical trials or obtained from indirect treatment comparisons, but also on the model structure and assumptions used for projecting PFS and OS. Numerous publications and good practice guidelines have been developed specifically around fitting curves to observed PFS and OS Kaplan-Meier curvesCitation19–21. It is generally recommended that explicit criteria be used to select the ‘best fitting curves’ and that the implications of using alternative curves be permitted in models through sensitivity analyses (e.g., see the methods section below).
Markov and PS models are the two most common modeling approaches used for estimating long-term costs and effects in the cancer field. However, there is a paucity of data on the structural uncertainty implications of using one type of modeling approach compared to the other. Based on simulated data, Coyle and CoyleCitation22 compared the cost-effectiveness results using a PS and Markov model and found that PS models may have an inherent bias in favor of interventions with a disease progression advantage. The authors, therefore, concluded that PS models should not be used as an appropriate basis for reimbursement decision-making. Similarly, using a hypothetical example, Beca and HochCitation23 concluded that there might be a potential for bias when using one method of extrapolation from PS models. However, aside from these two hypothetical examples, no real world empirical example has been published based on high quality and properly constructed models that allows for an appropriate and rigorous comparison of the differences in cost-effectiveness results obtained from using alternative modeling approaches.
Objectives
There are two main objectives of this paper. First, to evaluate the value-for-money of nivolumab compared to existing SOC for the treatment of patients with locally advanced or metastatic (Stage IIIb/IV) squamous NSCLC who have been previously treated. In particular, the incremental cost-effectiveness and cost-utility of nivolumab in squamous NSCLC was compared against docetaxel and erlotinib. The second objective was to compare the differences in cost-utility results for nivolumab compared to SOC treatments when using alternative modeling approaches. Specifically, the results obtained from using a PS model were compared to the results using a more traditional Markov model.
Methods
This section provides details of the methods used for the development of the model, data inputs, data analysis, presentation of results, and comparison of results using alternative modeling approaches.
Overview of nivolumab clinical trials in NSCLC
For the purpose of economic modeling, three key nivolumab clinical trials were utilized. These trials are outlined in Supplemental Table 1. Further details of the Checkmate 017 clinical trial are provided below, as data from this trial were used directly as inputs in the model. Checkmate 003 and Checkmate 063 trials were used primarily for model validation purposes. As outlined in Supplemental Table 1, the key population from trial 017 included advanced squamous NSCLC patients who have failed one prior platinum doublet-based chemotherapy treatment. Supplemental Table 2 provides a summary of the key characteristics of patients enrolled in the Checkmate 017 trialCitation24.
In this study, nivolumab demonstrated a statistically significant benefit in OS compared with docetaxelCitation24. Median OS and 12-month OS were statistically higher in the nivolumab group compared to the docetaxel group. provides a summary of the key OS results from the Checkmate 017 study, and presents the OS Kaplan-Meier (KM) curves for the trialCitation24. provides a summary of the key PFS results from the Checkmate 017 study, and presents the KM results for PFS. The statistically significant difference in the primary outcome of OS was also observed in the KM survival curves for PFS, where treatment with nivolumab resulted in a statistically significant improvement in PFS compared with docetaxel. Median PFS at 12-months was higher in the nivolumab group compared to the docetaxel group (20.8% vs 6.4%).
Figure 1. Kaplan–Meier overall survival curves for the Checkmate 017 trialCitation24.
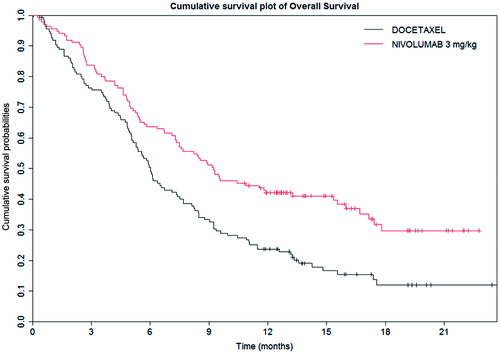
Figure 2. Kaplan-Meier progression-free survival for the Checkmate 017 trialCitation24.
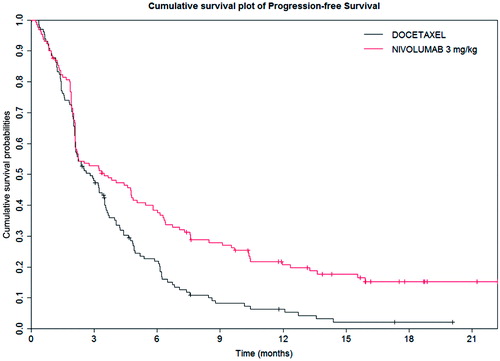
Table 1. Overall survival results from the Checkmate 017 trial.
Table 2. Progression-free survival results from the Checkmate 017 trial.
Table 3. Cost-effectiveness and cost-utility results using the PS model.
Clinical trial data inputs into the model
The PFS and OS curves from the clinical trial were used to populate the PS and Markov models. Since the time horizon for the model was greater than the trial duration, it was necessary to extrapolate PFS and OS beyond the follow-up period of the clinical trial. In order to do this, parametric survival curves were fitted to the Checkmate 017 patient-level trial data for the purposes of extrapolation. The process for fitting parametric survival curves to patient-level data was based on methods guidance from the Decision Support Unit (DSU) at the National Institute for Health and Care Excellence (NICE)Citation20,Citation21. Supplemental Figure 1 provides a visual depiction of the process undertaken for identifying the parametric survival model for both PFS and OS. The following process was used to determine the most appropriate fit for the PFS and OS curves in the model:
| (1) | Testing of proportional effects assumption—the log cumulative hazards, log cumulative odds, and standardized normal curve plots were assessed to determine if the data from the Checkmate 017 clinical trial indicated proportional effects. This was conducted by visual inspection to determine if the survival curves of nivolumab and docetaxel were parallel; | ||||
| (2) | If proportional effects held, a range of parametric survival distributions were explored. A summary of the survival distributions used in the parametric modelling is provided in Supplemental Table 3; | ||||
| (3) | The Akaike Information Criterion (AIC) and Bayesian Information Criterion (BIC) goodness-of-fit statistics were assessed for the various parametric survival distributions to identify the best fitting survival curves; | ||||
| (4) | The final choice of parametric survival distributions used for the base case curve analyses was based on visual inspection of the model’s goodness-of-fit (compared with study KM plots) and clinical plausibility of the extrapolated survival at 5, 10, 15, and 20 years. Specifically, data from the other nivolumab trials (Checkmate 003 and 063) and real-world Surveillance Epidemiology and End-use Registry (SEER) data were utilized for external validation; and | ||||
| (5) | In the event that proportional effects did not hold, both independent survival curves and survival curves adjusted for shape and scale were assessed. Following this, the same approach as if proportional effects did hold was used to identify the base case survival curve to use in the model (i.e., goodness of fit, visual inspection, and clinical plausibility). | ||||
As PFS is believed to be a key driver for OS, the trial data used to estimate the proportion of patients in PFS over time was analysed first. The choice of a parametric survival curve was informed by the assessment of proportional effects by comparing PFS event data from the Checkmate 017 trial for both nivolumab and docetaxel. Visual inspection of the log-cumulative hazards, log-cumulative odds, and standardized normal curve plots demonstrated that the proportional hazards assumption did not hold for PFS. These graphs are presented in Supplemental Figures 2a–d. In addition, a Grambsch and Therneau’s correlation test between Schoenfeld residuals and log of time use to test proportional hazards was performed and returned a p-value of 0.0119, indicating the rejection of proportional hazardsCitation25.
As the proportional hazard assumption did not hold for PFS, independent parametric survival curves were fitted separately for the docetaxel and nivolumab arms of the Checkmate 017 trial. The best fitting independent curves were determined using the AIC and BIC goodness of fit criteria, as well as visual inspection of the fitted curves. Supplemental Tables 4 and 5 contain the AIC and BIC criteria results and Supplemental Figures 3a and b present the visual plots showing how the curves fit to the observed data. Based on these results, the log-normal distribution fit to PFS data in the docetaxel arm and the generalized gamma distribution fit to PFS data in the nivolumab arm were chosen for the base case analysis. Supplemental Tables 6 and 7 present the fitted coefficients for these curves.
The choice of a parametric OS curve was informed by the assessment of proportional hazards by comparing OS data for nivolumab and docetaxel from the Checkmate 017 trial. Initial visual inspection of the log-cumulative hazards, log-cumulative odds, and standardized normal curve plots showed that lines were not parallel. These graphs are presented in Supplemental Figures 4a–d. However, further investigation of the early portion of the cumulative survival curve was conducted and, after two patients were removed who never received treatment, parallel lines were seen throughout the time horizon of the plots, suggesting that the proportional hazards assumption held for OS between nivolumab and docetaxel within the Checkmate 017 trial.
As proportional hazards could be demonstrated for OS, a single parametric curve was fitted to the docetaxel and nivolumab arms of the Checkmate 017 trial with an adjustment factor (i.e., coefficient) for treatment effect. Supplemental Table 8 provides a summary of the AIC and BIC goodness-of-fit statistics for the single curve. The log-logistic curve was determined to be the best fitting curve according to AIC and BIC criteria. Supplemental Figure 5 provides a visual depiction of the log-logistic curve fit to the docetaxel data.
The incidence of drug-related AEs for patients treated with nivolumab and docetaxel were also taken from the Checkmate 017 clinical trial. In the base case analysis for the model, drug related AEs of Grade 3 or higher with an incidence ≥ 2% were includedCitation24,Citation26. Supplemental Table 9 summarizes the AE data included in the base case for the economic models. If the AE did not make the ≥2% incidence cut-off, it was not included in the base case analysis of the model. In the event a specific AE made the ≥2% incidence cut-off in one arm of the trial (i.e., either docetaxel or nivolumab), the rate associated with the AE in the other arm was included, even if it was < 2% incidence in the other arm. This was done in order to provide consistency in the handling of AEs across study arms.
Indirect treatment comparison
In newly diagnosed treatment-naive NSCLC patients, platinum-based chemotherapy remains the first-line SOC treatment option in Canada. For patients who progress during or following first-line therapy, docetaxel and erlotinib are the established second-line agents for squamous NSCLCCitation6,Citation12,Citation13. Since there were no trials comparing nivolumab to erlotinib in second-line treatment, an indirect treatment comparison (ITC) was conductedCitation27. The primary purpose of the ITC was to identify data on relevant squamous NSCLC nivolumab comparators other than docetaxel. Based on currently available funded options for NSCLC treatment in Canada, the ITC specifically targeted erlotinib in patients who have failed at least one prior chemotherapy treatmentCitation27. The evidence incorporated into the ITC of the relative effect of erlotinib compared to docetaxel was based on the single study providing a comparison of these agents in a second-line squamous NSCLC patient populationCitation28.
Structure of the PS and Markov models
Consistent with previously published models in NSCLC, a three health state cohort-based model was used. To also address structural modeling uncertainty, two versions of the model were developed: a PS and Markov model. Although these models have the same general structure (e.g., health states, transitions to health states) and use many of the same data inputs, they do require some information unique to each type of model.
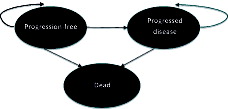
Both models were developed in Microsoft Excel and programmed using standard Excel functions with some visual basic programming for running of Monte-Carlo simulations in the probabilistic sensitivity analysis (PSA), for generating survival estimates, or for navigation purposes. As shown in , the structure of the model was comprised of three key health states: progression-free (PF), progressed disease (PD), and death. These health states correspond to the primary and secondary end-points of the Checkmate 017 trial. The expected costs, quality-of-life, and rates of mortality associated with each health state are discussed below. The transitions between health states in the model over time (i.e., the arrows in ) were derived from the pivotal clinical trial data or from the ITC.
Figure 3. Health state structure for the economic models.
For the PS model, the PFS and OS curves were used to estimate the proportion of patients in each health state over time. An illustration of how PFS and OS data from clinical trials were used in a PS model is presented in Supplemental Figure 6. As shown by the vertical dashed line at 3 years, the PS model estimated the proportion of patients who have died as one minus the OS curve, the proportion of patients who were in PD from the difference between the OS and PFS curves, and the proportion of patients who were PF as the percentage of patients on the PFS curve.
The Markov model was constructed using time-dependent transition probabilities for each health state. While the PS model used OS and PFS curves to estimate cumulative survival over time, the Markov model used time to progression (TTP) to provide an additional level of information about the number of patients transitioning from the PF health state to PD or death health states over time. Parametric curves were fitted to the TTP, OS, and PFS data from the Checkmate 017 trial to estimate the proportion of patients who were free of progression (i.e., PF), and who were dead (i.e., from the OS curves) throughout the duration of the time horizon specified in the model. Changes in these proportions over time were then used to calculate the probability of patients transitioning from PF to PD, from PF to death, and from PD to death at each cycle. As with the PS model, the process for fitting parametric survival curves to patient-level data was based on methods guidance from the DSU at the NICECitation19–21. Supplemental Figure 1 provides a visual depiction of the process undertaken for identifying the parametric survival models for PFS, TTP, and OS in the Markov model.
Model assumptions
Clinical evidence indicates that nivolumab has durable long-term survival benefits for patients continuing to take treatment until progression. In order to fully capture the benefits of nivolumab in comparison to alternative systemic therapies, a variable time horizon was programmed into the models. Based on each patient’s average age at time of diagnosis, the estimated maximum lifetime for patients with NSCLC was assumed to be 20 years. However, the base case time horizon chosen for the model was 10 years.
In line with guidance from the Canadian Agency for Drugs and Technologies in Health (CADTH)Citation29,Citation30, the study perspective (or cost viewpoint) of a publicly funded healthcare system was assumed; a 5% discount rate was accordingly considered for costs, QALYs, and LYs, which were estimated to occur in future years in the base case analysis.
The model assumed all treatments were administered until disease progression (i.e., PD) as per their respective indications in Canada.
Quality-of-life and utility values
The Checkmate 017 trial collected patient reported outcomes using the Euroqol 5 dimension (EQ-5D) utility instrument. Analyses were conducted using the trial results and Canadian specific scoring algorithms to estimate Canadian specific utility values for each health state. Based on the analyses of the trial data, the utility value estimated for PF was 0.789 (95% CI = 0.778–0.799) and for PD was 0.674 (95% CI = 0.647–0.702).
A review of previous HTA submissions to NICE in advanced NSCLC was conducted to identify disutilities associated with AEs. Disutilities were applied to AEs likely to have a quality-of-life impact (i.e., fatigue, asthenia, pneumonia, neutropenia, febrile neutropenia, and anemia). The utility decrement associated with the AE and the duration of the AE were combined into a single disutility value which was applied each time an AE was experienced by a patient in the model. These disutilities and sources for the disutility values are presented in Supplemental Table 10.
Resource use and costing
This sub-section summarizes the cost inputs that were used in the model. All costs and resource use inputs were obtained from publicly available sources, published health economic literature, and/or expert opinion. Treatment algorithms and costs for the management of grade III/IV toxicities were obtained from the published literature and from three Canadian medical oncologists who were involved in the treatment of patients with lung cancer. All cost inputs from prior years used in the model were inflated to 2015 values using the healthcare component of the Consumer Price Index (CPI)Citation31.
Disease management costs
The model accounted for disease management costs for patients in the PF and PD health states. The disease management cost per 4 weeks for each health state was calculated based on a breakdown of health state specific resource use. Canadian-specific unit costs were applied to each resource use. Unit costs were taken from the Ontario Schedule of Benefits where possibleCitation32. Unit costs which were not available from the Ontario Schedule of Benefits were sourced from the literature. The resource use and unit costs associated with disease management are detailed in Supplemental Tables 11a and b.
End-of-life costs were applied as a fixed cost upon the death of each patient in the model. A Canadian study into the cost of palliative care was used for terminal care costs for patients in a hospital, hospice, and home settingCitation33. As no Canadian specific sources were provided for the distribution of patients managed across each of these settings, this percentage was taken from a NICE submission for erlotinib and gefitinib in NSCLCCitation34. The unit costs and distributions are presented in Supplemental Table 12.
Drug acquisition costs
The analysis included drug acquisition costs for nivolumab, docetaxel, and erlotinib. In addition, drug acquisition costs for carboplatin, gemcitabine, vinorelbine, and cisplatin were included as subsequent treatments after disease progression. The latter agents are not considered SOC, but can be used after docetaxel and erlotinib. Formulations, vial sizes, and unit costs used in the analysis are shown in Supplemental Table 13, along with data sources. Drug acquisition and administration costs were obtained from the pharmacy departments of two treatment centers to ensure consistency in cost estimationCitation35,Citation36.
Drug administration costs
Drug administration costs were also included in the analysis and were applied at the same rate as treatment frequency. Administration costs were obtained from the pharmacy departments of two treatment centersCitation35,Citation36 in collaboration with a local health economic expertCitation37–39. These costs were based on a breakdown of costs associated with administration, pre-medication, and hospital visit time. Drug administration costs used in the analysis are shown in Supplemental Table 14 by drug.
Drug monitoring costs
Monitoring costs were included in the analysis as a fixed cost once every 4 weeks. The frequency and type of monitoring tests required was provided by a local health economic expertCitation37–39. It was assumed that patients would require one complete blood count the day before each administration. The unit cost of a complete blood count (i.e., $10.95) was taken from the Ontario Schedule of BenefitsCitation32. The cost of physician visits associated with monitoring was assumed to be included under disease management costs (see Supplemental Tables 11a and b). The additional monitoring costs associated with testing, which was assumed for each treatment, is provided in Supplemental Table 15.
Cost of subsequent treatment
The analysis included subsequent treatment a patient would receive once they progressed (i.e., PD). Information regarding the percentage of patients receiving subsequent treatment and the type of treatment they received was derived from the Checkmate 017 trial data. As shown in Supplemental Table 16, the proportion of patients receiving subsequent treatment was 36% and 30% for nivolumab and docetaxel treated patients, respectively. The mean duration of subsequent treatment was estimated to be 3.54 months based on data from the Leading the Evaluation of Non-squamous and Squamous (LENS) NSCLC studyCitation40. It was assumed that patients who started on other comparator treatments from the ITC (i.e., erlotinib) would have the same distribution of subsequent treatment as observed for docetaxel patients. It was also assumed that the drug acquisition, administration, and monitoring costs presented in Supplemental Tables 13–15 also applied to subsequent treatment.
Cost of treatment-related adverse events
The AEs included in the analysis, the assumed cost per event, and the data source for the cost of AE are provided in Supplemental Table 17. These costs were the costs applied to AEs of Grade 3 or higher.
Analyses of uncertainty
The base case analysis was a deterministic model using the patient populations, analytic model structure, model assumptions, and point estimate input estimates described above. In addition to the base case deterministic analysis, analyses of uncertainty were undertaken to examine the impact on the cost-effectiveness and cost-utility results.
Methodological uncertainty—one-way sensitivity analyses
A number of one-way sensitivity analyses were conducted on the deterministic models to test alternative modeling assumptions and alternative values for key model parameters. Depending on data availability, the ranges considered in the one-way sensitivity analyses included pre-specified values, standard errors, 95% confidence intervals, or ±20% of the base case values. The variables or assumptions included in the one-way sensitivity analyses, the lower and upper values considered for each variable or assumption, and the rationale for the ranges considered are presented in Supplemental Table 18. The results from the one-way sensitivity analyses are presented in a Tornado diagram, showing sequentially the variables with the largest impact on the cost-utility results (i.e., largest impact on the top). The ranges in the cost-utility results were presented using bar charts for each variable.
Parameter uncertainty—probabilistic sensitivity analyses (PSA)
The overall impact of uncertainty in the model was assessed with PSA by defining distributions for key parameters in the model which are not known with certainty. The key parameters included in the PSA were clinical, resource use, unit cost, and quality-of-life (i.e., utility) variables. An overall summary of the variables included in the PSA, and the distributions applied to these variables, is provided in Supplemental Table 19. The PSA was run for 1000 iterations (simulations), and the results were plotted on the cost-effectiveness plane (CAP) as scatterplots. Cost-effectiveness acceptability curves (CEACs) were derived from the PSA results, showing the likelihood of nivolumab being cost-effective at various decision-maker willingness-to-pay thresholds (i.e., cost per QALY gained).
Model validation
A series of validation steps were untaken during the development, construction, and analysis of the models.
External expert opinion validation
Throughout the development of the economic model, external clinical and health economic experts were consulted, including:
| (1) | Consultation with two Canadian health economic experts, who helped to validate the model structure and key data inputs; | ||||
| (2) | Two European advisory workshops attended by four health economists representing four countries: United Kingdom (UK), Italy, Spain, and France. The primary purpose of these workshops was to help validate the model structure, survival projections, and other key model input values; and | ||||
| (3) | One UK advisory workshop attended by four health economists and three clinicians representing NICE, All Wales Medicines Strategy Group (AWMSG), and Scottish Medicines Consortium (SMC). Similar to the European workshop, the primary purpose of this workshop was to help validate the key inputs within the economic model and determine the base case scenario for the UK HTA agencies. | ||||
Validation of the parametric survival curves
The process for identifying the best fit for the parametric survival curves, and the resulting curves selected, were described above. These curves were validated against several sources of data, including:
The Phase III Checkmate 017 KM data reported in the clinical study report for PFS—specifically in terms of the median PFS, 6-month PFS rate, and 12-month PFS rates for nivolumab and docetaxelCitation24;
The Phase I safety study Checkmate 003 KM, which provides 3 years of PFS follow-up for patients receiving nivolumab for advanced squamous and non-squamous NSCLC across all three doses (1 mg/kg, 3 mg/kg, and 10 mg/kg)Citation41; and
The Phase II single arm Checkmate 063 KM data, which provides 6-month and 12-month PFS rates for patients receiving nivolumab for advanced squamous NSCLC patients at a 3 mg/kg doseCitation42.
Supplemental Table 20 provides comparative information of the parametric survival curves against the Checkmate 017, Checkmate 063, and Checkmate 003 trials in terms of PFS and OS. From this comparison it is evident that the parametric survival curves chosen for the analysis match closely the KM curves observed in the clinical trials.
Structural and data input validation, programming, de-bugging, and consistency checks
The PS and Markov models underwent a number of internal quality assurance processes, including:
Confirmation of all effectiveness, resource use, utilities, unit costs, and epidemiological data inputs into both models;
Validation of all formulae, equations, cell referencing, and cell links used in Excel to make sure they yield the expected calculations and translate the model structure correctly;
Validation of macros and visual basic coding to ensure all programming is functioning correctly;
Validation of Excel layout/format of worksheets, including readability, grammar of text, consistency of terminology within the text, readability, and table layouts of technical report;
Model functionality tests (e.g., by imputing extreme values and ascertaining whether the model yielded expected results); and
Final internal quality assurance processes for both models by an external vendor hired to critically review all aspects of the models, including model design and functionality.
Results
This section provides details of the findings for the base case analyses for both the PS and Markov models and for the analyses of uncertainty.
Deterministic base case results
presents the base case results of the cost-effectiveness and cost-utility analyses using the PS model. It was found that nivolumab treated patients had the highest expected per patient cost (i.e., $139,017), but also had the highest expected LYs (i.e., 1.69) and QALYs (i.e., 1.24) per patient compared to docetaxel and erlotinib. Nivolumab was found to result in an increased per patient cost of $100,168 and $99,084, an increased life expectancy (discounted) of 0.82 and 0.93 years, and an increased quality-adjusted life expectancy (i.e., QALYs) of 0.66 and 0.70 when compared to docetaxel and erlotinib, respectively. With respect to value-for-money, nivolumab was found to cost an additional $121,905 and $106,734 per LY gained compared to docetaxel and erlotinib, respectively. In terms of QALYs, nivolumab cost an additional $151,560 and $140,601 per QALY gained compared to docetaxel and erlotinib. also provides a breakdown of expected costs, where it can be seen that 69% of the total cost for nivolumab was due to drug acquisition, treatment administration, and treatment monitoring costs.
Table 4. Cost-effectiveness and cost-utility results using the Markov model.
presents the base case results of the cost-effectiveness and cost-utility analyses from the Markov model. It was found that patients treated with nivolumab had the highest expected per patient cost (i.e., $139,016), but also had the highest expected LYs (i.e., 1.68) and QALYs (i.e., 1.23) per patient compared to docetaxel and erlotinib. Nivolumab was found to result in an increased per patient cost of $100,204 and $99,096, an increased discounted life expectancy of 0.82 and 0.92 years, and an increased quality-adjusted life expectancy (i.e., QALYs) of 0.66 and 0.70 when compared to docetaxel and erlotinib, respectively. Using the Markov model, nivolumab was found to cost an additional $122,834 and $107,833 per LY gained, and $152,229 and $141,838 per QALY gained compared to docetaxel and erlotinib. In comparing the results from the Markov model to the results from the PS model (i.e., vs ), it is apparent that using either structural modeling approach produced very similar expected costs, expected outcomes, and incremental cost-effectiveness and cost-utility ratios.
Table 5. One-way cost-utility sensitivity analyses for nivolumab compared to docetaxel based on the PS model.
Methodological uncertainty—one-way sensitivity analyses
Since it was found that the results from the PS and Markov models were so similar, the results for the analyses of uncertainty are presented here only for the PS model. However, it should be emphasized that the uncertainty results from the Markov model matched very closely with the results from the PS model.
Results of the one-way sensitivity analyses carried out for nivolumab vs docetaxel are presented in and summarized in the Tornado diagram in . These results were based on varying model input parameters in the deterministic model. The sensitivity analyses results in and are presented for the cost-utility analysis model output only (i.e., cost per QALY gained). As can be seen from the results in and the Tornado diagram in , changes in utility values and average body weight had the largest impact on the ICUR results. Across the variables and ranges tested in the one-way analyses of uncertainty, the ICUR results ranged from $123,000–$191,000 per QALY gained. As shown in , the base case ICUR for nivolumab vs docetaxel was $152,000 per QALY gained.
Figure 4. Tornado diagram of one-way sensitivity analyses results for nivolumab compared to docetaxel based on the PS model. COM, comparator; INT, intervention; PD, progressed disease; PF, progression-free; PFS, progression-free survival.
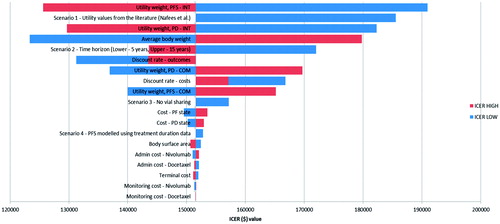
Table 6. Probabilistic cost-utility sensitivity analyses based on the PS model.
Parameter uncertainty—probabilistic sensitivity analyses
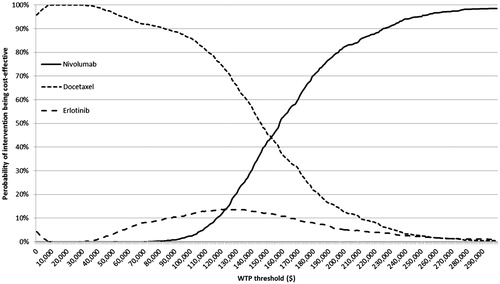
Probabilistic sensitivity analyses were conducted for nivolumab relative to both comparators (i.e., docetaxel and erlotinib) in both models. The mean results based on 1000 simulations of the probabilistic model are summarized in . It was found that the PSA results in were very close to the base case results for this population (e.g., $158,154 vs $151,560 per QALY gained for nivolumab vs docetaxel). The PSA results were also plotted on the CAP for nivolumab vs docetaxel (see ) and for nivolumab vs erlotinib (see ). As shown in and , all 1000 simulation results from the PSA fell in the Northeast quadrant of the CEP, indicating that nivolumab was more effective, but also more costly in all simulated runs of the model. Based on the PSA results, the probability of each treatment being cost-effective at different decision-making thresholds (i.e., willingness-to-pay per QALY gained) is presented in . As can be seen from the CEACs, nivolumab has the highest probability of being cost-effective at willingness-to-pay thresholds above $158,000 per QALY gained.
Figure 5. Cost-effectiveness scatterplot—nivolumab vs docetaxel. ICER, incremental cost-effectiveness ratio; QALY, quality adjusted life year.
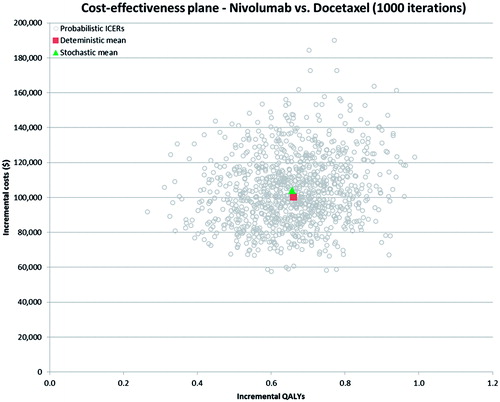
Figure 6. Cost-effectiveness scatterplot—nivolumab vs erlotinib. ICER, incremental cost-effectiveness ratio; QALY, quality adjusted life year.
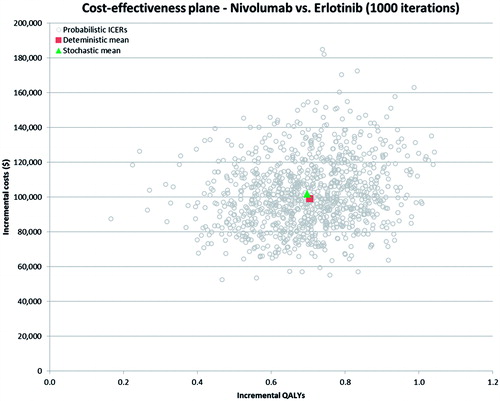
Figure 7. Multiple cost-effectiveness acceptability curves. WTP, willingness-to-pay per quality adjusted life year (QALY) gained.
Discussion
Two economic models were developed to estimate the cost-effectiveness and cost-utility of nivolumab compared to alternative SOC treatments for patients with advanced squamous NSCLC who have failed at least one prior chemotherapy treatment. The analyses found that nivolumab is expected to result in higher costs per patient, but also improved outcomes in terms of LYs and QALYs compared to existing SOCs (i.e., docetaxel and erlotinib).
When interpreting results from a cost-utility analysis, one must consider the maximum that a decision-maker is willing to pay (WTP) for one QALY gained. In Canada, there is no universal consensus of what constitutes an acceptable cost-utility threshold per se, but rather a range of incremental cost per QALY gained values, which, when considered in the context of a decision-maker’s priorities and the interventions’ place in therapy, may be considered acceptable. Many factors in addition to the cost-utility ratio affect the ultimate decision on drug reimbursement in Canada. This includes factors such as available resources, drugs for rare diseases, drugs that increase survival, ethical considerations, and the capacity for inappropriate utilization. This is evidenced by the fact that the pan-Canadian Oncology Drug Review (pCODR) has made positive funding recommendations for oncology drugs with various incremental cost-utility ratios, some well in excess of $100,000 per QALY gainedCitation43–46.
It was also found that the use of alternative modeling approaches (i.e., PS or Markov model) had very little impact on the expected costs, LYs, QALYs, and incremental cost-utility estimates. This is in contrast to two hypothetical examples which postulated that the use of PS models may result in biased estimates that favor interventions with a disease progression advantageCitation22,Citation23. Although hypothetical examples can be constructed to demonstrate the potential for biased estimates, the results from this analysis demonstrate the need for more rigorous comparisons based on high quality and properly constructed models. As in all components of economic disease modeling, good principles and practices must be followed to produce valid and reliable cost-effectiveness estimates. The current real-world empirical example demonstrated that accuracy of the modeling results is indeed influenced by the correct application of the model and not by the model type itself.
The results of this economic evaluation should be considered in the context of the unmet need within NSCLC. The survival prognosis in lung cancer has not improved significantly compared to other cancer sites. For example, when comparing data from 1975–1977 and 2003–2009, 5-year survival rates in lung cancer have only improved by 6%, in comparison to other cancer sites which have seen 15% (breast, colon) to 30% (prostate) improvementsCitation3,Citation47–49. In addition, lung cancer also has a significant disease burden. Lung cancer has been the most common cancer in the world for several decades. In 2012, there were an estimated 1.8 million new lung cancer cases worldwide, and an estimated 1.59 million patients died due to lung cancer, accounting for ∼19.4% of total cancer deathsCitation1. In Canada, the incidence rates of lung cancer are 58 per 100,000 and 48 per 100,000 for men and women, respectively, with a total of nearly 26,100 new cases in 2014Citation2. In addition, it is estimated that 20,900 Canadians died from lung cancer in 2014, representing 27% of all cancer deathsCitation2.
Within this disease landscape, nivolumab has the potential to bring significant health benefits to patients in comparison to standard chemotherapy treatment options. Clinical data of nivolumab in previously treated squamous NSCLC patients presents a compelling case that nivolumab represents a major advance in disease management, where few effective treatment options have been available, and where current treatment options have been poorly tolerated with moderate efficacy. Data from the Checkmate 017 study show that nivolumab provides unprecedented survival benefits with a clinically meaningful and statistically significant improvement in OS observed (HR = 0.59; 95% CI = 0.44–0.79; stratified long-rank test p-value = 0.0002). The 1-year survival rates were 42% in the nivolumab group and 24% in the docetaxel groupCitation24. Furthermore, the clinical studies show that nivolumab is associated with a favorable AE profile relative to docetaxel, with lower rates of drug-related AEs leading to discontinuation observed in the nivolumab group compared to the docetaxel group, and fewer drug-related AEs reported.
As with all economic evaluations, there are a number of strengths and limitations associated with this analysis. The key strengths of the economic evaluation include:
The health state structure—the three health state PS analysis model structure used has been extensively validated and applied in numerous previous technology appraisals. The results obtained from the PS model structure were corroborated from the results obtained by using a Markov model structure;
The key value of nivolumab is the potential for long-term durable survival benefits. Within the economic model the long-term OS extrapolations were validated against both real world data from the SEER registry and a Phase I clinical study of nivolumab with 3 years of follow-up;
Health state utility weights were derived from EQ-5D data collected in the Checkmate 017 study; and
The underlying modeling methodology underwent extensive validation, including validation by local Canadian experts in health economics, as well as advisory panels with a range of external health economists representing France, Italy, Spain, the UK, and Canada.
The key limitations of the economic evaluation include:
The inclusion of additional comparators other than docetaxel relied on a network meta-analysis of clinical trials in second-line squamous NSCLC;
Long-term PFS and OS needed to be projected based on fitting curves to the observed trial data. Although numerous survival curve options have been included in the model for sensitivity analysis purposes, uncertainty still remains about survival extrapolations beyond the trials;
Regarding AEs, only drug related AEs with ≥2% incidence and Grade 3 or more were included. This could under-estimate the impact of AEs in the model as nivolumab has a more favorable tolerability profile than docetaxel; and
The disutility of AEs was not directly reported in the Checkmate 017 trial, and these were, therefore, sourced from the published literature and were only available for a UK population—this, however, is unlikely to have any notable impact on the results.
Conclusions
For patients with advanced squamous NSCLC, nivolumab was found to have the highest expected per patient cost, but also higher LYs and QALYs compared to docetaxel and erlotinib. Nivolumab was found to cost an additional $121,905 and $106,734 per LY gained and an additional $151,560 and $140,601 per QALY gained compared to docetaxel and erlotinib, respectively, when using a PS modeling approach. The cost-utility estimates using a Markov model were very similar (i.e., $152,229 and $141,838 per QALY gained, respectively). Assessing parameter uncertainty through PSA yielded similar results to the base case deterministic analyses. One-way deterministic sensitivity analyses revealed that utility values, time horizons, and body surface area were the key drivers of the cost-utility analysis results for both populations.
The use of a PS or Markov model produced very similar estimates of expected cost, outcomes, and incremental cost-utility. Based on our empirical real world example, this study demonstrates that Markov and PS models should produce similar results if constructed and validated properly. There are advantages and disadvantages to each modeling approach; however, assertions that one type of approach would consistently yield biased estimates based on a hypothetical example appears to be unfounded when compared to a well validated empirical example.
Transparency
Declaration of funding
This manuscript received funding from Bristol-Myers Squibb Canada.
Declaration of financial/other relationships
RG has received funding to conduct the analysis and write this paper from Bristol-Myers Squibb. JV, TM and JP are employees of Bristol-Myers Squibb and hold stock/shares in the company. LO is an employee of Bristol-Myers Squibb. JME peer reviewers on this manuscript have no relevant financial or other relationships to disclose.
Supplemental_figures.zip
Download Zip (396.3 KB)Supplemental_tables.zip
Download Zip (357.2 KB)Acknowledgment
The authors wish to thank Caitlin Smare and Meena Venkatachalam from Paraxel International Corporation, Waltham, MA, USA for their valuable contributions to the development of the models and for their summary of the findings.
Related Research Data
References
- World Health Organization. GLOBOCAN 2012: estimated cancer incidence, mortality and prevalence worldwide in 2012: Fact Sheet 2012. Lyon France 2012 http://globocan.iarc.fr/old/FactSheets/cancers/lung-new.asp. Accessed October 1, 2015
- Canadian Cancer Society. Lung cancer statistics 2015. Toronto, Ontario, Canada 2015 http://www.cancer.ca/en/cancer-information/cancer-type/lung/statistics/?region=on. Accessed October 1, 2015
- National Cancer Institute. Surveillance, Epidemiology, and End Results (SEER) Program: Table 15.6: Cancer of the Lung and Bronchus (Invasive): age-adjusted SEER Incidence Rates by Year, Race and Sex 2012. Bethesda, MD, USA 2012 http://seer.cancer.gov/archive/csr/1975_2011/browse_csr.php?sectionSEL=15&pageSEL=sect_15_table.06.html. Accessed October 1, 2015
- Penrod JR, Korytowsky B, Petrilla A, et al. Survival of US medicare patients with advanced Non-Small Cell Lung Cancer (NSCLC) by Line of Therapy (abstract 6582). J Clin Oncol 2014;32 S5
- Public Health Agency of Canada. The prevalence of chronic pain and pain-related interference in the Canadian population from 1994 to 1998. 2014. Ottawa, Ontario, Canada 2014 http://www.phac-aspc.gc.ca/publicat/hpcdp-pspmc/31-4/ar-04-eng.php. Accessed June 30, 2015
- Leighl N. Treatment paradigms for patients with metastatic non-small-cell lung cancer: first-, second-, and third-line. Curr Oncol 2012;19(1 Suppl):S52–S58
- National Comprehensive Care Network (NCCN). Guidelines for Non-small cell lung cancer v 7.2015. 2015. Fort Washington, PA, USA http://www.nccn.org/professionals/physician_gls/pdf/nscl.pdf. Accessed October 1, 2015
- Peterson P, Park K, Fossella F, et al. Is pemetrexed more effective in adenocarcinoma and large cell lung cancer than in squamous cell carcinoma? A retrospective analysis of a phase III trial of pemetrexed vs docetaxel in previously treated patients with advanced non-small cell lung cancer (NSCLC). J Thorac Oncol 2007;2:S851
- Scagliotti G, Hanna N, Fossella F, et al. The differential efficacy of pemetrexed according to NSCLC histology: a review of two phase III studies. Oncologist 2009;14:253–63
- Rekhtman N, Paik PK, Arcila ME, et al. Clarifying the spectrum of driver oncogene mutations in biomarker-verified squamous carcinoma of lung: lack of EGFR/KRAS and presence of PIK3CA/AKT1 mutations. Clin Cancer Res 2012;18:1167–76
- Prince R, Atenafu E, Krzyzanowska M. Hospitalizations during systemic therapy for metastatic lung cancer: a systematic review of RealWorld vs clinical trial outcomes. JAMA Oncol. 2015;1(9):1333-1339. 2015;doi:10.1001/jamaoncol.2015.3440(online September 17, 2015):E1-E7.
- Kulkarni S, Vella E, Coakley N, et al. The use of systemic treatment in the maintenance of patients with non-small cell lung cancer. Toronto, ON: Cancer Care Ontario, 2015. Program in Evidence-based Care Evidence-based Series No.: 7–22. 2015
- Goffin J, Lacchetti C, Ellis PM, et al. First-line systemic chemotherapy in the treatment of advanced non-small cell lung cancer: a systematic review. J Thorac Oncol 2010;5:260–74
- Masters GA, Temin S, Azzoli CG, et al. Systemic therapy for stage IV non-small-cell lung cancer: American Society of Clinical Oncology Clinical Practice Guideline Update. J Clin Oncol 2015;33:3488–515
- Leighl NB, Rekhtman N, Biermann WA, et al. Molecular testing for selection of patients with lung cancer for epidermal growth factor receptor and anaplastic lymphoma kinase tyrosine kinase inhibitors: American Society of Clinical Oncology endorsement of the College of American Pathologists/International Association for the study of lung cancer/association for molecular pathology guideline. J Clin Oncol 2014;32:3673–9
- Besse B, Adjei A, Baas P, et al. 2nd ESMO Consensus Conference on Lung Cancer: non-small-cell lung cancer first-line/second and further lines of treatment in advanced disease. Ann Oncol 2014;25:1475–84
- Shepherd FA, Rodrigues PJ, Ciuleanu T, et al. Erlotinib in previously treated non-small-cell lung cancer. N Engl J Med 2005;353:123–32
- Mandelblatt J, Fryback D, Weinstein M, et al. Assessing the effectiveness of health interventions. In: Gold M, Siegel J, Russell L, et al, eds. New York: Oxford University Press, 1996
- Latimer N. NICE DSU Technical Support Document 14: survival analysis for economic evaluations alongside clinical trials - Extrapolation with patient level data. 2011 National Institute for Health and Clinical Excellence (NICE) Decision Support Unit: Sheffield, UK available at: http://www.nicedsu.org.uk/NICE%20DSU%20TSD%20Survival%20analysis.updated%20March%202013.v2.pdf
- Latimer N. Survival analysis for economic evaluations alongside clinical trials—Extrapolation with patient-level data: inconsistencies, limitations, and a practical guide. MDM 2013;33:743–54.
- Royston P, Parmar M. Flexible parametric proportional-hazards and proportional-odds models for censored survival data, with application to prognostic modelling and estimation of treatment effects. Stat Med 2002;21:2175–97
- Coyle D, Coyle K. The inherent bias from using partitioned survival models in economic evaluation. Value Health 2014;17:A194
- Beca J, Hoch J. Exlporing the impact of structural uncertainty in partitioned survvial models for oncology. Value Health 2014;17:A205–6
- Brahmer J, Reckamp KL, Baas P, et al. Nivolumab versus docetaxel in advanced squamous-cell non-small-cell lung cancer. N Engl J Med 2015;373:123–35
- Grambsch T, Therneau T. Proportional hazards tests and diagnostics based on weighted residuals. Biometrika 1993;81:515–26
- Borghaei H, Paz-Ares L, Horn L, Spigel D, Steins M, Ready N, Chow L, Vokes E, Felip E, et al Nivolumab versus Docetaxel in Advanced Nonsquamous Non–Small-Cell Lung Cancer N Engl J Med 2015; 373(17):1627-1639
- Chandra A, Vanderpuye-Orgle J, Summers N, et al. Indirect treatment comparison of relative efficacy and safety of nivolumab versus relevant comparator treatments among advanced non-small cell lung cancer patients of squamous cell receiving second-line or higher therapy. Los Angeles, CA: Precision Health Economics, 2015
- Garassino M, Martelli O, Broggini M, et al. Erlotinib versus docetaxel as second-line treatment of patients with advanced non-small-cell lung cancer and wild-type EGFR tumours (TAILOR): a randomised controlled trial. Lancet Oncol 2013;14:981–8
- Canadian Agency for Drugs and Technologies in Health (CADTH). Guidelines for the economic evaluation of health technologies, 3rd edn. Ottawa, Ontario: CADTH; 2006. https://www.cadth.ca/media/pdf/186_EconomicGuidelines_e.pdf. Accesed October 1, 2015
- Canadian Agency for Drugs and Technologies in Health (CADTH). Addendum to the Canadian Agency for Drugs and Technologies in health guidelines for the economic evaluation of health technologies: specific guidance for oncology products. Ottawa, Ontario: CADTH; 2009. https://www.cadth.ca/sites/default/files/pdf/H0405_Guidance_for_Oncology_Prodcuts_gr_e.pdf. Accessed October 1, 2015
- Statistics Canada. Consumer Price Index, health and personal care, by province (monthly). Government of Canada, 2015. Ottawa, Ontario, Canada http://www.statcan.gc.ca/tables-tableaux/sum-som/l01/cst01/cpis13a-eng.htm. Accessed June 30, 2015
- Ontario Ministry of Health and Long-Term Care. Schedule of benefits for physician services under the Health Insurance Act 2015. Toronto, Ontario, Canada 2015 http://www.health.gov.on.ca/english/providers/program/ohip/sob/physserv/physserv_mn.html. Accessed June 30, 2015
- Walker H, Anderson M, Farahati F, et al. Resource use and costs of end-of-Life/palliative care: Ontario adult cancer patients dying during 2002 and 2003. J Palliat Care 2011;27:79–88
- National Institute for Health and Care Excellence (NICE). Lung cancer (non-small cell, second line) – erlotinib and gefitinib (revision of TA162 and TA175) (ID620) Erlotinib and gefitinib for treating non-small-cell lung cancer that has progressed following prior chemotherapy (Review of TA162 and TA175): appraisal consultation document 2015. London, United Kingdom 2015 https://www.nice.org.uk/guidance/GID-TAG347/documents/erlotinib-and-gefitinib-for-treating-nonsmallcell-lung-cancer-that-has-progressed-following-prior-chemotherapy-review-of-ta162-and-ta175-appraisal-consultation-document. Accessed October 1, 2015
- University Health Network (UHN). Pharmacy Department (personal communication) Toronto, Ontario, Canada: Pharmacy Department, 2015
- McGill Health Sciences Centre. Pharmacy Department (personal communication) Montreal, Ontario, Canada: Pharmacy Department, 2015
- Dranitsaris G, Evans WK, Milliken D, et al. The impact of practice guidelines and funding policies on the use of new drugs in advanced non-small cell lung cancer. J Eval Clin Pract 2005;11:350–6
- Dranitsaris G, Cottrell W, Evans WK. Cost-effectiveness of chemotherapy for nonsmall-cell lung cancer. Curr Opin Oncol 2002;14:375–83
- Dranitsaris G, Beegle N, Ravelo A, et al. Evaluating the impact of bevacizumab maintenance therapy on overall survival in advanced non-small-cell lung cancer. Clin Lung Cancer 2013;14:120–7
- Solem C, Penrod J, Lees M, et al. Resource Utilization Among Advanced Squamous and non-Squamous non-Small Cell Lung Cancer Patients Receiving Second-Line Treatment in France, Germany, Italy, and Spain: Results of A Retrospective Medical Chart Review 2015. http://www.europeancancercongress.org/Scientific-Programme/Abstract-search#">http://www.europeancancercongress.org/Scientific-Programme/Abstract-search#http://www.poster-submission.com/ecc2015/visitors/carousel. 2015 Volume 18, Issue 7, Page A450 Accessed October 1, 2015
- Gettinger S, Horn L, Gandhi L, et al. Overall survival and long-term safety of nivolumab (Anti-Programmed Death 1 Antibody, BMS-936558, ONO-4538) in patients with previously treated advanced non-small-cell lung cancer. J Clin Oncol 2015;33:2004–12
- Rizvi N, Mazieres J, Planchard D, et al. Activity and safety of nivolumab, an anti-PD-1 immune checkpoint inhibitor, for patients with advanced, refractory squamous non-small-cell lung cancer (CheckMate 063): a phase 2, single-arm trial. Lancet Oncol 2015;16:257–65
- Canadian Agency for Drugs and Technologies in Health (CADTH). pan-Canadian oncology drug review: final economic guidance report (Pemetrexed (Alimta) for non-squamous non-small cell lung cancer). 2013. Ottawa, Ontario, Canada https://www.cadth.ca/sites/default/files/pcodr/pcodr-alimta-ns-nsclc-fn-egr.pdf. Accessed October 1, 2015
- CADTH. pCODR final economic guidance report: crizotinib for advanced non-small cell lung cancer. 2013 Ottawa, Ontario, Canada
- CADTH. pCODR expert review committee final recommendation: ipilimumab for melanoma. 2012 Ottawa, Ontario, Canada
- Canadian Agency for Drugs and Technologies in Health (CADTH). pan-Canadian oncology drug review: final economic guidance report (Ipilimumab (Yervoy) for Advanced Melanoma). 2012. Ottawa, Ontario, Canada https://www.cadth.ca/sites/default/files/pcodr/pcodr-yervoy-adv-mel-fn-egr.pdf. Accessed October 1, 2015
- National Cancer Institute. Surveillance, Epidemiology, and End Results (SEER) Program: table 15.30 cancer of the lung and bronchus (invasive): percent distribution and counts by histology among histologically confirmed cases, 2008-2012, females by race. 2012. Bethesda, MD, USA http://seer.cancer.gov/archive/csr/1975_2011/browse_csr.php?sectionSEL=15&pageSEL=sect_15_table.30.html. Accessed October 1, 2015
- National Cancer Institute. Surveillance, Epidemiology, and End Results (SEER) Program: Table 15.29: cancer of the lung and bronchus (Invasive) - Percent distribution and counts by histology among histologically confirmed cases, 2008-2012; males by race. 2012. Bethesda, MD, USA http://seer.cancer.gov/archive/csr/1975_2011/browse_csr.php?sectionSEL=15&pageSEL=sect_15_table.29.html. Accessed October 1, 2015
- National Cancer Institute. Surveillance, Epidemiology, and End Results (SEER) Program: Table 15.28: Cancer of the lung and bronchus (Invasive) - Percent distribution and counts by histology among histologically confirmed cases, 2008-2012; both sexes by race. 2012. Bethesda, MD, USA http://seer.cancer.gov/archive/csr/1975_2011/browse_csr.php?sectionSEL=15&pageSEL=sect_15_table.28.html. Accessed October 1, 2015