
Abstract
Objective To explore trends in demographics, comorbidities, anti-diabetic drug usage, and healthcare utilization costs in patients with newly-diagnosed type 2 diabetes mellitus (T2DM) using a large US claims database.
Methods For the years 2007 and 2012, Truven Health Marketscan Research Databases were used to identify adults with newly-diagnosed T2DM and continuous 12-month enrollment with prescription benefits. Variables examined included patient demographics, comorbidities, inpatient utilization patterns, healthcare costs (inpatient and outpatient), drug costs, and diabetes drug claim patterns.
Results Despite an increase in the overall database population between 2007–2012, the incidence of newly-diagnosed T2DM decreased from 1.1% (2007) to 0.65% (2012). Hyperlipidemia and hypertension were the most common comorbidities and increased in prevalence from 2007 to 2012. In 2007, 48.3% of newly-diagnosed T2DM patients had no claims for diabetes medications, compared with 36.2% of patients in 2012. The use of a single oral anti-diabetic drug (OAD) was the most common diabetes medication-related claim (46.2% of patients in 2007; 56.7% of patients in 2012). Among OAD monotherapy users, metformin was the most commonly used and increased from 2007 (74.7% of OAD monotherapy users) to 2012 (90.8%). Decreases were observed for sulfonylureas (14.1% to 6.2%) and thiazolidinediones (7.3% to 0.6%). Insulin, predominantly basal insulin, was used by 3.9% of patients in 2007 and 5.3% of patients in 2012. Mean total annual healthcare costs increased from $13,744 in 2007 to $15,175 in 2012, driven largely by outpatient services, although costs in all individual categories of healthcare services (inpatient and outpatient) increased. Conversely, total drug costs per patient were lower in 2012 compared with 2007.
Conclusions Despite a drop in the rate of newly-diagnosed T2DM from 2007 to 2012 in the US, increased total medical costs and comorbidities per individual patient suggest that the clinical and economic trends for T2DM are not declining.
Introduction
Diabetes mellitus, particularly type 2 (T2DM), is a highly prevalent global disease with serious medical and economic consequencesCitation1–3. In 2012, it was estimated that direct medical costs of diabetes mellitus in the US were $176 billion and indirect costs were an additional $69 billionCitation2. Furthermore, ∼1 in 9 healthcare dollars worldwide is spent on diabetes and its complications, accounting for $612 billion in 2014 aloneCitation3. Disease management guidelines continue to evolve to reflect ongoing research and developments in clinical care, prevention, and diagnosis of diabetes in the hopes of improving outcomes and lessening the overall burden to individuals and society.
To better understand current treatment and utilization patterns and associated costs of T2DM, it is important to perform large-scale, real-world studies with reliable data. Claims data, reflecting actual adjudicated claims, provide a means of accessing a large amount of demographic and treatment-related data on patients with diabetes and provide an opportunity to evaluate demographic characteristics of patients, as well as adoption of treatment recommendations and costs associated with healthcare over timeCitation4. Prior studies have examined some of these issues, including claims-based analysesCitation5–10; but to our knowledge none have evaluated treatment patterns, comorbidities, and healthcare costs together in large US populations of persons with newly-diagnosed T2DM.
Diabetes is a chronic and typically progressive disease, thus a conglomerate population of all affected patients would likely contain a highly diverse cohort, with patients at all points along the spectrum of severity and complications and at various stages of the treatment continuum. Limiting the study population to patients with newly-diagnosed T2DM would be expected to produce a more homogenous cohort with regard to disease characteristics and may be particularly well-suited for evaluating changes in treatment patterns over time. This analysis was designed to explore, from a societal perspective, trends in demographics, comorbidities, anti-diabetic drug usage, and healthcare utilization cost trends in patients with newly-diagnosed T2DM in the US using a large claims database.
Methods
Data source
Data for these analyses were obtained using the Truven Health Analytics MarketScan Research Databases which contained administrative claims data on more than 170 million unique patients since 1995, including a sub-set of 9.1 million people with diabetes. These databases contain de-identified claims data from persons residing in all states of the US and are fully compliant with the Health Insurance Portability and Accountability Act of 1996. Two non-sequential years of data, 2007 and 2012, were selected in order to examine trends over a 5-year span of time.
Sample selection criteria
The diagnoses of T2DM were evaluated over all available patient years, and were not limited to 2007 and 2012 in order to ensure the most accurate classification of patients. General patient eligibility requirements mandated age ≥18 years and continuous enrollment in a plan with prescription benefits for ≥1 year. In order to meet the criteria for ‘newly-diagnosed’ T2DM, the following criteria were required: patients were required to have evidence of their first T2DM diagnosis (index claim) in 2007 or 2012, and enrollment in an insurance plan at least 6 months prior to being diagnosed. T2DM was defined as a minimum of two claims for T2DM (ICD-9 code of 250.X0, 250.X2) or at least one claim for T2DM with one or more oral anti-diabetic drug (OAD) claim during the year of study. Additionally, patients were required to have an absence of claims for T2DM or related drug claims for at least 6 months preceding the index T2DM claim. To eliminate a misdiagnosis of type 1 diabetes mellitus (T1DM), patients could not have had more than one T1DM diagnosis (ICD-9 code of 250.X1, 250.X3) in the 6 months prior to T2DM diagnosis, and no claims for an insulin prescription. All patients meeting eligibility criteria were included in the analysis. Both inpatient and outpatient data were captured in the study.
Variables and analysis
The following variables were examined: patient demographic characteristics, comorbidities, inpatient utilization patterns (number of days, length of stay), healthcare costs relating to inpatient and outpatient services, drug costs (diabetes and total drugs), and diabetes drug claim patterns. Healthcare costs were based on payers’ adjudicated payments plus patients’ deductibles and co-payments and reflected all available inpatient, outpatient, and emergency room visits and all services and expenses related to such. Costs were tallied for the entire calendar years 2007 and 2012 for each respective study group, regardless of the date of T2DM diagnosis during the year. Comorbidities were identified using ICD-9 codes in claims during the analysis years (2007 and 2012). The comorbidities chosen for examination were those known to be commonly associated with diabetes, specifically hypertension, hyperlipidemia, cardiovascular diseases, cerebrovascular diseases, peripheral vascular diseases, neuropathy, nephropathy, and retinopathy. Trends in diabetes medication usage focused on OADs, insulin, and glucagon-like peptide-1 (GLP-1) receptor agonists.
The analyses involved simple descriptive comparisons of the demographic characteristics and comorbidity patterns of the newly-diagnosed patients for each study year, as well as associated T2DM-related medication claims and costs in 2007 and in 2012. Cost data from 2007 were inflation-adjusted to 2012 dollars. The data were compared between the two groups to identify any differences between the groups and show trends over time. No statistical testing of differences was performed as this was intended to be an exploratory analysis and because the large sample size would make even minor differences appear to be significant, regardless of clinical relevance.
Results
Incidence and demographics
The absolute number of newly-diagnosed cases of T2DM was only slightly smaller in 2012 than in 2007 (147,011 vs 152,272), despite a large increase in the entire database population between those 2 index years (). Thus, the percentage of all enrolled patients (i.e. excluding those already diagnosed with T2DM in previous years) who were newly-diagnosed with T2DM decreased from 1.1% in 2007 to 0.65% in 2012. This is consistent with other recent reportsCitation11,Citation12 using different databases, and is consistent with our own observations of other US databases (data not shown).
Table 1. Demographic characteristics of newly-diagnosed type 2 diabetes mellitus populations, 2007 vs 2012.
In both index years, the sex distribution of newly-diagnosed T2DM cases was fairly even, with men accounting for 50.6% of newly-diagnosed cases in 2007 and 51.7% of cases in 2012. Newly-diagnosed T2DM patients in 2012 were an average 2.9 years younger compared with 2007 (54.8 vs 57.7 years of age). The percentage of newly-diagnosed cases in all age groups was smaller in 2012 vs 2007, a phenomenon observed for both men and women. By regional distribution, the highest percentage of patients in both index years were from the South, followed by the Central, West, and Northeast regions, respectively.
Comorbidities
Comorbidity findings from this dataset have been reported in more detail elsewhereCitation13. In both 2007 and 2012, the two most common comorbidities among newly-diagnosed T2DM patients were hyperlipidemia (46.4% and 57.3% of patients, respectively) and hypertension (55.1% and 61.8% of patients, respectively), both noted in higher percentages of patients in 2012 compared with 2007. Peripheral vascular disease, retinopathy, nephropathy, and neuropathy were less prevalent comorbidities, but were also noted in higher percentages of the T2DM population in 2012 compared with 2007. The percentages of newly-diagnosed T2DM patients with cardiovascular and cerebrovascular disorders decreased from 2007 to 2012.
Treatment patterns
In 2007, 48.3% of newly-diagnosed T2DM patients had no prescription claims for any diabetes medications, and this proportion declined to 36.2% in the 2012 cohort. By category of diabetes-related prescription claims, use of OADs only (1 or more) was the most common and increased from 46.2% of patients in 2007 to 56.7% of patients in 2012 (, ); more specifically, use of a single OAD was the most common category of diabetes-related prescription claims (31.5% of patients in 2007; 43.8% of patients in 2012).
Figure 1. Overall distribution of drug prescriptions among newly-diagnosed patients, 2007 and 2012. GLP1, glucagon-like peptide-1 agonist; OAD, oral anti-diabetic drug.
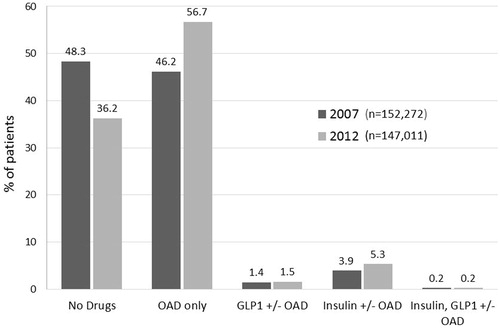
Table 2. Distribution of drug classes prescribed for patients with newly-diagnosed type 2 diabetes mellitus, 2007 vs 2012.
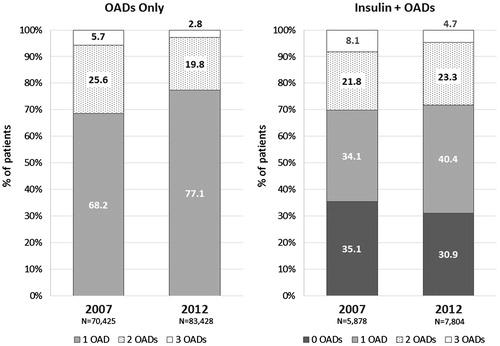
Within the sub-set of patients using OADs only, use of a single OAD was more common than use of multiple OADs in both study years and increasingly so in 2012 vs 2007 (68.1% of OAD-only users in 2007; 77.1% of OAD-only users in 2012) (). Likewise, the proportions of OAD-only users who were using multiple (2 or 3) OADs declined from 2007 to 2012.
Figure 2. Distribution of OAD use by number of different OADs represented in claims among newly-diagnosed patients, 2007 and 2012. OAD, oral anti-diabetic drug. Percentages reflect the proportion of patients within the category. Percentages for patients using four or more OADs are not reflected graphically: OADs only, 2007 (0.6%), 2012 (0.2%); Insulin + OADs, 2007 (1.0%), 2012 (0.7%).
Metformin was the OAD used most frequently as diabetes monotherapy. Among the entire newly-diagnosed T2DM populations, metformin monotherapy use increased from 23.5% of patients in 2007 to 39.8% of patients in 2012 (). Conversely, sulfonylurea (SU) monotherapy, already used by a small percentage of T2DM patients in 2007, decreased further in 2012, and the proportion of patients with thiazolidinedione (TZD) monotherapy claims declined from 2.3% in 2007 to only 0.2% in 2012. Similar patterns were observed when looking at OAD users only ().
Figure 3. Distribution of OAD use by specific drugs/classes among newly-diagnosed type 2 diabetes mellitus patients using (a) OADs only or (b) insulin plus OADs, 2007 vs 2012. DPP-IV, dipeptidyl peptidase-4 inhibitor; MET, metformin; OAD, oral anti-diabetic drug; SU, sulfonylurea; TZD, thiazolidinedione. Percentages reflect the proportion of patients within the category. Percentages for patients using ‘Other’ OADs are not reflected graphically: 1 ‘Other’ OAD only, 2007 (3.9%), 2012 (2.4%); 2 ‘Other’ OADs only (for ‘Other’ OAD combinations), 2007 (4.0%), 2012 (3.3%); Insulin + 1 ‘Other’ OAD only, 2007 (6.0%), 2012 (5.9%); Insulin + 2 ‘Other’ OADs, 2007 (7.4%), 2012 (5.8%).
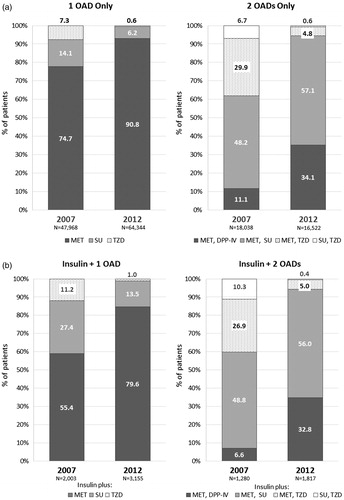
Table 3. Prescription claim detail for all newly-diagnosed type 2 diabetes mellitus patients, 2007 and 2012.
Notable shifts were observed in patterns of dual OAD combinations (). In 2007, the majority of patients using only dual OAD therapy had claims for metformin + SU (48.2% of dual OAD users), a trend which continued and expanded in 2012 (57.1% of dual OAD users). The combination use of metformin + a dipeptidyl peptidase-IV (DPP-IV) inhibitor increased from 11.1% of dual OAD users in 2007 to 34.1% in 2012. Combinations of SU + TZD were used by a small percentage of dual OAD users in 2007 (6.7%) and dropped even further to 0.6% in 2012.
Use of an insulin-only regimen was low in both index years and remained relatively stable in the newly-diagnosed T2DM patients, at 1.4% in 2007 and 1.6% in 2012 (). Insulin, with or without a concomitant OAD(s), was used in 3.9% of newly-diagnosed T2DM patients in 2007 and 5.3% in 2012 ( and ). Combinations of insulin + OADs were used by 2.5% of patients in 2007 and 3.7% in 2012.
Basal insulin was the predominant insulin type used; among newly-diagnosed T2DM patients who were using insulin (alone or combined with OADs), claims for basal insulin increased from 38.3% of insulin users (2249/5878) in 2007 to 47.5% of insulin users (3707/7804) in 2012. Insulin combinations (basal + bolus) were used by 37.9% (2276/5878) and 39.2% (3058/7804) of insulin-using, newly-diagnosed T2DM patients (1.5% and 2.1% of all newly-diagnosed patients) in 2007 and 2012, respectively.
GLP-1 agonists were used infrequently in newly-diagnosed patients in both index years ().
Utilization costs
The mean total annual healthcare costs per newly-diagnosed T2DM patient increased from $13,744 in 2007 to $15,175 in 2012 (adjusted to 2012 dollars), representing a 10.4% increase (). All individual components of healthcare costs increased from 2007 to 2012, including inpatient services ($4613 to $5013), inpatient ER ($244 to $548), outpatient costs ($5668 to $6460), and outpatient ER costs (from $549 to $880). Drug costs per patient remained fairly stable for diabetes drugs ($226 in 2007 vs $231 in 2012), while total drug costs were lower in 2012 ($2276) compared with 2007 ($2669) ().
Table 4. Annual healthcare costs per patient with newly-diagnosed type 2 diabetes mellitus, 2007 vs 2012.
With regard to trends in inpatient services, the number of utilizers and the total number of inpatient days was lower in 2012 compared to 2007 (). While the mean length of stay remained fairly consistent at ∼9 days in both index years, the cost per day, the cost per utilizer, and total cost were all higher in 2012. The number of inpatient ER service-related claims was notably greater in 2012 compared with 2007, with the number of utilizers, total number of ER days, and total inpatient ER costs approximately doubling by 2012. Mean length of stay per utilizer and cost per day were not markedly different from 2007 to 2012. Trends in outpatient costs on a per utilizer basis are shown in , and followed the same trend as inpatient costs per utilizer.
Table 5. Inpatient and outpatient utilization patterns and cost details, 2007 vs 2012.
Discussion
This large claims database analysis demonstrated some important and interesting trends among patients with newly-diagnosed T2DM in the US. Despite a larger database population in 2012 compared with 2007, the percentage of newly-diagnosed T2DM cases fell from 1.1% to 0.65%, a trend that corroborates other recent reportsCitation11,Citation12. Among the most notable of the findings in the current study were the shifts in apparent drug prescribing patterns that occurred from 2007 to 2012. The percentage of newly-diagnosed T2DM patients with claims for anti-diabetic medications was higher in 2012 than in 2007. In particular, there was increased use of a single OAD in newly-diagnosed patients, with metformin being increasingly prescribed, while use of SU monotherapy correspondingly decreased. The most widely used dual OAD combination was metformin + SU, and its use increased from 48% in 2007 to 57% of dual OAD users in 2012. A sharp drop in combination therapy with metformin + TZD from 2007 to 2012 was countered by a marked increase in metformin + DDP-IV claims. Finally, among patients using insulin in combination with other therapy, the vast majority of concomitant claims were for metformin. Conversely, TZD use declined sharply in combination with insulin from 2007 to 2012, coinciding with notable decreases in claims for TZD as monotherapy or as a component of a dual OAD regimen.
As would be expected in this population of newly-diagnosed T2DM patients, insulin accounted for only a small percentage of prescriptions for newly-diagnosed patients, with only a 2% increase observed between 2007 and 2012. Among insulin users, the vast majority of insulin use was basal insulin or an insulin combination regimen. Claims for basal insulin increased from 38% to 48% of insulin users (data not shown) in the newly-diagnosed T2DM population in 2007 and 2012, respectively.
The shifts in drug use to a certain extent appear to reflect changes in published guidelines available in the US during the study years. The American Diabetes Association (ADA)/European Association for the Study of Diabetes (EASD) consensus guideline, published in 2006, introduced a 2-step approach to therapy, which included lifestyle modification and metformin followed by add-on therapy with a second regimen (choice of insulin, SUs, TZDs, and other drugs, e.g., α-glucosidase inhibitors, glinides, exenatide, and pramlinitide)Citation14. A subsequent guideline from the ADA/EASD, published in 2009, further refined these recommendations into a ‘Tier 1’ algorithm comprised of ‘well-validated core therapies’ (lifestyle modifications, metformin, SU, and insulin), and a ‘Tier 2’ algorithm which reflected less well-validated therapies at that time (TZDs, GLP-1 agonists)Citation15.
Although not without their controversial aspectsCitation16, the 2006 and 2009 ADA consensus statementsCitation14,Citation15 could be expected to have had some impact on clinical practice in the study years. In fact, the drug claims data from newly-diagnosed T2DM patients in the present study generally paralleled the trends of the guidelines. The 2009 guidelines made stronger and more explicit recommendations about the use of specific drugs, and these appear to be reflected in the prescription patterns seen in the 2012 data. This was particularly evident in the increased use of metformin monotherapy and metformin combination therapy with SUs and DPP-IV inhibitors.
Diabetes management guidelines have continued to evolve since the times during which these medical and prescription claims were processed. The 2015 diabetes management guidelines from the ADACitation17 continue to recommend metformin monotherapy as first-line pharmacotherapy, with a variety of metformin combinations as second-line strategies including SUs, TZDs, DPP-IV inhibitors, sodium-glucose cotransporter 2 (SGLT2) inhibitors, GLP-1 receptor agonists, or basal insulin. These guidelines acknowledge that the specific choice is dependent on patient- and disease-specific factors. The 2012 update of the International Diabetes Federation (IDF)Citation18 guidelines suggests SU, DPP-IV inhibitors, α-glucosidase inhibitors, or TZDs as second- or third-line therapies, and insulin and GLP-1 agonists as third-line options. The IDF guidelinesCitation18 cited declining use of TZD agents because of safety concerns; our findings and other published dataCitation9 clearly confirm this trend. The IDF maintains TZD as an option in their treatment algorithm, but suggests that other choices are preferable when available.
When examining the cost of care for newly-diagnosed T2DM patients, this analysis found an increase in overall healthcare costs (all-cause, not diabetes only) from 2007 to 2012, despite a smaller number of patients and slightly lower mean age in 2012. Cost increases in the current study were driven mostly by outpatient claims, a pattern that is consistent with ADA data from 2007Citation19 and 2012Citation10 (not limited to newly-diagnosed T2DM cases). Per capita healthcare expenditures reported for all patients with diabetes in the 2007 and 2012 ADA analyses increased by 17%, but these were separate studies and not equivalent dollars (2007 vs 2012 dollars). In the current study, which focused on newly-diagnosed T2DM patients specifically, total healthcare costs per patient increased by 10.4%. Dall et al.Citation20 also found that the economic burden of diabetes increased from 2007 to 2012 in the US, while Huber et al.Citation6 found an increase in costs per patient from 2006 to 2011 in Switzerland.
All non-drug components of healthcare services analyzed were associated with higher costs in the 2012 newly-diagnosed population, with outpatient services showing the biggest per patient increase. For inpatient services, there were ∼15% fewer utilizers in 2012 compared with 2007, yet overall inpatient costs were 14.5% higher in 2012 compared with inflation-adjusted 2007 costs. Mean length of stay per patient remained fairly steady between the 2 years at ∼9 days; however, the cost per day was more than $600 higher, translating into almost $7000 in extra costs per individual utilizer in 2012 compared with 2007. Thus, cost per day seemed to be the driver of the higher inpatient costs in 2012. With regard to drug costs, this analysis found that costs for diabetes drugs remained quite stable from 2007 to 2012, while overall drug costs per patient were lower in 2012 than in 2007.
Explanations for the observed changes in healthcare costs in these two cohorts of patients with newly-diagnosed T2DM and separated chronologically by 5 years can only be a matter of speculation. However, the current observations are similar to those reported by Pelletier et al.Citation21 and by Bron et al.Citation22. The higher costs noted in 2012 may partly relate to an increased comorbidity burden. In particular, claims related to hyperlipidemia and hypertension among patients with newly-diagnosed T2DM increased in prevalence by 20% and 7%, respectively, from 2007 to 2012.
Pelletier et al.Citation21 found that patients with vascular complications had significantly higher costs than those without. Bron et al.Citation22 found that the major driver for costs in diabetes patients was inpatient admission, with vascular complications accounting for most admissions.
As this was a retrospective claims-based study, various limitations common to such studies apply, including possible errors in the coding of diagnoses and lack of clinical and laboratory findings to confirm T2DM diagnoses. The inclusion criteria were designed to limit the chance of including patients without a true diagnosis of T2DM (i.e. more than one diagnosis code for T2DM, or a T2DM diagnosis code plus at least one claim for an OAD). This analysis, by design, did not attempt to identify variables that were driving healthcare costs, including disease severity. Cost data were comprehensive for each subject and were not limited to diabetes-related costs. While the large size of the database and broad US geographic representation add to the generalizability of the findings, it should be noted that the population was limited to patients with commercial or Medicare insurance and may not be truly representative of all persons with newly-diagnosed T2DM. Unavoidably, the characteristics of the source data-set were different in the two study years. In particular, the mean age was younger in the 2012 cohort compared with 2007 and the percentage of Medicare enrollees was lower in 2012. Interestingly, while the lower mean age and smaller Medicare representation in 2012 could be argued as possible contributors to the lower incidence of T2DM in that year, an intuitive parallel expectation would be that costs per T2DM patient would have gone down, as well, yet costs increased in 2012. It should also be acknowledged that some of the noted comorbidities may have appeared prior to the diagnosis of T2DM, and not all of the healthcare costs were directly related to diabetes. However, it is also likely that these newly-diagnosed patients may have had T2DM for a number of years before their T2DM diagnosis, allowing ample time for complications of uncontrolled diabetes to have manifested first, seemingly as independent diagnoses. Nevertheless, the results of the present analysis shed light on some important trends that need to be considered and studied further.
Conclusions
Despite an encouraging drop in the rate of newly-diagnosed cases of T2DM mellitus from 2007 to 2012 in the US, this analysis documented an increase in both total medical costs and comorbidities for the newly-diagnosed T2DM populations and per individual patient. The ramifications of the analysis are that the clinical and economic trends in T2DM management are not declining. While T2DM was not necessarily the sole driver for all of the observed increases, patients with the diagnosis continue to present with a high, and apparently increasing, financial burden to the healthcare system. This is a complex phenomenon that will require further study to identify potentially modifiable contributing factors.
Transparency
Declaration of financial/other relationships
WW, EK, TH, SK, BS, and JB are employees of, and own stock in, Novo Nordisk. YL was an employee of Novo Nordisk Inc. at the time the work was performed. JME peer reviewers on this manuscript have no relevant financial or other relationships to disclose.
Declaration of funding
This study was funded by Novo Nordisk Inc. (Plainsboro, NJ).
Acknowledgments
Writing and editorial assistance for this paper was provided by Anthony Shardt, MD, and Sandra Westra, PharmD, of Churchill Communications (Maplewood, NJ) with funding from Novo Nordisk Inc.
Related Research Data
References
- World Health Organization. Diabetes fact sheet. World Health Organization. Geneva, Switzerland http://www.who.int/mediacentre/factsheets/fs312/en/. Accessed July 30, 2015
- Centers for Disease Control and Prevention. National Diabetes Statistics Report: estimates of diabetes and its burden in the United States, 2014. Atlanta, GA: U.S. Department of Health and Human Services, 2014
- Schernthaner G, Barnett AH, Betteridge DJ, et al. IDF Diabetes Atlas Sixth Edition, 2014 Update. International Diabetes Federation, Brussels, Belgium http://www.idf.org/sites/default/files/Atlas-poster-2014_EN.pdf. Accessed March 21, 2015
- Alexander GC, Sehgal NL, Moloney RM, et al. National Trends in Treatment of Type 2 Diabetes Mellitus, 1994–2007. Arch Intern Med 2008;168:2088-94
- Bertoldi AD, Kanavos P, Franca GVA, et al. Epidemiology, management, complications and costs associated with type 2 diabetes in Brazil: a comprehensive literature review. Global Health 2013;9:62
- Huber CA, Schwenkglenks M, Rapold R, et al. Epidemiology and costs of diabetes mellitus in Switzerland: an analysis of health care claims data, 2006 and 2011. BMC Endocr Disord 2014;14:44
- Escghwege E, Basdevant A, Crine A, et al. Type 2 diabetes mellitus in France in 2012: Results from the ObEpi survey. Diabetes Metab 2015;14:55-61
- Karpati T, Cohen-Stavi CJ, Leibowitz M, et al. Towards a subsiding diabetes epidemic: trends from a large population-based study in Israel. Popul Health Metr 2014;12:32
- Desai NR, Shrank WH, Fischer MA, et al. Patterns of medication initiation in newly diagnosed diabetes mellitus: quality and cost implications. Am J Med 2012;125:302.e1-302.37
- American Diabetes Association. Economic costs of diabetes in the U.S. in 2012. Diabetes Care 2013;36:1033-46
- American Diabetes Association. Statistics about diabetes: data from the National Diabetes Statistics Report. 2014. Alexandria, VA http://www.diabetes.org/diabetes-basics/statistics/?loc=superfooter. Accessed March 21, 2015
- Geiss LS, Wang J, Cheng YJ, et al. Prevalence and incidence trends for diagnosed diabetes among adults aged 20 to 79 Years, United States, 1980-2012. JAMA 2014;312:1218-26
- Weng W, Liang M, Kimball E, et al. Decreasing incidence of Type 2 diabetes mellitus in the United States, 2007 to 2012: epidemiologic findings from a large US claims database. Submitted to Diab Res Clin Pract in press
- Nathan DM, Buse JB, Davidson MB, et al. Management of hyperglycemia in type 2 diabetes: a consensus algorithm for the initiation and adjustment of therapy: a consensus statement from the American Diabetes Association and the European Association for the Study of Diabetes. Diabetes Care 2006;29:1963-72
- Nathan DM, Buse JB, Davidson MB, et al. Medical management of hyperglycemia in type 2 diabetes: a consensus algorithm for the initiation and adjustment of therapy: a consensus statement of the American Diabetes Association and the European Association for the Study of Diabetes. Diabetes Care 2009;32:193-203
- Schernthaner G, et al. Is the ADA/EASD algorithm for the management of type 2 diabetes (January 2009) based on evidence or opinion? A critical analysis. Diabetologia 2010;53:1258-6
- American Diabetes Association. Standards of medical care in diabetes – 2015, Approaches to glycemic management. Diabetes Care 2015;38(1 Suppl):S41-8
- International Diabetes Federation. IDF Treatment Algorithm for People with Type 2 Diabetes, 2012 update. http://www.idf.org/treatment-algorithm-people-type-2-diabetes. Accessed June 11, 2015
- American Diabetes Association. Economic costs of diabetes in the U.S. in 2007. Diabetes Care 2008;31:596-615
- Dall TM, Yang W, Halder P, et al. The economic burden of elevated blood glucose levels in 2012: diagnosed and undiagnosed diabetes, gestational diabetes mellitus, and prediabetes. Diabetes Care 2014;37:3172-9
- Pelletier EM, Shim B, Ben-Joseph R, et al. Economic outcomes associated with microvascular complications of type 2 diabetes mellitus: results from a US claims data analysis. Pharmacoeconomics 2009;27:479-90
- Bron M, Guerin A, Latremouille-Viau D, et al. Distribution and drivers of costs in type 2 diabetes mellitus treated with oral hypoglycemic agents: a retrospective claims data analysis. J Med Econ 2014;17:646-57