
Abstract
Objective Peginterferon beta-1a 125 mcg, administered subcutaneously (SC) every 2 weeks, a new disease-modifying therapy (DMT) for relapsing-remitting multiple sclerosis (RRMS), was approved by the US Food and Drug Administration in 2014. This study assesses the cost-effectiveness of peginterferon beta-1a vs interferon beta-1a (44 mcg SC 3 times per week) and glatiramer acetate (20 mg SC once-daily) in the treatment of RRMS from the perspective of a US payer over 10 years.
Methods A Markov cohort economic model was developed for this analysis. The model predicts disability progression, occurrence of relapses and other adverse events and translates them into quality-adjusted life years (QALYs) and costs. Natural history data were obtained from the placebo arm of the ADVANCE trial of peginterferon beta-1a, the London Ontario (Canada) database and a large population-based MS survey. Comparative efficacy of each DMT vs placebo was obtained from a network meta-analysis. Costs (in 2014 US dollars) were sourced from public databases and literature. Clinical and economic outcomes were discounted at 3% per year.
Results Over 10 years, peginterferon beta-1a was dominant (i.e., more effective and less costly), with cost-savings of $22,070 and additional 0.06 QALYs when compared with interferon beta-1a 44 mcg and with cost-savings of $19,163 and 0.07 QALYs gained when compared with glatiramer acetate 20 mg. Results were most sensitive to variations in the treatment effect of each DMT, treatment acquisition costs of each DMT and the time horizon. Probabilistic sensitivity analyses indicated that peginterferon beta-1a remains dominant in >90% of 5,000 replications compared with either DMTs.
Conclusion This analysis suggests that long-term treatment with peginterferon beta-1a improves clinical outcomes at reduced costs compared with interferon beta-1a 44 mcg and glatiramer acetate 20 mg and should be a valuable addition to managed care formularies for treating patients with RRMS.
Introduction
Multiple sclerosis (MS) is a chronic and progressive autoimmune disease of the central nervous system, characterized by localized areas of inflammation, demyelination and axonal degenerationCitation1,Citation2. MS is associated with an impaired health-related quality-of-lifeCitation3,Citation4, is the leading cause of non-traumatic central nervous system morbidity and mortality in young and middle-aged adultsCitation5–7, and the rate of suicide in patients with MS is higher than that of the general populationCitation8. The estimated prevalence of MS in the US is ∼572,000, with an estimated 10,400 new MS diagnoses per year, and annual direct medical costs of ∼$32,000 per person (in 2011 US dollars)Citation3.
Currently, there is no cure for MS. Disease-modifying therapies (DMTs) are the best available option for patients with relapsing forms of MSCitation9, with 12 DMTs approved by the US Food and Drug Administration (FDA) for this indication as of March 2015Citation10. Glatiramer acetate and interferon beta-1a 44 mcg are currently the most frequently prescribed drugs among all the DMTs in the US marketCitation11. In 2013, the cost of medications for MS was estimated at ∼$46.00 per member per year (PMPY), the second highest in specialty medication next to inflammatory conditions ($63.30 PMPY), such as rheumatic conditions and psoriasisCitation11. Thus, any new treatment to be included in a MS formulary should be carefully evaluated regarding its clinical and economic impacts.
Injectable DMTs (e.g., glatiramer acetate and interferon beta-1a 44 mcg) have been used to treat MS for more than a decade. However, adherence with these treatments, in terms of both compliance and persistence, has been poorCitation12. Dosing frequency, varying from once a day to once weekly, is one of the main barriers to adherence with injectable DMTs. Treatments with a lower frequency of injections are associated with higher adherence ratesCitation13–15. Poor adherence can limit the efficacy of these agents, leading to sub-optimal treatment outcomesCitation13 and a higher rate of health resource utilizationCitation16,Citation17.
Peginterferon beta-1a 125 mcg administered subcutaneously (SC) every 2 weeks was developed to prolong the half-life of interferons and decrease the required dose frequency and was approved by the US FDA in August 2014 for the treatment of relapsing forms of MS, based on favourable clinical and safety results from the pivotal ADVANCE trialCitation10,Citation18. Peginterferon beta-1a is the only pegylated interferon beta-1a and has the lowest dosing frequency, once in every 2 weeks, among all the injectable DMTs. As data on its cost-effectiveness relative to other injectable DMTs in the treatment of patients with relapsing-remitting MS (RRMS) are still very limited, the purpose of this analysis was to provide such data for decision-making when considering peginterferon beta-1a for inclusion in a managed care formulary. The analysis focused on SC DMTs and includes glatiramer acetate 20 mg once a day and interferon beta-1a 44 mcg (3-times a week) as the main comparators as they are the two most commonly used injectable DMTs in the US marketCitation11.
Methods
Model overview
An economic model using a Markov cohort approach was developed for this analysis (). This model was developed based on a previously published modelCitation19,Citation20, reviewed and accepted by several Health Technology Assessment agencies, including the National Institute for Health and Care Excellence (NICE) in the UKCitation21–23.
Figure 1. Model structure. AE, adverse event; EDSS, Expanded Disability Status Scale; RRMS, relapsing-remitting multiple sclerosis; SPMS, secondary-progressive multiple sclerosis; State N = current EDSS state. Adapted from Gani et al.Citation19. Ovals represent health states. Rectangles represent events that patients can experience at any time. Treatment-related AEs and treatment discontinuation can only occur for patients receiving treatment.
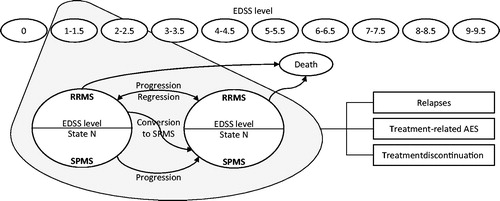
The model includes 10 health states defined by the Expanded Disability Status Scale (EDSS) levels 0–9.5 during the relapsing-remitting phase, 10 health states based on the same EDSS criteria for the secondary progressive (SP) phase and death (). The cohort of patients, all with RRMS, starts with an initial EDSS distribution. The model assumes a 1-year cycle. Every year, patients with RRMS may: (1) remain at the same EDSS level with RRMS, (2) progress to a higher EDSS level (increasing disability), (3) improve to a lesser EDSS level, (4) progress to the next EDSS level and to SPMS or (5) die. Once patients progress to SPMS, they cannot return to a lesser EDSS level or to RRMS; they can only move to a higher EDSS level, stay at the same EDSS level or die. Patients can experience relapses at any time, with risk of relapse based on disease phase (i.e., RRMS vs SPMS) and EDSS level.
Treatment acts to delay disability progression (i.e. transition to a higher EDSS level) and reduce the frequency of relapses. Patients receiving treatment can experience treatment-related adverse events (AEs) at any time and can discontinue treatment as a result of several pre-defined reasons (see Treatment). After treatment discontinuation, patients are assumed to follow the natural disease progression course.
As patients move between states, experiencing relapses and AEs, they accrue state- and event-specific costs and are assigned utilities to estimate quality-adjusted life years (QALYs). The model calculates outcomes for the different comparators and reports them in terms of incremental health outcomes, incremental costs and incremental cost-effectiveness ratios (ICERs).
Model parameters and data sources
Perspective and timeframe
Based on the recommendations of the US Panel on Cost-Effectiveness in Health and Medicine, this analysis takes the US payer perspective, including only direct medical costs. The time horizon for this analysis is 10 years, as predictions beyond this time are less likely to be supported by the clinical trial data with 1–2 years of follow-up. This time horizon has been also used in previous published cost-effectiveness analyses of DMTs in the treatment of RRMSCitation24–26. An annual discount rate of 3% is applied to both costs and health benefits occurring beyond the first yearCitation27.
Patient characteristics
The model population includes adult patients (age ≥18) with RRMS. The population is 29.2% male with a mean age of 36.5 years, as observed in the ADVANCE trial. The initial EDSS distribution of the cohort was obtained from the baseline EDSS distribution of the intent-to-treat (ITT) population of the ADVANCE trial ()Citation18,Citation28.
Table 1. Initial EDSS distribution of the cohort, ARR natural history, utility, costs of disease management, and mortality by EDSS level.
Natural history
The probabilities of disability progression during RRMS were obtained by combining the data from the ITT population in the placebo arm of the ADVANCE trial (for EDSS levels 0–5.5) with data from the longitudinal data set of patients with MS from the London, Ontario (Canada) database (for EDSS levels 6–9.5)Citation28–30. Probabilities of progression from RRMS to SPMS and transition probabilities of disability progression during SPMS were derived from the London, Ontario data setCitation29,Citation30.
Annualized relapse rates (ARRs) by EDSS level are shown in . The ARRs for RRMS EDSS levels 0–5.5 were derived from the ITT population in the placebo arm of the ADVANCE trialCitation28. ARRs for RRMS EDSS levels 6–9.5 were derived by extrapolating those for EDSS levels 0–5.5 with ARRs from the UK MS SurveyCitation31 and Patzold and PocklingtonCitation32. ARRs during SPMS were derived by extrapolating those derived for RRMS with ARRs from the UK MS SurveyCitation31 and Patzold and PocklingtonCitation32.
Treatment
Efficacy and discontinuation
Comparative efficacy for each DMT vs placebo (i.e. no DMT), as measured by ARRs and 3-month sustained EDSS progression, were obtained from a network meta-analysis of peginterferon beta-1a and injectable DMTs for RRMS ()Citation33. It was assumed that there was no change in treatment effect over time (i.e., the effect was assumed to be 100% over the time horizon).
Table 2. Comparative efficacy and treatment related costs.
Patients stopped treatment after progression to an EDSS level ≥7 or after conversion to SPMS. In addition, a constant annual rate of treatment discontinuation of 15% due to AEs and other reasons was applied for the first 2 years of treatment only. This risk was zero thereafter, assuming that all patients who discontinue treatment would have done so by the end of the second yearCitation34,Citation35. Patients lost treatment benefits immediately after treatment discontinuation, and patients are assumed to follow the natural disease progression course.
Adverse events
The AEs included in the model were those most commonly reported AEs for peginterferon beta-1a 125 mcg (≥5% incidence in any treatment group of peginterferon beta-1a) in the ADVANCE trial, as well as AEs that occurred at an incidence of ≥3% in the overall peginterferon beta-1a group compared to the placebo group (even if the overall incidence in the peginterferon beta-1a arms was <5%). The AEs included in the model are: abdominal pain, arthralgia, back pain, chest pain, cough, depression, diarrhea, fatigue, flu-like symptoms, flushing, gastroenteritis, headache, increased alanine aminotransferase (ALT), influenza, injection site reactions, leukopenia, nausea, pain in extremity, pruritus, rash, upper abdominal pain, and urinary tract infection.
As a conservative assumption, only AEs reported for peginterferon beta-1a were included for interferon beta-1a 44 mcg and glatiramer acetate 20 mg. The annual incidence rates of AEs were obtained from the ADVANCE trial for peginterferon beta-1a and from published pivotal clinical trials for interferon beta-1a 44 mcgCitation36–41 and glatiramer acetate mgCitation15,Citation38,Citation40,Citation42–47.
The annual incidence rate of each AE for each treatment and study was calculated as the proportion of patients experiencing each AE over the study duration, scaling the study duration to 1 year. When more than one study was used for a specific treatment, the annual incidence of each AE was calculated as a weighted average of the annual incidence rate and the number of patients observed in each study.
Serious AEs were considered only for peginterferon beta-1a: 0.03% of the patients had serious increased ALT, 5.88% serious depression, 0.28% serious injection site reactions and 1.92% serious urinary tract infections. As a conservative assumption, no serious AEs were considered for interferon beta-1a 44 mcg and glatiramer acetate 20 mg.
Mortality
Age- and gender-specific all-cause mortality risks for the general population were obtained from gender-specific 2010 US life tablesCitation48. Mortality risks for patients with MS were calculated using the relative risk of death by EDSS level presented by PokorskiCitation49 ().
Utilities
Both patient and caregiver utilities were considered in this analysis. Utility scores for patients by EDSS level were obtained by combining the EuroQoL five dimensions questionnaires (EQ-5D) data from the ITT population of the ADVANCE trialCitation28 (for EDSS levels 0–5.5) with data from Kobelt et al.Citation50 (). For all EDSS levels, a disutility of 0.094 was subtracted to stratify by relapse vs no relapseCitation50. The same utility scores were assumed for RRMS and SPMS, as no stratification was presented by Kobelt et al.Citation50. Caregivers’ disutility values by EDSS were obtained from Gani et al.Citation19 ().
The disutility and duration associated with each AE was obtained from expert clinical opinion. For each AE included in the model, several treatment-dependent inputs are used to calculate the associated utility decrement: first, the utility decrement for a serious and for a non-serious event are multiplied by their respective duration, and then weighted by the proportion of serious events. Finally, the annual incidence of the event is applied. The annual AE-associated utility decrements for peginterferon beta-1a, interferon beta-1a 44 mcg, and glatiramer acetate 20 mg were 0.0132, 0.0145, and 0.0045, respectively. This annual utility decrement was applied only for patients on treatment.
Costs
Direct medical costs include: (1) costs of disease management by EDSS level (excluding cost of DMTs); (2) cost of managing relapse; (3) costs of DMTs and DMT-related administration and monitoring; and (4) AE management costs. All costs are reported in 2014 US dollars.
Disease management costs () and the cost of relapse ($2,151 per relapse) were obtained from published literatureCitation50, inflating the costs from 2004 to 2014 with an inflation factor of 1.378 based on the medical component of the consumer price indexCitation51. Treatment acquisition (i.e., cost of DMTs), administration, and monitoring costs and their corresponding sources are shown in .
Annual AE management costs were derived using a similar method to that applied for the annual AE-associated utility decrement. Management costs are calculated for each AE by first weighting the cost for a serious and for a non-serious event by the proportion of serious events for that given AE. Then, the annual incidence of the event is applied. This weighted annual cost is calculated for all AEs and then summed to give an annual AE management cost for each treatment. The annual AE management costs for peginterferon beta-1a, interferon beta-1a 44 mcg, and glatiramer acetate 20 mg were $90, $227, and $105, respectively. These annual AE management costs were applied only for patients on treatment.
Model validation
The model concept and structure have been reviewed and accepted by Health Technology Assessment agencies, such as NICE in the UKCitation19–23.
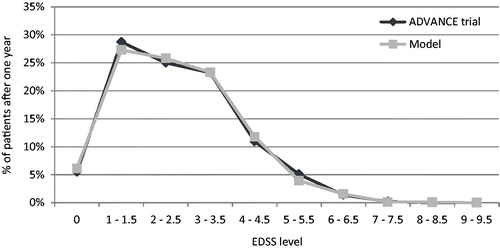
Predictive validity was checked by comparing the model-reported ARR and patients’ EDSS distribution after 1 year with data from the ADVANCE clinical trial for peginterferon beta-1a and placebo. Overall, the primary health outcomes of the model (i.e., ARR, EDSS distribution) were comparable with the outcomes reported in the ADVANCE trials for peginterferon beta-1a 125 mcg every 2 weeks and placebo ().
Figure 2. ARR validation: Model outcomes vs ADVANCE trial after 1 year. ARR, annualized relapse rate; mcg, microgram.
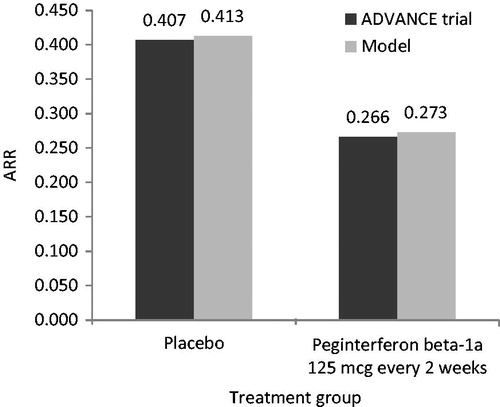
Figure 3. EDSS distribution validation: Model outcomes vs ADVANCE yrial after 1 year—placebo arm. EDSS, Expanded Disability Status Scale.
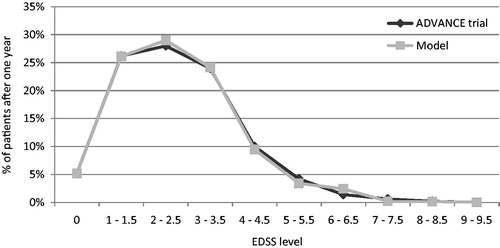
Figure 4. EDSS distribution validation: Model outcomes vs ADVANCE trial after 1 year—peginterferon beta-1a 125 mcg every 2 weeks arm. EDSS, Expanded Disability Status Scale; mcg, microgram.
Analyses
Model outcomes for each treatment were calculated using the life-table method for half-cycle correctionCitation52. Deterministic sensitivity analyses were conducted to evaluate how the model outcomes varied in relation to changes in one or more model parameters, and to demonstrate whether the model results were robust across those variations. In order to account for statistical uncertainties of multiple key parameters, probabilistic sensitivity analyses were performed by simultaneously varying parameters using specific distributions: (1) lognormal distribution for rate ratios on ARRs and hazard ratios (HRs) on disability progression relative to placebo (based on their 95% confidence interval [CI]), incidence of AEs, and relative risks for MS mortality; (2) beta distribution for transition probabilities from RRMS to SPMS, annual treatment discontinuation risk, proportion of AEs reported as serious, disutility for serious and non-serious AEs, and patient and caregiver utility; (3) gamma distribution for the cost and duration of serious and non-serious AEs, cost of relapse, and disease management; and (4) Dirichlet distribution for transition probabilities during RRMS and SPMS EDSS levels. Where a standard error or CI was not available for a selected parameter, 25% of the mean was assumed as standard error, a common approach in economic modelsCitation53,Citation54.
Results
Base case analysis
Compared with interferon beta-1a 44 mcg and glatiramer acetate 20 mg over 10 years, treatment with peginterferon beta-1a was associated with a slower rate of disability progression during RRMS and progression to SPMS, more time spent in less severe levels of disability (i.e. EDSS level <7), and fewer cases of treatment discontinuation due to lack of efficacy (). These benefits, along with a lower annual acquisition cost, resulted in peginterferon beta-1a being dominant (i.e., more effective and less costly) over both comparators, with cost-savings of $22,070 and additional 0.06 QALYs (95% CI [−0.11; 0.22] based on the probabilistic sensitivity analysis results) gained per patient compared with interferon beta-1a 44 mcg, and cost-savings of $19,163 and additional 0.07 QALYs (95% CI [−0.10; 0.22] based on the probabilistic sensitivity analysis results) gained per patient compared with glatiramer acetate 20 mg.
Table 3. Base case outcomes over 10 years.
Deterministic sensitivity analyses
and present the results of the deterministic sensitivity analyses for peginterferon beta-1a compared with interferon beta-1a 44 mcg and glatiramer acetate 20 mg, reporting the top 15 scenarios that had the most impact on the ICERs.
Figure 5. Results of the one-way sensitivity analyses of peginterferon beta-1a 125 mcg vs interferon beta-1a 44 mcg over 10 years. ARR, annualized relapse rate; BC, British Columbia; EDSS, Expanded Disability Status Scale; HR, hazard ratio; ICER, incremental cost-effectiveness ratio; IFN, interferon; mcg, microgram; PEG-IFN, peginterferon beta-1a 125 mcg; RRMS, relapsing-remitting multiple sclerosis. In rows with a comparator listed (i.e., PEG-IFN or IFN beta-1a 44 mcg), the parameter was varied only for that comparator. Black bars indicate that the ICER with PEG-IFN decreases compared with IFN beta-1a 44 mcg relative to the base case. White bars indicate that the ICER with PEG-IFN increases compared with IFN beta-1a 44 mcg relative to the base case. Bars with ICERs not reported indicate that PEG-IFN was dominant. *PEG-IFN was less effective and less expensive.
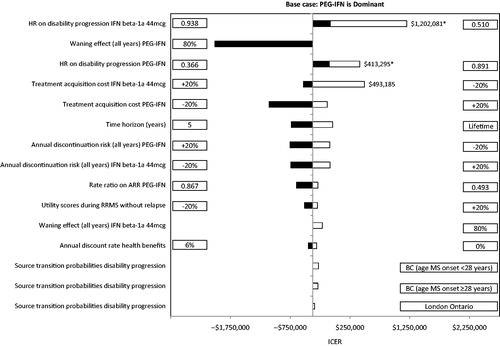
Figure 6. Results of the one-way sensitivity analyses of peginterferon beta-1a 25 mcg vs glatiramer acetate 20 mg over 10 years. ARR, annualized relapse rate; BC, British Columbia; GA, glatiramer acetate; HR, hazard ratio; ICER, incremental cost-effectiveness ratio; mcg, microgram; mg, milligram; PEG-IFN, peginterferon beta-1a 125 mcg; RRMS, relapsing-remitting multiple sclerosis; SPMS, secondary-progressive multiple sclerosis. In rows with a comparator listed (i.e., PEG-IFN or GA 20 mg), the parameters was varied only for that comparator. Black bars indicate that the ICER decreases compared with GA 20 mg relative to the base case. White bars indicate that the ICER with PEG-IFN increases compared with GA 20 mg relative to the base case. Bars with ICERs not reported indicate that PEG-IFN was dominant. *PEG-IFN was less effective and less expensive.
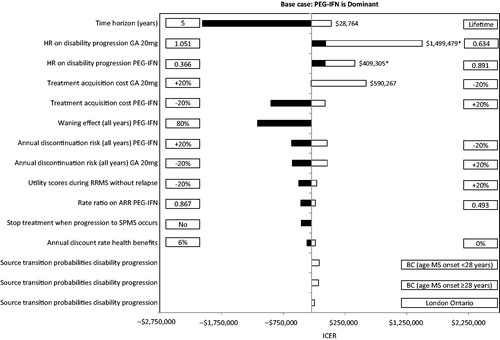
Peginterferon beta-1a remained dominant in all but three of the scenarios compared with interferon beta-1a 44 mcg, and four scenarios compared with glatiramer acetate 20 mg. When the treatment acquisition cost of the comparator was reduced by 20%, peginterferon beta-1a was not cost-effective (i.e., ICER was above the willingness-to-pay [WTP] threshold of $50,000 per QALY gained). In addition, peginterferon beta-1a was not cost-effective when the upper bound of the 95% CI of the HRs on disability progression of peginterferon beta-1a vs placebo (i.e., reduced effect of peginterferon beta-1a) was used, or when the lower bound of 95% CI of HRs on disability progression of the comparator vs placebo (i.e., improved effect of interferon beta-1a 44 mcg or glatiramer acetate 20 mg) was used. When the time horizon was extended to patients’ lifetime, peginterferon beta-1a was not dominant compared with glatiramer acetate 20 mg due to its higher dropout rate caused by lack of efficacy (thus a lower resultant overall treatment acquisition and monitoring cost). However, peginterferon beta-1a remained cost-effective in this scenario.
Probabilistic sensitivity analysis
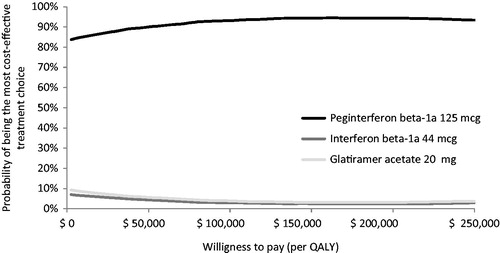
The probabilistic sensitivity analysis indicated that peginterferon beta-1a was dominant in >90% of 5,000 replications when compared with interferon beta-1a 44 mcg and glatiramer acetate 20 mg, and was cost-effective in 95% and 94% of the replications, respectively, over 10 years when using a WTP threshold of $50,000 per QALY gained ( and ). When the three treatments were compared using multi-way cost-effectiveness acceptability curves, peginterferon beta-1a was the optimal treatment choice at any WTP threshold among all the treatments ().
Figure 7. Results of the probabilistic sensitivity analysis of peginterferon beta-1a 125 mcg vs interferon beta-1a 44 mcg over 10 years. mcg, microgram; QALY, quality-adjusted life-year.
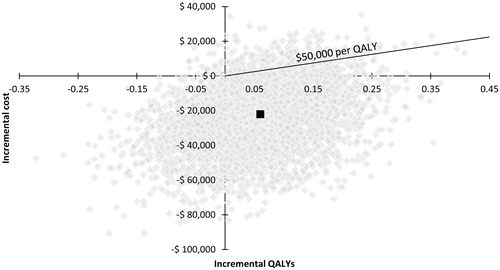
Figure 8. Results of the probabilistic sensitivity analysis of peginterferon beta-1a 125 mcg vs glatiramer acetate 20 mg over 10 years. mcg, microgram; mg, milligram; QALY, quality-adjusted life-year.
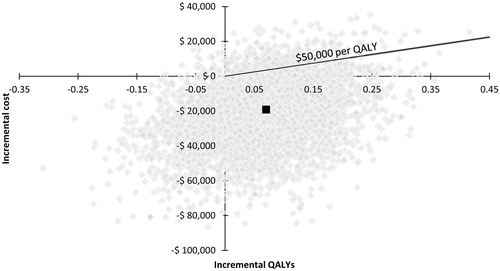
Figure 9. Multi-way cost-effectiveness acceptability curves over 10 years. mcg, microgram; mg, milligram; QALY, quality-adjusted life-year.
Discussion
The ADVANCE trial has demonstrated the benefits of peginterferon beta-1a in terms of delaying disability progression and reducing the frequency of relapses compared with placebo over 1 yearCitation18. Peginterferon beta-1a 125 mcg every 2 weeks was recently approved for use in patients with the relapsing form of MS by the FDA and is currently being evaluated for inclusion in formularies by managed care plans in the US. Findings from this analysis could provide the needed clinical and economic information for plan holders to make funding decisions on this treatment, and for clinicians and patients to make more informed treatment choices when considering peginterferon beta-1a 125 mcg every 2 weeks. This analysis suggests that long-term treatment with peginterferon beta-1a resulted in many clinical benefits, including a slower rate of disability progression during RRMS and progression to SPMS, and more QALYs gained, at reduced total cost compared with interferon beta-1a 44 mcg and glatiramer acetate 20 mg. The additional 0.06 QALYs (95% CI [−0.11; 0.22] based on the probabilistic sensitivity analysis results) gained per patient compared with interferon beta-1a 44 mcg, and the additional 0.07 QALYs (95% CI [−0.10; 0.22] based on the probabilistic sensitivity analysis results) gained per patient compared with glatiramer acetate 20 mg might seem small. However, they reflect the additional clinical benefits of peginterferon beta-1a, a slower rate of disability progression during RRMS and progression to SPMS, more time spent in less severe levels of disability (i.e., EDSS level <7), and fewer cases of treatment discontinuation due to lack of efficacy compared with interferon beta-1a 44 mcg and glatiramer acetate 20 mg. In addition, the deterministic and probabilistic sensitivity analyses consistently support the findings of the base case analysis, indicating that peginterferon beta-1a is a dominant treatment (i.e., more effective and less costly) in the majority of the scenarios or replications.
To further assess the robustness of the results from this analysis, a couple of issues concerning the quality of the model inputs need to be examined and discussed. First, the transition probabilities of disability progression during RRMS were obtained from the ADVANCE trial (for EDSS levels 0–5.5) and from the London, Ontario database (for EDSS levels 6–9.5). The former data source may be considered unrepresentative of patients with RRMS in actual practice due to the inclusion and exclusion criteria used in the trial and the short follow-up (1 year), which may be problematic for long-term extrapolation. The latter was collected about three decades ago and, thus, may not reflect the current natural history of disability progression. Due to these issues, we also used the recently published transition probabilities from the British Columbia (Canada), databaseCitation55 in the analysis, and peginterferon beta-1a remained dominant compared with interferon beta-1a 44 mcg () and glatiramer acetate 20 mg ().
Second, network meta-analysis is a common and acceptable approach to assess the relative treatment effects of multiple treatments when these data are not available from head-to-head clinical trialsCitation56,Citation57. The treatment effect of peginterferon beta-1a 125 mcg every 2 weeks used in this network meta-analysis was based on the 1-year, placebo-controlled ADVANCE study, which had a shorter follow-up time compared to 2–3 years for other studies of DMTs included in the network meta-analysisCitation33. Given that the results of the analysis are most sensitive to treatment effects, this could raise concern about the robustness of the study findings. Unfortunately, the longer-term comparative efficacy for peginterferon beta-1a 125 mcg every 2 weeks vs placebo or other DMTs is unavailable. However, data from the 2-year ADVANCE study, which assessed continuous treatment vs delayed treatment with peginterferon beta-1a, have shown that patients starting peginterferon beta-1a 125 mcg every 2 weeks at Year 1 continued to experience improvement in ARR from 0.230 (95% CI = 0.183–0.291) to 0.178 (95% CI = 0.136–0.233) at Year 2. In addition, continuous treatment with peginterferon beta-1a 125 mcg every 2 weeks from Year 1 was significantly better than delayed treatment (i.e., subjects assigned to placebo at Year 1, but to peginterferon beta-1a every 2 weeks at Year 2) in ARR (Rate ratio = 0.629; p < 0.0001), 3-month disability progression (HR = 0.67; p = 0.0257), and 6-month disability progression (HR = 0.59; p = 0.0137)Citation58. The findings from the 2-year ADVANCE data support the benefits of early treatment with peginterferon beta-1a 125 mcg every 2 weeks, and also indicate that the observed treatment effect of peginterferon beta-1a 125 mcg every 2 weeks vs placebo over the first year is very likely to be sustained for a longer term, therefore further improving the confidence of the results from this analysis.
In January 2014, SC glatiramer acetate 40 mg administered 3 times a week was approved by the US FDA based on the results of the GALA clinical trialCitation59. This DMT was not included as a comparator in this analysis for two reasons: first, the comparators included in this analysis, glatiramer acetate 20 mg once a day and interferon beta-1a 44 mcg (3 times a week), were selected as they are the two most commonly used injectable DMTs in the US market at the time of this analysis. This information is not yet available for glatiramer acetate 40 mg. Second, the comparative efficacy for each DMT vs placebo (i.e., no DMT) were obtained from a network meta-analysis of peginterferon beta-1a and injectable DMTs for RRMSCitation33, which did not include glatiramer acetate 40 mg. Based on the results of the GALA clinical trialCitation59, the rate ratio (i.e., treatment effect) on ARR for glatiramer acetate 40 mg compared with placebo is 0.656 (95% CI = [0.539; 0.799]), higher (i.e., lower or worse treatment effect) compared with that of peginterferon beta-1a 125 mcg, glatiramer acetate 20 mg, and interferon beta-1a 44 mcg relative to placebo. The HR (i.e., treatment effect) on disability progression was a major driver of the model results. For glatiramer acetate 40 mg, the HR on disability progression vs placebo is not provided in the GALA clinical trial. However, more patients experienced an EDSS confirmed progression with glatiramer acetate 40 mg (4.5%) than with placebo (3.7%)Citation59, whereas patients receiving peginterferon beta-1a 125 mcg, glatiramer acetate 20 mg, and interferon beta-1a 44 mcg experience less EDSS confirmed progressions compared with placeboCitation33. With an annual acquisition cost of $65,107 as of December 2014 for glatiramer acetate 40 mgCitation60, peginterferon beta-1a is anticipated to be dominant over glatiramer acetate 40 mg, as it was over glatiramer acetate 20 mg and interferon beta-1a 44 mcg in this analysis. Future economic models assessing the cost-effectiveness of injectable DMTs in patients with RRMS should include glatiramer acetate 40 mg, and new available generic DMTs (e.g., generic glatiramer acetate), if the information regarding its efficacy compared with other DMTs is available, for example, from a network meta-analysis. If the efficacy of generic DMTs in the ARR and disability progression can be proven similar to that of the current DMTs, the inclusion of generic DMTs could have a major impact in the results of this and future economic models assessing the cost-effectiveness of DMTs in patients with RRMS, due to the potential lower acquisition cost of the generic DMTs.
Limitations
This is the first analysis assessing the cost-effectiveness of peginterferon beta-1a vs other injectable DMTs using a well-validated model structureCitation19–23. Despite that, there are still a few limitations that need to be addressed. First, the analysis does not consider the impact of improved adherence on clinical and economic outcomes. This is because the long-term, real-world data on the adherence with peginterferon beta-1a relative to other injectable DMTs are not yet available. Thus, the more conservative approach was taken for this analysis. As peginterferon beta-1a is expected to improve adherence due to its reduced dosing frequency, such an omission is likely to favor other comparators and, thus, under-estimate the value of peginterferon beta-1a. Second, the impact of subsequent DMTs following treatment discontinuation is not considered in the analyses. Although including this feature would better reflect clinical practice in real life, it could however mask the true value of a specific DMT, as any benefits may result from other subsequent treatments. Because of this, it was decided to exclude subsequent lines of DMT in the current analysis. With that being said, future analyses should still examine the cost-effectiveness of different treatment sequences with and without peginterferon beta-1a to better reflect the treatment patterns of RRMS in actual practice.
Conclusion
In the era of the Affordable Care Act, more patients with MS who were previously uninsured or under-insured will gain access to careCitation61. This has the potential to further increase the rising cost of medications for MS substantially due to an expected higher number of patients to be treated with these DMTs. Hence, controlling the medication cost for MS will become an important and challenging task for many healthcare plan managers. This analysis suggests that peginterferon beta-1a not only improves clinical outcomes, but also reduces the overall treatment cost when compared with two of the most commonly prescribed DMTs in the US. Thus, peginterferon beta-1a should be a valuable addition to managed care formularies.
Transparency
Declaration of funding
This study was funded by Biogen.
Declaration of financial/other relationships
LH and SG are employed by Evidera, which provides consulting and other research services to pharmaceutical, device, governmental, and non-governmental organizations. In their salaried positions, they work with a variety of companies and organizations and are precluded from receiving payment or honoraria directly from these organizations for services rendered. Evidera has a research consultancy agreement with Biogen. EK and MF are employees of Biogen.
Acknowledgments
The authors would like to thank Malinda O’Donnell, Associate Director at Evidera, for her review, editorial support, and feedback on the manuscript.
Related Research Data
References
- Bainbridge JL, Corboy JR. Multiple sclerosis. In: Dipiro JT, Talbert RL, Yee GC, Matzke GR, Wells BG, Posey ML, eds. Pharmacotherapy: a pathophysiologic approach, 7th edn. New York, NY: McGraw-Hill Companies, Inc, 2008. p. 913-26
- Compston A, Coles A. Multiple sclerosis. Lancet 2002;359:1221-31
- Campbell JD, Ghushchyana V, Brett McQueena R, et al. Burden of multiple sclerosis on direct, indirect costs and quality of life: National US estimates. Mult Scler Relat Disord 2014;3:227-36
- Klevan G, Jacobsen CO, Aarseth JH, et al. Health related quality of life in patients recently diagnosed with multiple sclerosis. Acta Neurolog Scand 2014;129:21-6
- McDowell TY, Amr S, Langenberg P, et al. Time of birth, residential solar radiation and age at onset of multiple sclerosis. Neuroepidemiology 2010;34:238-44
- Wallin MT, Culpepper WJ, Coffman P, et al. The Gulf War era multiple sclerosis cohort: age and incidence rates by race, sex and service. Brain 2012;135:1778-85
- World Health Organisation. Atlas: Multiple Sclerosis Resources in the World. 2008. http://www.who.int/mental_health/neurology/Atlas_MS_WEB.pdf. Accessed November 2, 2014
- Pompili M, Forte A, Palermo M, et al. Suicide risk in multiple sclerosis: a systematic review of current literature. J Psychosom Res 2012;73:411-17
- Hanson KA, Agashivala N, Wyrwich KW, et al. Treatment selection and experience in multiple sclerosis: survey of neurologists. Patient Prefer Adher 2014;8:415-22
- National Multiple Sclerosis Society. Treating MS: Medications. 2015. http://www.nationalmssociety.org/Treating-MS/Medications. Accessed March 2, 2015
- The Express Scripts Lab. The 2014 Drug Trend Report. 2015. http://lab.express-scripts.com/drug-trend-report/. Accessed March 26, 2015
- Margolis JM, Fowler R, Johnson BH, et al. Disease-modifying drug initiation patterns in commercially insured multiple sclerosis patients: a retrospective cohort study. BMC Neurol 2011;11:122
- Menzin J, Caon C, Nichols C, et al. Narrative review of the literature on adherence to disease-modifying therapies among patients with multiple sclerosis. JMCP 2013;19(1 Suppl A):S24-40
- Devonshire V, Lapierre Y, Macdonell R, et al. The Global Adherence Project (GAP): a multicenter observational study on adherence to disease-modifying therapies in patients with relapsing-remitting multiple sclerosis. Eur J Neurol Off J Eur Fed Neurol Soc 2011;18:69-77
- Fox RJ, Miller DH, Phillips JT, et al. Placebo-controlled phase 3 study of oral BG-12 or glatiramer in multiple sclerosis. N Engl J Med 2012;367:1087-97
- Steinberg SC, Faris RJ, Chang CF, et al. Impact of adherence to interferons in the treatment of multiple sclerosis: a non-experimental, retrospective, cohort study. Clin Drug Invest 2010;30:89-100
- Tan H, Cai Q, Agarwal S, et al. Impact of adherence to disease-modifying therapies on clinical and economic outcomes among patients with multiple sclerosis. Adv Ther 2011;28:51-61
- Calabresi PA, Kieseier BC, Arnold DL, et al. Pegylated interferon beta-1a for relapsing-remitting multiple sclerosis (ADVANCE): a randomised, phase 3, double-blind study. Lancet Neurol 2014;13:657-65
- Gani R, Giovannoni G, Bates D, et al. Cost-effectiveness analyses of natalizumab (Tysabri) compared with other disease-modifying therapies for people with highly active relapsing-remitting multiple sclerosis in the UK. PharmacoEconomics 2008;26:617-27
- Chilcott J, McCabe C, Tappenden P, et al. Modelling the cost effectiveness of interferon beta and glatiramer acetate in the management of multiple sclerosis. Commentary: evaluating disease modifying treatments in multiple sclerosis. BMJ 2003;326:522; discussion 522
- Cooper K, Bryant J, Harris P, et al. Alemtuzumab for the treatment of relapsing-remitting multiple sclerosis: a single technology appraisal. Evidence Review Group Report commissioned by the NIHR HTA Programme on behalf of NICE. The Southampton Health Technology Assessments Centre (SHTAC), 2013. https://www.nice.org.uk/guidance/ta312/documents/multiple-sclerosis-relapsingremitting-alemtuzumab-evaluation-report3. Accessed November 2, 2014
- CRD and CHE Technology Assessment Group. Fingolimod for the treatment of relapsing remitting multiple sclerosis. Evidence Review group report by the Centre for Reviews and Dissemination and Centre for Health Economics Technology Assessment Group 6 September. 2011. http://www.nice.org.uk/guidance/ta254/documents/multiple-sclerosis-relapsingremitting-fingolimod-appraisal-consultation-evidence-review-group-report2. Accessed September 4, 2014
- Peninsula Technology Assessment Group (PenTAG). The effectiveness and cost-effectiveness of natalizumab for multiple sclerosis: an evidence review of the submission from Biogen. Evidence Review Group Report commissioned by NHS R&D HTA Programme on behalf of: NICE. 2007. https://www.nice.org.uk/guidance/ta127/documents/multiple-sclerosis-natalizumab-evaluation-report-evidence-review-group-report2. Accessed September 4, 2014
- Lee S, Baxter DC, Limone B, et al. Cost-effectiveness of fingolimod versus interferon beta-1a for relapsing remitting multiple sclerosis in the United States. J Med Econ 2012;15(6):1088-1096.
- Noyes K, Bajorska A, Chappel A, et al. Cost-effectiveness of disease-modifying therapy for multiple sclerosis: a population-based study. Neurology. Jul 26 2011;77:355-63
- Prosser LA, Kuntz KM, Bar-Or A, et al. Cost-effectiveness of interferon beta-1a, interferon beta-1b, and glatiramer acetate in newly diagnosed non-primary progressive multiple sclerosis. Value Health J Int Soc Pharmacoecon Outcomes Res 2004;7:554-68
- Lipscomb J, Weinstein MC, Torrance GW. Time preference. In: Gold MR, Siegel JE, Russell LB, Weinstein MC, eds. Cost-effectiveness in health and medicine. New York: Oxford University Press, 1996. p. 214-46
- ADVANCE trial. Data on file.
- Weinshenker BG, Bass B, Rice GP, et al. The natural history of multiple sclerosis: a geographically based study. I. Clinical course and disability. Brain 1989;112:133-46
- Weinshenker BG, Bass B, Rice GP, et al. The natural history of multiple sclerosis: a geographically based study. 2. Predictive value of the early clinical course. Brain 1989;112:1419-28
- Orme M, Kerrigan J, Tyas D, et al. The effect of disease, functional status, and relapses on the utility of people with multiple sclerosis in the UK. Value Health J Int Soc Pharmacoecon Outcomes Res 2007;10:54-60
- Patzold U, Pocklington PR. Course of multiple sclerosis. First results of a prospective study carried out of 102 MS patients from 1976–1980. Acta Neurolog Scand 1982;65:248-66
- Tolley K, Hutchinson M, You X, et al. a network meta-analysis of efficacy and evaluation of safety of subcutaneous pegylated interferon Beta-1a versus other injectable therapies for the treatment of relapsing-remitting multiple sclerosis. PLoS One 2015;10:e0127960
- Wong J, Gomes T, Mamdani M, et al. Adherence to multiple sclerosis disease-modifying therapies in Ontario is low. Can J Neurol Sci J Can Sci Neurolog 2011;38:429-33
- Canadian Agency for Drugs and Technologies in Health. CADTH therapeutic review. Comparative clinical and cost-effectiveness of drug therapies for relapsing-remitting multiple sclerosis [Internet]. Ottawa: The Agency, 2013. (CADTH Therapeutic Review vol.1, no. 2b). https://www.cadth.ca/sites/default/files/pdf/TR0004_RRMS_ScienceReport_e.pdf. Accessed June 9, 2014
- Schwid SR, Panitch HS. Full results of the Evidence of Interferon Dose-Response-European North American Comparative Efficacy (EVIDENCE) study: a multicenter, randomized, assessor-blinded comparison of low-dose weekly versus high-dose, high-frequency interferon beta-1a for relapsing multiple sclerosis. Clin Therapeut 2007;29:2031-48
- Ebers GC, Rice G, Lesaux, J, et al. Randomised double-blind placebo-controlled study of interferon (beta)-1a in relapsing/remitting multiple sclerosis. Lancet 1998;352:1498-504
- Mikol DD, Barkhof F, Chang P, et al. Comparison of subcutaneous interferon beta-1a with glatiramer acetate in patients with relapsing multiple sclerosis (the REbif vs Glatiramer Acetate in Relapsing MS Disease [REGARD] study): a multicentre, randomised, parallel, open-label trial. Lancet Neurol 2008;7:903-14
- Vermersch P, Czlonkowska A, Grimaldi LM, et al. Teriflunomide versus subcutaneous interferon beta-1a in patients with relapsing multiple sclerosis: a randomised, controlled phase 3 trial. Mult Scler May 2014;20:705-16
- Calabrese M, Bernardi V, Atzori M, et al. Effect of disease-modifying drugs on cortical lesions and atrophy in relapsing-remitting multiple sclerosis. Mult Scler 2012;18:418-24
- Etemadifar M, Janghorbani M, Shaygannejad V. Comparison of Betaferon, Avonex, and Rebif in treatment of relapsing-remitting multiple sclerosis. Acta Neurol Scand 2006;113:283-7
- Cadavid D, Wolansky LJ, Skurnick J, et al. Efficacy of treatment of MS with IFNbeta-1b or glatiramer acetate by monthly brain MRI in the BECOME study. Neurology 2009;72:1976-83
- O'Connor P, Filippi M, Arnason B, et al. 250 microg or 500 microg interferon beta-1b versus 20 mg glatiramer acetate in relapsing-remitting multiple sclerosis: a prospective, randomised, multicentre study. Lancet Neurol 2009;8:889-97
- Lublin FD, Cofield SS, Cutter GR, et al. Randomized study combining interferon and glatiramer acetate in multiple sclerosis. Ann Neurol 2013;73:327-40
- Comi G, Filippi M, Wolinsky JS. European/Canadian multicenter, double-blind, randomized, placebo-controlled study of the effects of glatiramer acetate on magnetic resonance imaging–measured disease activity and burden in patients with relapsing multiple sclerosis. European/Canadian Glatiramer Acetate Study Group. Ann Neurol 2001;49:290-7
- Johnson KP, Brooks BR, Cohen JA, et al. Copolymer 1 reduces relapse rate and improves disability in relapsing-remitting multiple sclerosis: results of a phase III multicenter, double-blind placebo-controlled trial. The Copolymer 1 Multiple Sclerosis Study Group. Neurology 1995;45:1268-76
- Bornstein MB, Miller A, Slagle S, et al. A pilot trial of Cop 1 in exacerbating-remitting multiple sclerosis. N Engl J Med 1987;317:408-14
- 2010 United States Life Tables. Human Mortality Database. University of California, Berkeley (USA), and Max Planck Institute for Demographic Research (Germany), www.mortality.org or www.humanmortality.de. Accessed February 23, 2014
- Pokorski RJ. Long-term survival experience of patients with multiple sclerosis. J Insur Med 1997;29:101-6
- Kobelt G, Berg J, Atherly D, et al. Costs and quality of life in multiple sclerosis: a cross-sectional study in the United States. Neurology 2006;66:1696-702
- United States Department of Labor. Bureau of Labor Statistics. Consumer Price Index. 2014, http://www.bls.gov/home.htm. Accessed March 31, 2014
- Barendregt JJ. The life table method of half cycle correction: getting it right. Med Decis Making Int J Soc Med Decis Making 2014;34:283-5
- Getsios D, Blume S, Ishak KJ, et al. Cost effectiveness of donepezil in the treatment of mild to moderate Alzheimer's disease: a UK evaluation using discrete-event simulation. PharmacoEconomics 2010;28:411-27
- Guo S, Bozkaya D, Ward A, et al. Treating relapsing multiple sclerosis with subcutaneous versus intramuscular interferon-beta-1a: modelling the clinical and economic implications. PharmacoEconomics 2009;27:39-53
- Palace J, Bregenzer T, Tremlett H, et al. UK multiple sclerosis risk-sharing scheme: a new natural history dataset and an improved Markov model. BMJ Open 2014;4:e004073
- Jansen JP, Fleurence R, Devine B, et al. Interpreting indirect treatment comparisons and network meta-analysis for health-care decision making: report of the ISPOR Task Force on Indirect Treatment Comparisons Good Research Practices: part 1. Value Health J Int Soc Pharmacoecon Outcomes Res 2011;14:417-28
- Hoaglin DC, Hawkins N, Jansen JP, et al. Conducting indirect-treatment-comparison and network-meta-analysis studies: report of the ISPOR Task Force on Indirect Treatment Comparisons Good Research Practices: part 2. Value Health J Int Soc Pharmacoecon Outcomes Res 2011;14:429-37
- Kieseier BC, Arnold DL, Balcer LJ, et al. Peginterferon beta-1a in multiple sclerosis: 2-year results from ADVANCE. Mult Scler 2014;
- Khan O, Rieckmann P, Boyko A, et al. Three times weekly glatiramer acetate in relapsing-remitting multiple sclerosis. Ann Neurol 2013;73:705-13
- Red Book. Red Book For Windows. 2014
- Mathis AS, Owens GM. Implications for multiple sclerosis in the era of the Affordable Care Act: the shifting managed care landscape. Am J Manag Care 2014;20(11 Suppl):s242-53
- Centers for Medicare and Medicaid Services (CMS). Physician Fee Schedule - National Payment Amount - Non-Facility Price. 2014. http://www.cms.gov/apps/physician-fee-schedule/overview.aspx. Accessed March 2, 2015
- Centers for Medicare and Medicaid Services (CMS). Clinical Diagnostic Laboratory Fee Schedule. 2014. http://www.cms.gov/Medicare/Medicare-Fee-for-Service-Payment/ClinicalLabFeeSched/clinlab.html. Accessed March 2, 2015
- National Institute for Health and Clinical Excellence (NICE). Natalizumab costing template and report. Technology Appraisal Guidance TA127: Natalizumab for the treatment of adults with highly active relapsing-remitting multiple sclerosis. 2007. http://www.nice.org.uk/guidance/ta127/costing. Accessed September 4, 2014