ABSTRACT
Developing exposure estimates is a challenging aspect of investigating the health effects of air pollution. Pollutant levels recorded at centrally located ambient air quality monitors in a community are commonly used as proxies for population exposures. However, if ample intraurban spatial variation in pollutants exists, city-wide averages of concentrations may introduce exposure misclassification. We assessed spatial heterogeneity of particulate matter with an aerodynamic diameter ≤ 10 μm (PM10) and ozone (O3) and evaluated implications for epidemiological studies in São Paulo, Brazil, using daily (24-hr) and daytime (12-hr) averages and 1-hr daily maximums of pollutant levels recorded at the regulatory monitoring network. Monitor locations were also analyzed with respect to a socioeconomic status index developed by the municipal government. Hourly PM10 and O3 data for the São Paulo Municipality and Metropolitan Region (1999–2006) were used to evaluate heterogeneity by comparing distance between monitors with pollutants' correlations and coefficients of divergence (CODs). Both pollutants showed high correlations across monitoring sites (median = 0.8 for daily averages). CODs across sites averaged 0.20. Distance was a good predictor of CODs for PM10 (p < 0.01) but not O3, whereas distance was a good predictor of correlations for O3 (p < 0.01) but not PM10. High COD values and low temporal correlation indicate a spatially heterogeneous distribution of PM10. Ozone levels were highly correlated (r ≥ 0.75), but high CODs suggest that averaging over O3 levels may obscure important spatial variations. Of municipal districts in the highest of five socioeconomic groups, 40% have ≥1 monitor, whereas districts in the lowest two groups, representing half the population, have no monitors. Results suggest that there is a potential for exposure misclassification based on the available monitoring network and that spatial heterogeneity depends on pollutant metric (e.g., daily average vs. daily 1-hr maximum). A denser monitoring network or alternative exposure methods may be needed for epidemiological research. Findings demonstrate the importance of considering spatial heterogeneity and differential exposure misclassification by subpopulation.
This study is the first of its kind in São Paulo, Brazil: the findings provide relevant and novel information regarding spatial characteristics of air pollution in this region, a “mega-city” with 18 million inhabitants. Results suggest that a potential for exposure misclassification exists in the most commonly used epidemiological study designs of air pollution and health, particularly for groups of lower socioeconomic status. Overall, the study highlights the importance of considering spatial heterogeneity of air pollution and potential biases in pre-existing monitor networks. Results will inform and improve future epidemiological studies in this region and in other large, urban areas.
INTRODUCTION
At least one-fourth of the world's population is exposed to unhealthy concentrations of ambient air pollutants.Citation1 Particulate matter (PM) and ozone (O3) have been linked with a range of adverse human health effects, including aggravated respiratory and cardiovascular disease, reduced lung function, changes in lung tissue, acute respiratory infections, adverse pregnancy outcomes, and premature mortality.Citation2–5 Most studies of air pollution and health have been conducted for North America and Europe, although many studies have examined impacts in Latin America.Citation6–8
Despite the growing body of scientific research exploring links between air pollutants and health effects, significant gaps remain. One such question is how methods to estimate air pollution exposure influence resulting health effect estimates. Most population-based studies of health and air pollution estimate exposure using measurements from a single monitor or averaging over values from a small number of centrally located monitors. Use of monitoring networks is popular for estimating exposure levels because many cities have established networks designed to provide population-level exposures and often the data are publically available. Thus, this approach is highly efficient and economical. The inherent assumption in using pollutant levels observed at one or several monitoring stations as exposure proxies for an urban population is that pollutants of concern are homogeneously distributed across the study area. Few studies have investigated the validity of this assumption, particularly for São Paulo, Brazil. If pollutants are not uniformly distributed, depending on study design, exposure misclassification would occur. For this reason, study of exposure to air pollutants at the intraurban extent has been identified as a priority for epidemiological research and exposure assessment.Citation9 Because spatial heterogeneity of pollution levels may differ by pollutant and location and the structure of monitoring networks can affect exposure measurement error, researching this issue on a local basis is critical.
Understanding spatial heterogeneity of air pollutants is particularly relevant for the mega-city of São Paulo. São Paulo Municipality has a population of 11 million people; the São Paulo Metropolitan Region has 19 million inhabitants.Citation10 Previous studies have documented high levels of air pollution in São Paulo and associated health effects in the Municipality and parts of the Metropolitan Region.Citation8,Citation11–13 Several studies used 24-hr average concentrations of PM with aerodynamic diameter ≤10 μm (PM10) and/or 1-hr daily maximums of O3 obtained at monitoring sites in São Paulo.Citation4,Citation5,Citation11,Citation14,Citation15
Improved understanding of spatial heterogeneity of air pollutant levels can aid the design, application, and interpretation of epidemiological studies. This study uses correlation coefficients and coefficients of divergence (CODs) to evaluate the spatial heterogeneity of PM10 and O3 levels in São Paulo. We also analyzed the location of monitors with respect to socioeconomic status (SES) to assess whether the uncertainty of exposure estimates differs by subset of the population.
METHODS
Site Description
São Paulo is the industrial and economic hub of Brazil, responsible for nearly one-fifth of the Brazilian gross national product. The Metropolitan Region is also home to more than 40,000 polluting industries and 5.7 million vehicles, comprising more than 20% of the total Brazilian vehicle fleet. Three million vehicles circulate daily and another 1 million enter the region every day, including 350,000 trucks.Citation16,Citation17 The bus system is one of the largest and most complex in the world and is the primary means of transport for much of the population. Because of São Paulo's large private vehicle fleet, extensive public transport system, and traffic congestion, transportation is a major contributor to air pollution.Citation18,Citation19
According to the Köppen climate classification, São Paulo has a humid subtropical climate with a wet season from October to April and a dry season from May to September.Citation20 The city is situated on a plateau ∼860 m above sea level and is surrounded by hills with elevations of 1200–1600 m. This geography can produce frequent thermal inversion events during the dry season, effectively trapping air pollutants in the lowland area that São Paulo occupies.Citation21
Pollution Data
Hourly air concentration data for PM10 and O3 from 1999 through 2006 were obtained from the State of São Paulo's environmental regulatory agency, the Companhia de Tecnologia de Saneamento Ambiental (CETESB), and the Instituto de Astronomía, Geofísica, e Ciências Atmosféricas (IAG) at the Universidade de São Paulo. CETESB maintains a network of air pollution monitors distributed throughout São Paulo Municipality, Metropolitan Region, and State. The monitoring network in São Paulo Municipality is a subset of the greater São Paulo Metropolitan Region network. All locations in both networks monitored hourly PM10 levels, but only a subset of locations within each network monitored O3 concentrations.
The data originally provided by CETESB and IAG reported hourly measurements of pollutant levels for eachmonitor. Not all monitors had data for the entire study period. Each hourly measurement was accompanied by an operation code indicating whether the measurement was considered valid (e.g., the monitoring instrument was functioning properly). Hourly records with invalid or missing operation codes were excluded.
Three sets of PM10 data were generated from the hourly PM10 data: 24-hr daily averages, 12-hr daytime averages, and daily 1-hr maximums. Many days did not have a complete set of measurements (i.e., <24 observations). A 24-hr daily average was only calculated and included in subsequent analyses if the 24-hr day had ≥21 hr of data with valid operation codes. A second dataset was generated by creating a 12-hr (8:00 a.m.– 8:00 p.m.) daytime average of PM10 levels. Daytime averages were only calculated for days with ≥11 hr of data with valid operation codes in the 12-hr period. The third dataset reported the daily 1-hr maximum PM10 concentration for days with ≥21 hr of data. This process was repeated with the hourly O3 data to generate three comparable sets of O3 metrics, using the same exclusion criteria applied to PM10.
Years for analysis were selected on the basis of a protocol designed to minimize biases from missing data. Each pollution metric for PM10 and O3 for each year in the study period was divided into quartiles: (1) January–March, (2) April–June, (3) July–September, and (4) October– December. Quartiles were used to determine the completeness of data for each monitor to avoid seasonal bias. Although São Paulo's subtropical climate does not have four distinct seasons, this method captures potential changes in spatial heterogeneity associated with the different meteorological and atmospheric conditions. For each monitoring station, a given year was included in the analysis if valid data were available for ≥75% of days within each quartile of that year for the pollution metric and pollutant of interest.
Data Analysis
For each monitor pair and pollution metric, Pearson correlation coefficients and COD values were calculated and compared with the distance between monitors. Latitude and longitude coordinates of each monitoring station were used to determine distances between individual monitor pairs. Analysis was performed using R statistical software version 2.8.
The COD is defined as
Correlation coefficients and CODs provide different types of information regarding the spatial distribution of pollutants. A correlation coefficient shows whether pollutant levels at different locations covary over time but does not provide information on whether the absolute levels are similar. For example, a monitor that consistently has values exactly twice that of another monitor would have different absolute levels, but a correlation of 1. Conversely, monitors could have similar absolute levels, but a low correlation. Whereas correlation coefficients are commonly used to assess uniformity of pollutant concentrations, studies in the United States indicate that they poorly predict concentration uniformity because they track temporal similarity of paired sites but do not exhibit a strong relationship with spatial homogeneity of pollutant concentrations.Citation9,Citation24 This study considers how pollutant levels covary (correlations) in addition to the relationship among absolute levels (COD). Because we compare correlations and COD values across time within monitor pairs, both spatial and temporal variation are incorporated. Both types of statistics have been used to estimate relationships among air pollutant levels in previous studies.Citation25–27
Correlations and COD values were calculated for each monitor pair for each pollutant and pollution metric (e.g., daily and daytime averages, daily 1-hr maximum). Linear models were used to investigate how correlations and CODs varied by distance between monitors. Long-term trends in pollutant concentrations were evaluated by computing annual average concentrations for each monitoring station and pollution metric. Pollutant levels were compared with health-based Brazilian PM10 and O3 air quality standards.Citation16
RESULTS
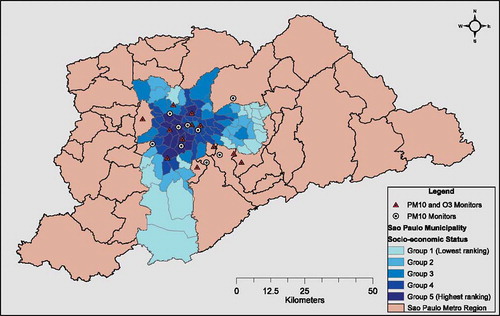
The original data reported hourly measurements of pollutant levels and consisted of a variable number of monitoring stations for a given pollutant, depending on the year, because the number of participating stations fluctuated when monitors were added or removed from the network or temporarily taken offline for maintenance. Ultimately, 21 monitoring stations met the exclusion criteria, 12 in São Paulo Municipality and 9 in the São Paulo Metropolitan Region (). All monitors measured PM10 and 12 measured O3 (7 in the Municipality and 5 in the Metropolitan Region).
Figure 1. PM10 and O3 monitoring stations: São Paulo Municipality and São Paulo Metropolitan Region.
Correlation and CODs of Pollutant Levels
The spatial heterogeneity of pollutant levels was examined by calculating correlation coefficients and CODs for daily (24-hr) averages, daytime (12-hr) averages, and daily 1-hr maximum concentrations observed at monitor pairs for each pollutant and metric (). Correlation coefficients and COD values versus distance for the PM10 24-hr average and 1-hr daily maximum pollutant metrics are shown in and The 24-hr daily average is the metric by which PM10 is regulated in São Paulo (for similar graphs of the PM10 12-hr daytime average, see supplemental data published at http://secure.awma.org/onlinelibrary/samples/10.3155-1047-3289.61.1.69_supplmaterial.pdf). Ranges in PM10 correlation coefficients were wider for the daily 1-hr maximum and smallest for the daily average. Relative to the 24- and 12-hr averages, correlation coefficients for daily 1-hr maximum PM10 levels tended to be lower, with no correlation coefficients greater than 0.80. In general, correlation coefficients declined with increasing distance between monitors. The daily 1-hr maximum PM10 metric exhibited low correlation coefficients (e.g., 0.20–0.40) for some monitor pairs at close distances (within 5 km); coefficients for the 24-hr average PM10 metric were somewhat higher. CODs for PM10 concentrations at monitor pairs were comparable for 24- and 12-hr averages, whereas CODs for daily 1-hr maximums tended to be higher (). The slopes of all lines fitted in and were significantly different from zero (p < 0.01).
Table 1. Mean, median, and range of correlation coefficients and COD
Figure 2. Correlation coefficients vs. monitor pair distance: (a) PM10 24-hr daily average and (b) PM10 1-hr daily maximum.
Figure 3. CODs vs. monitor pair distance: (a) PM10 24-hr daily average and (b) PM10 1-hr daily maximum.
Correlation coefficients and COD values versus distance for the O3 24-hr average and 1-hr daily maximum pollutant metrics are shown in and ; the daily 1-hr maximum O3 level is the metric by which O3 is regulated in São Paulo (for similar graphs of the O3 12-hr daytime average, see supplemental data). The 1-hr maximum exhibited the largest variation in correlation coefficient values, followed by the 24- and 12-hr averages. CODs for mean O3 concentrations at different sets of monitor pairs were comparable for 24- and 12-hr averages, whereas CODs for daily 1-hr maximum O3 concentrations at different monitor pairs were lower and exhibited less variation (). The slopes of the fitted lines in and were all significantly different from zero (p < 0.01), with the exception of the COD for the 24-hr average O3 metric.
Figure 4. Correlation coefficients vs. monitor-pair distance: (a) O3 24-hr daily average and (b) O3 1-hr daily maximum.
Figure 5. CODs vs. monitor-pair distance: O3 24-hr daily average and (b) O3 1-hr daily maximum.
Results from a linear model relating correlation and COD to distance are shown in . This table also provides the predicted correlation and COD at a distance of 40 km, representing an estimate of the farthest distance between any point in the study area and a monitoring location. Predicted correlations of daily averages at 40 km are 0.81 for PM10 and 0.64 for O3. The 24-hr average had the most similar (homogeneous) PM10 levels (i.e., highest correlation and lowest COD). For O3, the highest correlation is for 12-hr averages, but the lowest COD values are for the 1-hr maximum. Distance between monitors was a good predictor of CODs for all PM10 metrics, but not for correlation, with the exception of the 12-hr average (p <0.01). Predicted percent change in PM10 CODs for a 10-km increase in distance between monitor pairs, evaluated at the median, ranged from 9 to 18.6%. Predicted percent changes in correlation were smaller in magnitude, ranging from –5.2 to –1.7%. Distance was a good predictor of correlation for all O3 metrics (p < 0.01) but not for CODs. For O3, percent changes in COD and correlation for a 10-km increase in distance, evaluated at the median, ranged from 7.6 to 11.6% for CODs and from –10.9 to –6% for correlation.
Table 2. Percent change in correlation and COD (10-km increase in distance)
Monitor Coverage by SES
São Paulo Municipality monitors used in this study were concentrated near the historical city center (). The government of São Paulo Municipality has developed an SES indicator at the municipal district level. This index groups districts into one of five categories, on the basis of population density, growth rate, median age, average family income level, education level, infant mortality rates, housing characteristics, number of people residing in low-income housing, and external cause mortality rate, aggregated at the municipal district level.Citation28 Higher categories of this SES index are associated with higher average family income and educational levels, lower infant and external cause mortality rates, and fewer people residing in poor-quality housing. Because of the complex nature of socioeconomic conditions, this index may also reflect other features at the municipal district level, such as higher population or emission density. The index represents just one indicator of SES at the population level: true SES would include variation by individual, historical financial status (e.g., previous income), and other measures.Citation29,Citation30
Monitor locations were evaluated with respect to the government-compiled SES index. Of the 96 municipal districts that comprise the São Paulo Municipality, 63 districts (65%) belong to the highest three SES categories. All monitors in this analysis in the Municipality were located in 1 of these 63 districts, although ∼50% of the Municipality's population resides in districts belonging to the lowest two SES groups, those with no monitor coverage. Monitoring densities measured per population and area (km2) were highest for the districts with the highest SES; monitor densities decline with declining SES (). Of municipal districts belonging to the highest SES category, 40% have at least one monitoring station, compared with no monitors in municipal districts belonging to the lowest two SES categories ().
Table 3. Monitor density by SES of municipal district
Trends in Pollutant Levels and Exceedance of Regulatory Standards
Average annual pollutant levels were calculated to evaluate long-term trends and compare with regulatory standards. PM10 levels generally declined during the study period for the Municipality and Metropolitan Region. Annual average O3 levels fluctuated from year to year, and long-term trends were not identified at the municipal or regional level. The annual average pollution concentrations by station and year for PM10 and O3 are found in the supplemental data.
The State of São Paulo's environmental agency, CETESB, established a PM10 24-hr average standard of 150 μg/m3 not to be exceeded more than once per year, in addition to an annual average standard of 50 μg/m3. Five of the 12 monitors in the Municipality and 3 of the 9 monitors in the Metropolitan Region had at least 1 year in which the annual average PM10 concentration exceeded the annual average regulatory standard (50 μg/m3). Seven of 11 monitors in São Paulo Municipality and 6 of 9 monitors in the Metropolitan Region had at lease one exceedance of the 24-hr standard during the study period. The percentage of days in the study period exceeding the 24-hr average PM10 standard was low (≤1%). Additional information on PM10 monitors and pollution levels recorded is provided in of the supplemental data.
The CETESB standard for O3 consists of a daily 1-hr maximum value of 160 μg/m3, which is not to be exceeded more than once per year. All stations in both the Municipality and Metropolitan Region exceeded the O3 standard during the study period. Five of seven monitors in the Municipality and four of five monitors in the Metropolitan Region recorded exceedance of the O3 standard on 5 to 15% of days in the study period. Additional information on O3 monitors and pollution levels recorded is provided in of the supplemental data.
DISCUSSION
Research has demonstrated the need to consider intraurban variability in air pollution levels and the impact that such variability may have on health effect estimates.Citation2,Citation31–34 Several studies have shown that for some pollutants, variation within cities may exceed variations between cities, and intraurban differences in exposure gradients can be large enough to be significantly associated with health effects.Citation35,Citation36 Between-community variation in pollution patterns could result from local topography or built environment characteristics (e.g., street canyons) affecting dispersion of pollutants, differences in traffic density and type, proximity to large roadways, and different locally dominant land-use types. Local gradients of pollutant levels in developing world cities may be steeper than those in cities of developed countries because of an older motor vehicle fleet, burning of biomass and refuse, and other localized sources.Citation37 Weather may also play a role, and future work could use weather observations to determine whether wind direction or other weather patterns affect uniformity of pollutant distribution in São Paulo.
Choice of study design and exposure assessment method determines the impact that spatial heterogeneity may have on health effect estimates. The most common study designs used to examine potential links between health and air pollution levels are time-series and cohort studies.Citation38 For studies comparing day-to-day variation in pollution levels with day-to-day variation in health response (e.g., time-series or case-crossover studies), spatial heterogeneity reflected in low correlations across a community will influence results. Differences in absolute pollution levels represented by COD values will affect ecological and cohort studies comparing pollution and health response between different communities, rather than across time within a single community. Such studies assume that variations in pollutant levels within a city are negligible relative to variations between different cities.
Studies evaluating the degree of intraurban variation in PM have primarily been conducted in the United States or Europe.Citation23,Citation36,Citation39–42 Some found evidence of a relatively uniform distribution of PM10 and PM with an aerodynamic diameter ≤10 but ≥2.5 μm (PM10–2.5)Citation40,Citation43, whereas others suggest wide variation in the degree of intraurban variability.Citation24,Citation38 A recent study in Detroit, Michigan (United States) observed a high correlation in PM10–2.5 levels at nearby monitoring sites, but concluded that a central monitoring site did not provide an accurate proxy for exposure across the city.Citation44 A review of studies of intraurban heterogeneity found that PM levels across cities did not adhere to assumptions about intraurban uniformity, and methods selected to describe uniformity could affect conclusions.Citation9 That review considered CODs <0.20 as suggestive of spatial homogeneity. In applying that general guideline to this analysis, more than half of the COD values calculated for monitor pairs' daily and daytime averages of PM10 are indicative of spatial homogeneity, although this guideline should be considered informative and not a stringent criterion.
Primarily U.S.-based studies have found high temporal correlation between O3 levels at monitors in urban areas (e.g., median r < 0.75), with correlations declining with increasing distance between monitors.Citation45–47 These findings have been used to justify averaging over measurements from multiple monitoring sites as reasonable proxies for O3 exposure in a given area. A U.S. Environmental Protection Agency report on spatial variation of ground-level O3 concentrations in Phoenix, Arizona (United States) concluded that despite high correlations between O3 concentrations, averaging across O3 levels observed at monitors did not adequately describe pollutant patterns.Citation48 A study based in Northern Georgia suggested that spatial heterogeneity in O3 levels was masked by approaches that estimated exposure levels based on the monitoring network alone.Citation49
Consistent with other studies of O3 at the intraurban scale,Citation45,Citation46,Citation48 O3 levels in São Paulo were highly correlated for all metrics, and distance was a good predictor of magnitude of correlation.Citation41,Citation42,Citation44 A slightly higher mean correlation observed for daytime average O3 levels relative to daily average O3 levels may result from daytime sources of O3 precursors, such as automobile emissions. More than half of the COD values calculated for monitor pairs' daily and daytime averages of O3 were >0.20, providing an approximate indicator of spatial heterogeneity, and COD values were not associated with distance. This finding suggests that despite high correlation among monitors, averaging over O3 levels at multiple monitoring stations in São Paulo Municipality or the Metropolitan Region may obscure important variations in O3 levels, especially if the absolute pollutant levels are of interest.
Monitors in São Paulo Municipality were more often in high SES municipal districts concentrated in or proximate to the historical city center, raising concerns that monitor locations may over- or under-represent some types of urban environments and populations. Absence of monitors with sufficient data in noncentral areas suggests a limited ability to estimate exposure for some potentially susceptible subpopulations or communities (e.g., low-income groups) and to understand the distribution of pollutants and potential health effects in the Municipality. These findings underscore the need to consider potential biases introduced by the monitor locations. Differential ability to accurately estimate exposure may exist for some subpopulations or demographic groups, land-use types, and sources (e.g., industrial vs. roadway). The implications of the location of the monitors are especially important with a spatially heterogeneous distribution of pollutants.
Although a number of alternative methods for estimating exposure to air pollutants exist, use of data from existing monitoring networks remains popular, chiefly because of cost considerations and data availability. Methods frequently used to estimate exposure levels in epidemiological studies of air pollution and health include monitor-based approaches such as proximity-based assessments and statistical interpolation, as well as land-use regression, air quality modeling, and personal exposure monitoring.Citation32 Statistical interpolation techniques (e.g., kriging) may be more robust to spatial heterogeneity if there is a sufficiently dense monitoring network in the study area; otherwise, interpolation results may produce a smooth surface of pollutant concentrations that may not accurately represent steep gradients of pollutant levels. Similarly, land-use regression modeling may be able to capture some of the spatial variation in pollutant levels but also requires data of relatively high spatial resolution. Uncertainties associated with exposure estimates can usually be generated using these techniques. Future research could examine areas with high uncertainty in estimated exposures to determine whether they share characteristics or systematically differ in important ways from areas for which exposure estimates are characterized by lower uncertainty.
To our knowledge, this is the first study to evaluate the spatial patterns of PM10 and O3 in São Paulo, Brazil. There is a critical need for studies of intraurban variability in pollutant levels in places such as São Paulo, where air pollution levels are high, much of the urban air pollution is attributed to transport-related emissions, and nearly half of the automobile fleet is more than 10 years old and not equipped with pollution control devices.Citation17,Citation19 However, the relationships among pollutant levels observed in this study may not be applicable to other regions. Further, nonlinear relationships between CODs or correlations and distance may be present and could be explored in future work. Information on the spatial heterogeneity of pollutants is vital to inform the design of epidemiological studies and exposure estimation methods in a specific location and to interpret study results.
Appropriate interpretation of results from epidemio-logical studies examining air pollution and health effects involves consideration of study design, pollutant characteristics, underlying characteristics of (or differences between) the study area(s) and population(s) of interest, and potential biases in different data sources or exposure estimation techniques. Depending on the availability, reliability, and resolution of these types of information, studies may have limited ability to examine susceptible subpopulations or even determine to what extent errors and limitations exist. Results demonstrate the importance of considering and evaluating potential misclassification introduced by the data used to estimate exposure (e.g., monitoring networks), the choice of exposure method (e.g., averaging across monitors) and metric (e.g., daily average), and the degree of intraurban heterogeneity for the pollutant of interest. Improving characterization of spatial and temporal variability is essential to accurately assess health risks from ambient air pollution.
Supplementary Material
Download Zip (1.1 MB)REFERENCES
- WHO Children's Environmental Health, Outdoor Air Pollution http://www.who.int/ceh/risks/cehair/en/ (http://www.who.int/ceh/risks/cehair/en/) (Accessed: 2009 ).
- Bell , M.L. , Ebisu , K. and Belanger , K. 2007 . Ambient Air Pollution and Low Birth Weight in Connecticut and Massachusetts . Environ. Health Perspect. , 115 : 1118 – 1125 .
- Bell , M.L. , Peng , R.D. and Dominici , F. 2006 . The Exposure-Response Curve for Ozone and Risk of Mortality and the Adequacy of Current Ozone Regulations . Environ. Health Perspect. , 114 : 532 – 536 .
- Conceição , G.M.S. , Miraglia , S.G.E.K. , Kishi , H.S. , Saldiva , P.H.N. and Singer , J.M. 2001 . Air Pollution and Child Mortality: a Time Series Study in São Paulo, Brazil . Environ. Health Perspect. , 109 : 347 – 350 .
- Gouveia , N. and Fletcher , T. 2000 . Time Series Analysis of Air Pollution and Mortality: Effects by Cause, Age, and Socioeconomic Status . J. Epidemiol. Commun. Health , 54 : 750 – 755 .
- Bell , M.L. , O'Neill , M.S. , Ranjit , N. , Borja-Aburto , V.H. , Cifuentes , L.A. and Gouveia , N. 2008 . Vulnerability to Heat-Related Mortality in Latin America: a Case-Crossover Study in São Paulo, Brazil, Santiago, Chile, and Mexico City, Mexico . Int. J. Epidemiol. , 37 : 796 – 804 .
- de Medeiros , A.P.P. , Gouveia , N. , Machado , R.P.P. , de Souza , M.R. and Alencar , G.P. 2009 . Traffic-Related Air Pollution and Perinatal Mortality: a Case-Control Study . Environ. Health Perspect. , 117 : 127 – 132 .
- O'Neill , M.S. , Bell , M.L. , Ranjit , N. , Cifuentes , L.A. , Loomis , D. , Gouveia , N. and Borja-Aburto , V.H. 2008 . Air Pollution and Mortality in Latin America: the Role of Education . Epidemiology , 19 : 810 – 819 .
- Wilson , J.G. , Kingham , S. and Sturman , A.P. 2005 . Intraurban Variations of PM10 Air Pollution in Christchurch, New Zealand: Implications for Epidemiological Studies . Sci. Total Environ. , 367 : 559 – 572 .
- IBGE Síntese de Indicadores Sociais: uma Análise das Condiçôes de Vida da População Brasiliera http://www.ibge.gov.br/home/estatistica/populacao/condicaodevida/indicadoresminimos/sinteseindicsociais2008/indic_sociais2008.pdf (http://www.ibge.gov.br/home/estatistica/populacao/condicaodevida/indicadoresminimos/sinteseindicsociais2008/indic_sociais2008.pdf) (Accessed: 2009 ).
- Gouveia , N. , De Freitas , C.U. , Martins , L.C. and Marcilio , I.O. 2006 . Respiratory and Cardiovascular Hospitalizations Associated with Air Pollution in the City of São Paulo, Brazil . Cad. Saúde Pública , 22 : 2669 – 2677 .
- Martins , M.C.H. , Fatigati , F.L. , Vespoli , T.C. , Martins , L.C. , Pereira , L.A.A. , Martins , M.A. , Saldiva , P.H.N. and Braga , A.L.F. 2004 . Influence of Socioeconomic Conditions on Air Pollution Adverse Health Effects in Elderly People: an Analysis of Six Regions in São Paulo, Brazil . J. Epidemiol. Commun. Health , 58 : 41 – 46 .
- Miraglia , S.G.E.K. , Saldiva , P.H.N. and Bohm , G.M. 2005 . An Evaluation of Air Pollution Health Impacts and Costs in São Paulo, Brazil . Environ. Manag. , 35 : 667 – 676 .
- Gonçalves , F.L.T. , Carvalho , L.M.V. , Conde , F.C. , Latorre , M.R.D.O. , Saldiva , P.H.N. and Braga , A.L.F. 2005 . The Effects of Air Pollution and Meteorological Parameters on Respiratory Morbidity during the Summer in São Paulo City . Environ. Int. , 31 : 343 – 349 .
- Santos , U.P. , Terra-Filho , M. , Lin , C.A. , Pereira , L.A.A. , Vieira , T.C.B. , Saldiva , P.H.N. and Braga , A.L.F. 2008 . Cardiac Arrhythmia Emergency Room Visits and Environmental Air Pollution in São Paulo, Brazil . J. Epidemiol. Commun. Health , 62 : 267 – 272 .
- 2008 . Padrõ es, índices , Sao Paulo , , Brazil : Companhia de Tecnologia de Saneamento Ambiental .
- Ribeiro , H. and Cardoso , M.R. 2003 . Air Pollution and Children's Health in Sao Paulo (1986-1998) . Soc. Sci. Med. , 57 : 2013 – 2022 .
- Andrade , M.F. , Ynoue , R.Y. , Harley , R. and Miguel , A.H. 2004 . Air Quality Model Simulating Photochemical Formation of Pollutants: the Sao Paulo Metropolitan Area, Brazil . Int. J. Environ. Pollut. , 22 : 460 – 475 .
- Walsh , M.P. 2003 . “ Vehicle Emissions and Health in Developing Countries ” . In Air Pollution and Health in Rapidly Developing Countries , Edited by: McGranahan , G. and Murray , F. Earthscan : Toronto .
- The Times Atlas of the World , 9th Random House London 1994
- Castanho , A.D.A. and Artaxo , P. 2001 . Sao Paulo Aerosol Source Apportionment for Wintertime and Summertime . Atmos. Environ. , 35 : 4889 – 4902 .
- Clark , P.J. 1952 . An Extension of the Coefficient of Divergence for Use with Multiple Characters . Am. Soc. Ichthyol. Herpetol. , 1952 : 61 – 64 .
- Wongphatarakul , V. , Frielander , S.K. and Pinto , J.P. 1998 . A Comparative Study of pm2.5 Ambient Aerosol Chemical Databases . Environ. Sci. Technol. , 32 : 3926 – 3934 .
- Pinto , J.P. , Lefohn , A.S. and Shadwick , D.S. 2004 . Spatial Variability of PM2.5 in Urban Areas in the United States . Journal of the Air & Waste Management Association , 54 : 440 – 449 .
- Bell , M.L. , Ebisu , K. and Peng , R.D. 2010 . Community-Level Spatial Heterogeneity of Chemical Constituent Levels of Fine Particulate and Implications for Epidemiological Research . J. Expos. Sci. Environ. Epidemiol. , July 28 doi: 10.1038/jes.2010.24
- Krudysz , M. , Moore , K. , Geller , M. , Sioutas , C. and Froines , J. 2009 . Intra-Community Spatial Variability of Particular Matter Size Distributions in Southern California/Los Angeles . Atmos. Chem. Phys. , 9 : 1061 – 1075 .
- Pakbin , P. , Hudda , N. , Cheung , K.L. , Moore , K.F. and Sioutas , C. 2010 . Spatial and Temporal Variability of Coarse (PM10–2.5) Particulate Matter Concentrations in the Los Angeles Area . Aeros. Sci. Technol. , 44 : 514 – 525 .
- Atlas Ambiental do Municipio de São Paulo—Perfil Socioeconomico . Prefeitura da cidade de São Paulo : São Paulo , , Brazil , 2003.
- Biggs , B. , King , L. , Basu , S. and Stuckler , D. 2010 . Is Wealthier Always Healthier? The Impact of National Income Level, Inequality, and Poverty on Public Health in Latin America . Soc. Sci. Med. , 71 : 116 – 124 .
- Macintyre , S. , McKay , L. , Der , G. and Hiscock , R. 2003 . Socio-Economic Position and Health: What You Observe Depends on How You Measure It . J. Public Health Med. , 25 : 288 – 294 .
- Elbett , S. , Petkau , J. , Vedal , S. , Fisher , T. and Brauer , M. 2000 . Exposure of Chronic Obstructive Pulmonary Disease Patients to Particular Matter: Relationships Between Personal and Ambient Air Concentrations . Journal of the Air & Waste Management Association , 50 : 1081 – 1094 .
- Jerrett , M. , Arain , A. , Kanaroglou , P. , Beckerman , B. , Potogou , D. , Sahsuvaroglu , T. , Morrison , J. and Glovis , C. 2005 . A Review and Evaluation of Intraurban Air Pollution Exposure Models . J. Expos. Sci. Environ. Epidemiol. , 15 : 185 – 204 .
- Miller , K. , Siscovick , D. , Sheppard , L. , Shepherd , K. , Sullivan , J. and Anderson , G. 2007 . Long-Term Exposure to Air Pollution and Incidence of Cardiovascular Events in Women . N. Engl. J. Med. , 356 : 447 – 458 .
- Rojas-Bracho , L. , Suh , H.H. and Koutrakis , P. 2000 . Relationships among personal, indoor, and outdoor fine and coarse particle concentrations for individuals with COPD . J. Expos. Sci. Environ. Epidemiol. , 10 : 294 – 306 .
- Jerrett , M. , Burnett , R.T. , Ma , R. , Pope , C.A 3rd , Krewski , D. , Newbold , K.B. , Thurston , G. , Shi , Y. , Finkelstein , N. , Calle , E.E. and Thun , M.J. 2005 . Spatial Analysis of Air Pollution and Mortality in Los Angeles . Epidemiology , 16 : 727 – 736 .
- Nerriere , E. , Zmirou-Navier , D. , Blanchard , O. , Momas , I. , Ladner , J. , Moullec , Y.L. , Personnaz , M. , Lameloise , P. , Delmas , V. , Target , A. and Desqueyroux , P. 2005 . Can We Use Fixed Ambient Air Monitors to Estimate Population Long-Term Exposure to Air Pollutants? The Case of Spatial Variability in the Genotox ER Study . Environ. Res. , 97 : 6000 – 6006 .
- O'Neill , M.S. , Jerrett , M. , Kawachi , I. , Levy , J.I. , Cohen , A.J. , Gouveia , N. , Wilkinson , P. , Fletcher , T. , Cifuentes , L.A. and Schwartz , J. 2003 . Health, Wealth, and Air Pollution: Advancing Theory and Methods . Environ. Health Perspect. , 111 : 1861 – 1870 .
- Bell , M.L. , Samet , J.M. and Dominici , F. 2004 . Time-Series Studies of Particulate Matter . Annu. Rev. Public Health , 25 : 247 – 280 .
- Blanchard , C.L. , Carr , E.L. , Collins , J.F. , Smith , T.B. , Lehrman , D.E. and Michaels , H.M. 1999 . Spatial Representativeness and Scales of Transport during the 1995 Integrated Monitoring Study in California's San Joaquin Valley . Atmos. Environ. , 33 : 4775 – 4786 .
- Clayton , C.A. , Perritt , R.L. , Pellizzari , E.D. , Thomas , K.W. , Whitmore , R.W. , Wallace , L.A. , Ozkaynak , H. and Spengler , J.D. 1993 . Particle Total Exposure Assessment Methodology (PTEAM) Study: Distributions of Aerosol and Elemental Concentrations in Personal, Indoor, and Outdoor Air Samples in a Southern California Community . J. Expos. Sci. Environ. Epidemiol. , 3 : 227 – 250 .
- Ito , K. , Xue , N. and Thurston , G. 2004 . Spatial Variation of PM2.5 Chemical Species and Source-Apportioned Mass Concentrations in New York City . Atmos. Environ. , 38 : 5269 – 5282 .
- Escrig , A. , Monfort , E. , Celades , I. , Querol , X. , Amato , F. and Minguillnon , M. 2009 . Hopke, P. Application of Optimally Scaled Target Factor Analysis for Assessing Source Contribution of Ambient PM10 . Journal of the Air & Waste Management Association , 59 : 1296 – 1307 .
- Burton , R.M. , Suh , H.H. and Koutrakis , P. 1996 . Spatial Variation in Particulate Concentrations Within Metropolitan Philadelphia . Environ. Sci. Technol. , 30 : 400 – 407 .
- Williams , R.W. , Rea , A.W. , Vette , A.F. , Croghan , C.W. , Whitaker , D.A. and Stevens , C.D. 2009 . The design and field implementation of the Detroit Exposure and Aerosol Research Study . J. Expos. Sci. Environ. Epidemiol. , 19 : 643 – 659 .
- Kelly , N.A. , Ferman , M.A. and Wolff , G.T. 1986 . The Chemical and Meteorological Conditions Associated With High and Low Ozone Concentrations in Southeastern Michigan and Nearby Areas of Ontario . J. Air Pollut. Control Assoc. , 36 : 150 – 158 .
- Lippman , M. , Ito , K. , Nadas , A. and Burnett , R.T. 2000 . Association of Particulate Matter Components with Daily Mortality and Morbidity in Urban Populations , Boston : Health Effects Institute .
- Gibson , M. , Guernsey , J. , Beauchamp , S. , Waugh , D. , Heal , M. , Brook , J. , Maher , R. , Gagnon , G. , McPherson , J. , Bryden , B. , Gould , R. and Terashima , M. 2009 . Quantifying the Spatial and Temporal Variation of Ground-Level Ozone in the Rural Annapolis Valley, Nova Scotia, Canada, Using Nitrite-Impregnanted Passive Samplers . Journal of the Air & Waste Management Association , 59 : 310 – 320 .
- U.S. Environmental Protection Agency . 2001 . Spatial Variation in Ozone Concentrations in Phoenix, AZ for 1997 , 1 – 11 . Research Triangle Park , NC : National Center for Environmental Assessment .
- Bell , M.L. 2006 . The Use of Ambient Air Quality Modeling to Estimate Individual and Population Exposure for Human Health Research: a Case Study of Ozone in the Northern Georgia Region of the United States . Environ. Int. , 32 : 586 – 593 .