ABSTRACT
Phoenix, AZ, experiences high particulate matter (PM) episodes, especially in the wintertime. The spatial variation of the PM concentrations and resulting differences in exposure is of particular concern. In this study, PM2.5 (PM with aerodynamic diameter <2.5 μm) and PM10 (PM with aerodynamic diameter <10 μm) samples were collected simultaneously from the east and west sides of South Phoenix and at a control site in Tempe and analyzed for trace elements and bulk elemental and organic carbon. Measurements showed that although PM2.5 concentrations had similar trends in temporal scale across all sites, concentrations of PM10 did not. The difference in PM10 concentrations and fluctuation across the three sites suggest effects of a local soil source as evidenced by high concentrations of Al, Ca, and Fe in PM10. K and anthro pogenic elements (e.g., Cu, Pb, and Zn) in PM2.5 samples on January 1 were strikingly high, suggesting the influence of New Year's fireworks. Concentrations of toxic elements (e.g., Pb) in the study presented here are not different from similar studies in other U.S. cities. Application of principal component analysis indicated two broad categories of emission sources—soil and combustion—together accounting for 80 and 90% of variance, respectively, in PM2.5 and PM10. The soil and combustion components explained approximately 60 and 30% of the variance in PM10, respectively, whereas combustion sources dominated PM2.5 (>50% variance). Many elements associated with anthropogenic sources were highly enriched, with enrichment factors in PM2.5 an order of magnitude higher than in PM10 relative to surface soil composition in the study area.
This study investigates the variability of PM10 and PM2.5 mass concentrations and speciation between two sites in southern Phoenix, representative of a lower income part of the city, and a comparison site in nearby Tempe, with a higher income lower minority population. The results indicate similar temporal trends in PM2.5 concentrations and sources, although lower overall concentrations in Tempe. For PM10, the highest concentrations and a unique temporal variability at one South Phoenix site suggest a particular influence of local dust sources.
INTRODUCTION
Studies have shown a direct link between particulate matter (PM) concentrations and health effects on exposed populations in urban areas.Citation1,Citation2 Although the exact mechanisms of PM health effects are still debated, there is increasing evidence that the effects are a function of chemical components such as metals and/or organic compounds.Citation3–5 Because of their suspected toxicity, the U.S. Environmental Protection Agency (EPA) has listed 10 metals and their compounds as hazardous air pollutants.Citation6 These include As, Be, Cd, Cr, Co, Pb, Mn, Hg, Ni, and Se. Further studies have shown that transition metals associated with PM can induce damage to lung tissue via the production of reactive oxygen species.Citation7–9 In addition, elemental (EC) and organic carbon (OC) are the major components of urban PM and their major sources include fossil fuel combustion and biomass burning.Citation10,Citation11 EC, OC, and many metals originate from these combustion processes and reside in the fine particle fraction (PM2.5, particles with aerodynamic diameter <2.5 μm), which has a long atmospheric lifetime and the potential to penetrate deep inside of the human respiratory system. Chemical speciation data in PM can be useful to assess the sources of ambient PM.Citation12,Citation13 For human health considerations, it is common practice to monitor PM2.5 and PM10 (particles with aerodynamic diameter <10 μm) for regulatory purposes.
The Phoenix, AZ, metropolitan area is a rapidly growing city in the southwestern United States and frequently experiences high PM concentrations,Citation11 with past air quality monitoring indicating that parts of the Phoenix urban areas exceed PM10 standards.Citation14 PM in Phoenix originates primarily from combustion processes (vehicular emissions, biomass burning, industrial activities), resuspended desert soils and secondary particles formed in the atmosphere, and PM transported into the region.Citation11,Citation15 Concentrations of PM fluctuate widely depending on the source strength and local meteorological conditions. Wintertime PM2.5 in Phoenix is approximately 60% higher than the summertimeCitation15 because ambient air pollution levels are exacerbated because of frequent and persistent atmospheric inversion layers.Citation16 One area of particular concern is South Phoenix, which experiences high PM levels, high rates of childhood asthma, and elevated Pb levels in the blood of children.Citation17,Citation18 This region is also the home of a large minority population and a greater fraction of low-income households compared with Phoenix area averages. Consistent exposure of this population to air pollutants is therefore a concern in the area. Industrial sources in central and South Phoenix have been investigated for emissions of air toxics, including metals.Citation19 However, a lack of size-resolved and chemically classified ambient PM data has limited the assessment of health impacts and exposure scenario development. This has prompted the study presented here to characterize PM on temporal and spatial scales to assess the pollution levels and sources of chemical components, including toxic metals, in ambient PM.
The objectives of this study are (1) to characterize the spatial variability in PM2.5 and PM10 chemical components; (2) to assess the ambient concentration of toxic metals, including Pb, in South Phoenix as compared with similar measurements in other urban environments in the United States; and (3) to identify potential sources of PM2.5 and PM10 in South Phoenix. In this study, PM2.5 and PM10 have been characterized for a suite of chemical components (elements, EC, and OC) in samples collected at two locations in South Phoenix and, for a comparative purpose, in nearby Tempe. Surface soil samples were also collected from the South Phoenix study area, resus-pended, and analyzed to investigate the potential contribution of soil dust to airborne metals.
EXPERIMENTAL METHODS
Chemicals and Reagents
Two standard reference materials (SRMs)—San Joaquin Soil (SRM 2709) and Urban Dust (SRM 1649a)—were obtained from the National Institute of Standards and Technology (NIST). Chemicals purchased in trace metal analysis grade include OmniTrace grade nitric acid (HNO3; 70%), hydrochloric acid (HCl; 38%), and hydrogen fluo-ride (HF; 48%) from EMD. Multielement standards from High-Purity Standards containing 10 mg/L of 68 elements were used as calibration standards. Deionized (DI) water (>18.2 MΩ-cm) was obtained from a NANOpure ultra-pure water system (Barnstead/Thermolyne).
Sampling and Analysis
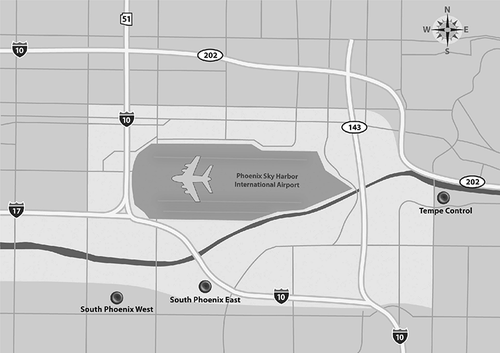
Ambient PM samples were collected at three different sites in the Phoenix, AZ, metropolitan area as shown in The South Phoenix monitoring sites (named SPE and SPW based on their locations on the east and west sides of the focus area, respectively) were established for this project and represent a mixture of urban residential and industrial areas in south-central Phoenix. Both sites are close to Phoenix Sky Harbor International Airport and there are numerous sand and gravel operations in the vicinity of the SPE site. The Tempe monitoring site (named TC) was selected to represent a control site with no nearby point sources. The sampling period is representative of a high air pollution winter season in the Phoenix metropolitan area and covers weekdays and holidays, including New Year's Eve. Fifty percent of days had a wind speed less than 1 m/sec and it was less than 2 m/sec for 75% of days over the entire sampling period with no dominance of wind from any specific direction.
Figure 1. South Phoenix study area showing the SPE, SPW, and TC sampling sites, local roadways, the Phoenix Sky Harbor International Airport, and the area surrounding the airport with predominantly industrial and commercial land uses.
PM2.5 and PM10 were collected simultaneously at all sites on 47-mm diameter Teflon membrane filters (What-man, Inc.) using two Federal Reference Method air samplers (Thermo Scientific). Additionally, two more samplers at each site collected PM2.5 and PM10 on quartz fiber filter (QFF) for analysis of the carbonaceous fraction of ambient PM. Samplers were operated for 24 hr at a flow rate of 16.7 L/min. From each site, pairs of PM2.5 and PM10 samples were collected on 9 sampling days from December 20, 2008 to February 18, 2009. In addition, soil samples (n = 9) were collected from the top 1.5 cm of exposed dirt surfaces in vacant lots and near parking lots, residences, and schools in the area between the SPE and SPW sampling sites. The soil samples were resuspended, and size-segregated PM2.5 and PM10 were analyzed for elemental composition in a manner analogous to the ambient PM samples.
Filter digestion and preparation for elemental analysis are similar to methods reported for the digestion of QFFs,Citation20 except that smaller acid volumes have been used. Briefly, the PM samples were digested in a mixture of 4 mL HNO3, 0.9 mL HCl, and 0.1 mL HF using a temperature-programmable microwave oven with the following temperature program: 6-min ramp to 140 °C and held for 2 min, temperature increased to 165 °C in 5 min and held for 6 min, and temperature increased to 180 °C and held for 15 min. Before digestion, the polypropylene support ring from the filter was removed using a ceramic blade and placed in 22-mL precleaned Teflon bombs, reagents added, and placed in the microwave oven to achieve the complete digestion of particles. In each digestion batch, two SRMs (SRMs 2709 and 1649a), a reagent blank, and a filter blank were subject to digestion for quality control. After digestion, solutions were transferred to 25-mL volumetric flasks and DI water was added to 25 mL. The solution was then transferred to a 25-mL polypropylene bottle, capped, and stored until analysis.
Samples were analyzed by a double-focusing magnetic sector inductively coupled plasma–mass spectrometer (ICP-MS, ThermoFinnigan ELEMENT2). Details of instrument settings and analytical parameters (resolutions, calibration, instrument detection limits) can be found elsewhere.Citation20 NIST SRM 1640 (river water) was analyzed after each 12 samples to monitor drift in instrument response. Propagated analytical uncertainties for elements were determined from the square root of the square of the standard deviation (SD) for filter blanks (n = 4) and the square of SD of ambient samples. SD for each sample was the average of the nine scans per element by ICP-MS. All reported ambient concentrations are blank-corrected.
OC and EC were analyzed using a thermal optical transmittance method (Sunset Laboratory, Inc.).Citation21 OC was analyzed with varying time steps between 60 and 200 sec during OC evolution at 310, 475, 615, and 870 °C in an inert atmosphere. This was followed by the EC analysis with temperature profiles of 550, 625, 700, 775, and 850 °C with a hold-up time of 45 sec and a final hold-up at 875 °C for 120 sec in an oxidizing atmosphere. For OC and EC, the average analytical uncertainty was calculated from the instrumental analytical uncertainty for each sample.
Statistical Analysis of Data
Principal component analysis (PCA), a widely used statistical tool,Citation22–24 was used to identify the sources of environ mental pollutants. In this approach, a large dataset is reduced to a smaller number of independent components. The variables that are closely related via the factor loadings (or correlation coefficients) are interpreted as the principal components (PCs). A varimax rotation of the factor loadings is usually performed to maximize the correlation coefficients near 0 or 1 while keeping the variance and the communality explained by the unaffected components.Citation25 The PCs containing tracer chemical components with high correlation coefficients can then be interpreted as sources of pollutants. Varimax rotated PCA was performed using a statistical package SPSS (version 15). PCs with eigenvalues greater than 1 were retained.
In addition, enrichment factor (EF) analysis, a simple tool commonly used to distinguish elements of anthropogenic origins from those of natural sources, was performed using the following equationCitation26:
RESULTS AND DISCUSSION
Ambient Concentrations
Ambient concentrations of PM2.5 and PM10 and their chemical components along with their analytical uncertainties are presented in and , respectively. Average concentrations of PM2.5 and chemical composition at SPE and SPW were similar (). Average PM2.5 and PM10 concentrations at TC were respectively 70 ± 18% and 65 ± 25% of those at the South Phoenix sites.PM10 concentrations were highest at SPE (), with the dominant chemical species including OC and EC, followed by soil elements (Al, Fe, K, and Ca), with a minor fraction contributed by other elements. OC, EC, and elements together comprised 55 ± 9% and 37 ± 5% of PM2.5 and PM10 mass, respectively, with the remaining fraction largely due to ions (sulfate, nitrates, and ammonium), oxides of soil elements, and unknown components. The larger fraction of mass unaccounted for in PM10 than in PM2.5 likely suggests the dominance of oxides of soil elements in the coarse (PM10-PM2.5) fraction of PM. The elevated concentrations of crustal elements in ambient PM10 samples are consistent with the soil elements in the study area (see Table S1 in the supplementary information published at http://secure.awma.org/onlinelibrary/samples/10.3155-1047-3289.61.3.302_supplmaterial.pdf). The reported 18 elements comprised approximately 16% of the soil mass in which five elements (Al, Ca, Fe, K, and Mn) contributed approximately 99% of the total elemental mass.
Table 1. Summary of mean (±uncertainty), minimum, and maximum concentrations (ng/mCitation3) of PM2.5 and its chemical components
Table 2. Summary of mean (±uncertainty), minimum, and maximum concentrations (ng/m3) of PM10 and its chemical components
Two distinct features were observed for the temporal and spatial variability in PM2.5 and PM10 concentrations (). First, the variability in PM2.5 was small across all sites with all PM2.5 concentrations following a common trend. Second, PM10 concentrations were more variable, with SPE concentration trends not following those at the SPW and TC sites. High PM10 events at SPE are likely influenced by local sources and may be the result of wind-blown soil from the sand and gravel operations southeast of the sampling site. This is supported by the high concentrations of soil elements (Al, Ca, and Fe) in PM10 at SPE, which are approximately 2 times higher than at SPW (). Temporal changes in concentrations of selected species in PM2.5 across three sites are shown in Fe, K, and Ba were chosen to represent crustal resuspension whereas Cu was chosen as representative of anthropogenic sources. Interestingly, many of the chemical components (e.g., OC, EC, Rb, Sb, Pb, Cu, Zn, Sr, K, As, and Se) in PM2.5 followed a regional trend at all sites and peaked on January 1.
Figure 2. Temporal change in (a) PM2.5 and (b) PM10 concentrations at three sampling sites.
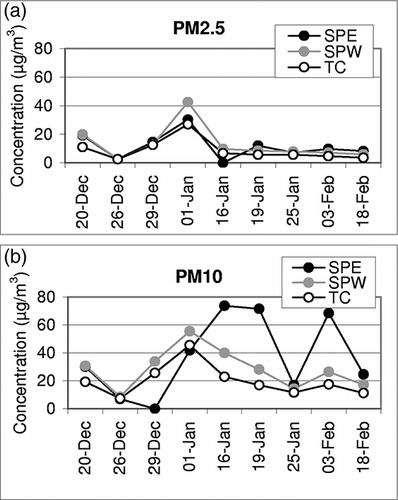
Figure 3. Temporal changes in Fe, K, Ba, and Cu in PM2.5 at (a) SPE, (b) SPW, and (c) TC. Error bars represent analytical uncertainty measured as the percent relative SD of elements.
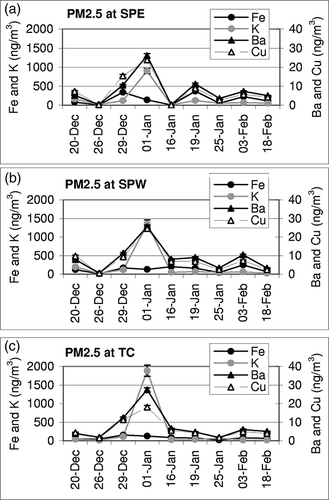
Firework explosives contain compounds of metals (e.g., Ba, Sr, Cu, Na, and K) along with oxidizers (compounds of Mn and Fe).Citation27,Citation28 Elevated concentrations of many of these elemental components as well as PM2.5 concentrations are considered to be directly related to New Year's fireworks celebrations. PM2.5 concentration on January 1 is strikingly high and departs the trend set by crustal elements. In PM10, no such departure is observed. Although K is an abundant element of local soils (supplementary Table S1), it covaries with other combustion elements on that particular day. Estimated K in PM2.5 from biomass burning calculated according to the Inter-agency Monitoring for Protected Visual Environments (IMPROVE) method (non-soil K = K – 0.6 × Fe)Citation29 in creased from tens to several hundred (800–2250) nano-grams per cubic meter (ng/m3) on that particular day, with the highest impact at TC. Soil elements (e.g., Fe) were not affected by firework activities (). Overall, concentrations of crustal elements (e.g., Al, Ti, Mn, Fe, and Ca) are in the order of SPE > SPW > TC for PM2.5 and PM10. The high variability in PM10 concentrations, especially as seen at SPE, is likely due to localized effects of industrial activity (sand and gravel operations), which does not impact PM2.5 concentrations at this site.
Trace Metal Concentrations Compared with Literature
Concentrations of Pb, Cr, Fe, Cu, and Zn in PM2.5 were compared with similar studies in other U.S. cities. These elements were selected for the purpose of illustration on the basis of their association with known emission sources and their link to human health impacts. Although Pb levels in PM2.5 as high as 22.9 ng/m3 were measured at SPE, the average concentration of Pb across three sites (5 ± 6.4 ng/m3) was similar to that measured at a parking garage at Tempe, AZ.Citation30 Fe and Cu at the garage were 2 and 1 order of magnitude higher than mean levels in this study.Citation30 However, their concentrations in the study presented here are at similar levels as reported in previous Phoenix PM studiesCitation11,Citation31 or California and New York aerosol studies.Citation32,Citation33 Concentrations of toxic metals such as Pb (reference concentration of 1.5 μg/m3) are below EPA guideline valuesCitation6 and are present at elevated concentrations only occasionally. Results suggest that the elemental components of PM in this study are similar to or less than other studies in the U.S. urban areas.
PM2.5/PM10 Ratio
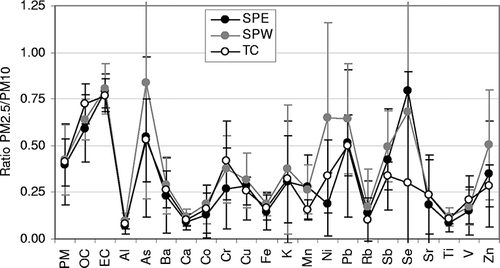
To examine the variation of PM composition as a function of particle size, the PM2.5/PM10 ratio for different components was calculated (). The ratios were similar for PM mass and its major chemical components (e.g., OC, EC, Al, Ca, and Fe) across all three sites, indicating their common sources that differ only in emission strength (e.g., higher overall concentrations at SPE and SPW compared with TC as discussed earlier). However, a higher PM2.5/PM10 ratio for OC at TC (ratio 0.72) than for the South Phoenix sites (average ratio 0.61) suggests some soil contribution to OC at the SPE and SPW sites. In previous studies,Citation34,Citation35 a substantial fraction of OC has been reported in the coarse fraction of particles, and these results were similar as the fraction for crustal materials. Very low PM2.5/PM10 ratios for Al, Ca, Fe, and Ti indicate their dominance in the coarse particles. Variable PM2.5/PM10 ratios for elements such as As, Cr, K, Ni, Pb, Se, and Zn are more likely because of the episodic event on January 1. Certain elements (e.g., As, Ni, Pb, and Zn) at SPW appear dominant in PM2.5, indicating close proximity or higher influence of nonferrous metallurgical operations at this site. High variability in the PM2.5/PM10 ratios of As and Se is associated with the relatively high analytical uncertainties for these elements, most likely because of concentrations close to their detection limits (see supporting information, Table S2).
Figure 4. Ratio of PM2.5 to PM10 components. Error bars represent 1 SD of measurements.
Relationship between Wind and PM Concentrations
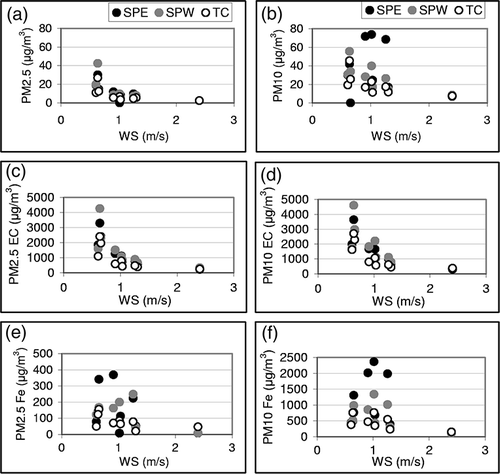
The impact of wind speed (WS) on ambient PM concentrations was investigated. Twenty-four-hour average WS for the sampling days was plotted against PM mass, EC, and Fe (). It is seen that PM2.5 and EC concentrations are correlated at all sites and their higher concentrations corresponded to calm wind conditions. Similar behavior of EC between PM2.5 and PM10 against WS was as expected because EC is predominately of combustion origin and associated with PM2.5. However, PM10 and crustal components (e.g., Fe) were more variable, without any distinct trend. It is to be noted that anthropogenic elements are associated with PM2.5 and are more homo geneously distributed on a local scale. PM sampling at shorter time intervals and sampling that covers different seasons would be required to gain more insights on the temporal and spatial variation of elemental concentrations and their association with wind entrainment.
Figure 5. Association of (a) PM2.5, (b) PM10, (c) PM2.5 EC, (d) PM10 EC, (e) PM2.5 Fe, and (f) PM10 Fe with WS at the three sampling sites.
PCA
OC, EC, and elemental data (18 elements) were analyzed by PCA. At all sites, three to four PCs in PM2.5 and two PCs in PM10 were required to explain approximately 90% of the data variance. Two major components in PCA were interpreted to represent combustion sources and soil sources, accounting for 80% of the variance at all sites. Typical results of crustal versus combustion-related chemical components in SPW samples are shown in This figure shows two major clusters, a first one with OC, EC, and the elements Sb, Ba, Cu, Zn, Pb, As, and Se and a second one with crustal elements (Al, Ti, Mn, Fe, Ca). The two PCs representing combustion and soil sources in PM2.5 at SPW explain approximately 55 and 25% of variance. Also seen in is a small cluster of Ni, V, and Cr although they have smaller correlation coefficients.
Figure 6. PC1 vs. PC2 for (a) PM2.5 and (b) PM10 components at SPW.
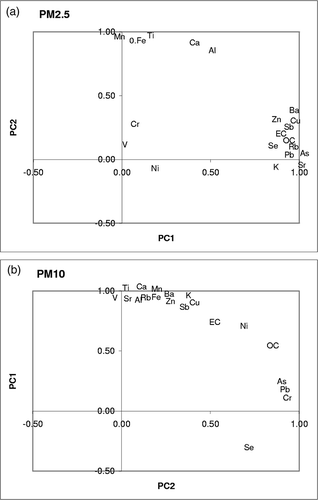
Elevated levels of Fe, Cu, and Zn have been observed in PM2.5 in a parking garage in Tempe, AZ,Citation30 and tire wear and break abrasion are major sources of elevated Zn and Cu, respectively, in PM samples close to road sides.Citation24,Citation32 Thus, this factor combined with OC and EC can be broadly identified as an anthropogenic source. In previous studies,Citation10,Citation11 a factor associated with Cu, Zn, As, and Pb in PM2.5 samples in Phoenix has been attributed to nonferrous smelting processes in southeastern Arizona. Some of these elements (e.g., Pb, As, and Se) also originate from stationary fuel (e.g., coal or scrap wood) combustion.Citation36,Citation37These trace elements may be co-emitted from metallurgical processes that use biomass/coal as fuels. In the case of the study presented here, it is unlikely that distant smelting operations would be responsible for the Pb/As/Se factor in the greater part of Phoenix PM2.5. The authors instead suggest that mobile sources are stronger contributors to this factor in Phoenix because of the association of these elements with Cu and Zn that are enriched in traffic-induced PM2.5 samples.Citation30
In PM10, two PCs explain approximately 90% of variance with the groupings of chemical components as shown in The soil elements are grouped with some combustion elements such as Cu and Zn. This component is thus a mixture of soil and vehicular activities that accounted for 67% of the observed variance compared with 25% variance by the same component in PM2.5. This is consistent with greater influence of crustal components on PM10 concentrations. PC2 contained Sb, Pb, Cr, Cu, and As, which are typically associated with combustion processes.
EF Analysis
EF analysis was conducted to differentiate soil resuspension from other influences. EFs were calculated for elements in ambient samples relative to average elemental compositions of resuspended soil samples from the study area. Calculated EFs for PM2.5 and PM10 elements are shown in Because of a natural variation in trace composition of surface soil samples, there are some inherent uncertainties in the calculated EFs. The authors have thus considered that the elements with EF on the order of 1 are nonenriched, those with EF above 1 and less than 10 are moderately enriched, and those with EF more than 10 are enriched.
Figure 7. EFs for elements in ambient samples. EFs were calculated with reference to average composition of suspended soil samples at South Phoenix study area.
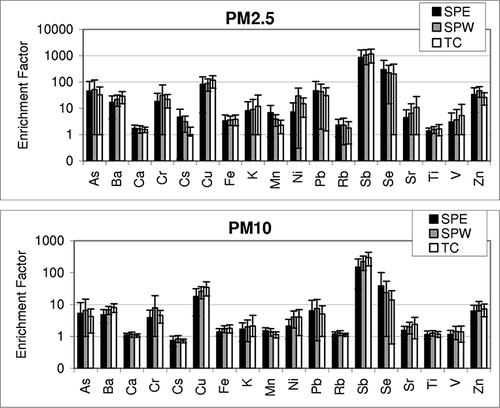
As shown in , elements such as As, Ba, Cr, Cu, K, Ni, Pb, Sb, Se, Sr, and Zn are enriched in atmospheric samples to a varying extent. These elements have higher EFs in PM2.5 than PM10, with some elements (e.g., As, Cu, K, Pb, Sb, and Se) enriched by an order of magnitude higher in PM2.5 than in PM10. This suggests the greater influence of combustion sources to atmospheric PM2.5 components. To recall, for example, Sb, Ba, Pb, Cu, Zn, K, As, and Se correspond to PC1 at SPW PM2.5, whereas elements with low EFs are the same soil elements that fall in PC2. Although a soil source represents the major components of Phoenix PM, weaker EFs for elements in PM10 than in PM2.5 suggest that the surface soil is not the major contributor of toxic/trace elements to ambient PM2.5.
CONCLUSIONS
Ambient PM2.5 and PM10 samples collected from two urban sites in South Phoenix and a control site at Tempe, AZ, were analyzed for their chemical components. Representative soil samples were also collected from the study area, resuspended, collected as PM2.5 and PM10, and analyzed. Ambient PM mass concentrations showed that the urban sites (SPE and SPW) experience approximately 30% higher PM concentrations than the control (TC) site. The higher concentrations at the South Phoenix sites are consistent with more local soil sources (wind-blown and resus-pended vehicle dust). High variability in PM10 concentrations as observed at SPE are site specific and show elevated concentrations of typical soil components (e.g., Al, Ca, and Fe). PM2.5 concentrations are found to be less variable across three sites, with high concentrations of particle mass and certain elements (e.g., K, Pb, Ba, Cu, and Zn) on January 1. Because pyrotechnic materials have been reported to contain these elements, their peak concentrations in PM2.5 across all sites suggested the influence of New Year's fire-works activities. Levels of toxic elements, including Pb, are not substantially different from observations in other U.S. cities and are below EPA guidelines.
PCA of PM chemical constituents identified two dominant components at all sites, accounting for 80 and 90% of variance in PM2.5 and PM10, respectively. The dominance of OC, EC, and K in PM2.5 was an indicative of combustion sources (including fireworks), accounting for more than 50% of the total variance in PM2.5, whereas the soil component alone explained approximately 60% of the total variance in PM10. Relative to surface soil composition in Phoenix, many elements are highly enriched, with higher EFs in PM2.5 than in PM10. This suggests that despite soil being the major source of atmospheric PM in Phoenix, surface soil is not the major contributor of toxic/trace elements to ambient PM2.5.
Supplementary Material
Download Zip (6 KB)ACKNOWLEDGMENTS
The authors thank the Arizona Department of Environmental Quality (ADEQ) for the funding of the project and collecting samples. The statements and conclusions in this paper are those of the contractor and not necessarily those of ADEQ or its policy committee, its employees, or its members. The mention of commercial products, their source, or their use in connection with material reported herein is not to be construed as actual or implied endorsement of such products. The authors thank Panjai Prapaipong at Arizona State University for her assistance with ICP-MS analysis.
REFERENCES
- Dockery , D.W. , Pope , C.A. , Xu , X.P. , Spengler , J.D. , Ware , J.H. , Fay , M.E. , Ferris , B.G. and Speizer , F.E. 1993 . An Association between Air-Pollution and Mortality in 6 United-States Cities . N. Engl. J. Med. , 329 : 1753 – 1759 .
- Samet , J.M. , Dominici , F. , Curriero , F.C. , Coursac , I. and Zeger , S.L. 2000 . Fine Particulate Air Pollution and Mortality in 20 US Cities, 1987–1994 . N. Engl. J. Med. , 343 : 1742 – 1749 .
- Harrison , R.M. and Yin , J.X. 2000 . Particulate Matter in the Atmosphere: Which Particle Properties Are Important for Its Effects on Health? . Sci. Total Environ. , 249 : 85 – 101 .
- Florea , A.M. and Busselberg , D. 2006 . Occurrence, Use and Potential Toxic Effects of Metals and Metal Compounds . Biometals , 19 : 419 – 427 .
- Manalis , N. , Grivas , G. , Protonotarios , V. , Moutsatsou , A. , Samara , C. and Chaloulakou , A. 2005 . Toxic Metal Content of Particulate Matter (PM10), within the Greater Area of Athens . Chemosphere , 60 : 557 – 566 .
- Health Effects Notebook for Hazardous Air Pollutants; U.S. Environmental Protection Agency http://www.epa.gov/ttn/atw/hlthef/hapindex.html (http://www.epa.gov/ttn/atw/hlthef/hapindex.html) (Accessed: 20 August 2010 ).
- Chapman , R.S. , Watkinson , W.P. , Dreher , K.L. and Costa , D.L. 1997 . Ambient Particulate Matter and Respiratory and Cardiovascular Illness in Adults: Particle-Borne Transition Metals and the Heart-Lung Axis . Environ. Toxicol. Pharmacol. , 4 : 331 – 338 .
- Karlsson , H.L. , Nilsson , L. and Moller , L. 2005 . Subway Particles are More Genotoxic than Street Particles and Induce Oxidative Stress in Cultured Human Lung Cells . Chem. Res. Toxicol. , 18 : 19 – 23 .
- Prahalad , A.K. , Soukup , J.M. , Inmon , J. , Willis , R. , Ghio , A.J. , Becker , S. and Gallagher , J.E. 1999 . Ambient Air Particles: Effects on Cellular Oxidant Radical Generation in Relation to Particulate Elemental Chemistry . Toxicol. Appl. Pharmacol. , 158 : 81 – 91 .
- Ramadan , Z. , Song , X.H. and Hopke , P.K. 2000 . Identification of Sources of Phoenix Aerosol by Positive Matrix Factorization . Journal of the Air & Waste Management Association , 50 : 1308 – 1320 .
- Brown , S.G. , Frankel , A. , Raffuse , S.M. , Roberts , P.T. , Hafner , H.R. and Anderson , D.J. 2007 . Source Apportionment of Fine Particulate Matter in Phoenix, AZ, Using Positive Matrix Factorization . Journal of the Air & Waste Management Association , 57 : 741 – 752 . doi: 10.3155/1047-3289.57.6.741
- Baumann , K. , Jayanty , R.K.M. and Flanagan , J.B. 2008 . Fine Particulate Matter Source Apportionment for the Chemical Speciation Trends Network Site at Birmingham, Alabama, Using Positive Matrix Factorization . Journal of the Air & Waste Management Association , 58 : 27 – 44 . doi: 10.3155/1047-3289.58.1.27
- Zhou , L. , Hopke , P.K. and Zhao , W.X. 2009 . Source Apportionment of Airborne Particulate Matter for the Speciation Trends Network Site in Cleveland, OH . Journal of the Air & Waste Management Association , 59 : 321 – 331 . doi: 10.3155/1047-3289.59.3.321
- Maricopa County, AZ 24-Hour PM10; Review of Exceptional Event Request, May 12, 2010; U.S. Environmental Protection Agency http://www.epa.gov/region9/air/phoenixpm/index.html (http://www.epa.gov/region9/air/phoenixpm/index.html) (Accessed: 20 August 2010 ).
- Lewis , C.W. , Norris , G.A. , Conner , T.L. and Henry , R.C. 2003 . Source Apportionment of Phoenix PM2.5 Aerosol with the Unmix Receptor Model . Journal of the Air & Waste Management Association , 53 : 325 – 338 .
- Ellis , A.W. , Brommer , D.M. and Balling , R.C. 2006 . Climatic Conditions Linked to High PM10 Concentration in a Bi-National Airshed: Nogales (Arizona, USA, and Sonora, Mexico) . Climate Res. , 30 : 113 – 124 .
- 2007 . Arizona's Childhood Lead Poisoning Targeted Screening Plan , Phoenix , AZ : Arizona Department of Health Services .
- 2005 . Arizona Comprehensive Asthma Control Plan , Phoenix , AZ : Arizona Department of Health Services .
- Bolin , B. , Matranga , E. , Hackett , E.J. , Sadalla , E.K. , David Pijawka , K. , Brewer , D. and Sicotte , D. 2000 . Environmental Equity in a Sunbelt City: The Spatial Distribution of Toxic Hazards in Phoenix, Arizona . Global Environ. Change B , 2 : 11 – 24 .
- Upadhyay , N. , Majestic , B.J. , Prapaipong , P. and Herckes , P. 2009 . Evaluation of Polyurethane Foam, Polypropylene, Quartz Fiber, and Cellulose Substrates for Multi-Element Analysis of Atmospheric Particulate Matter by ICP-MS . Anal. Bioanal. Chem. , 394 : 255 – 266 .
- Bae , M.S. , Schauer , J.J. , DeMinter , J.T. , Turner , J.R. , Smith , D. and Cary , R.A. 2004 . Validation of a Semi-Continuous Instrument for Elemental Carbon and Organic Carbon Using a Thermal-Optical Method . Atmos. Environ. , 38 : 2885 – 2893 .
- Hopke , P.K. 1991 . An Introduction to Receptor Modeling . Chemomet. Intell. Lab. Syst. , 10 : 21 – 43 .
- Watson , J.G. and Chow , J.C. 2001 . Source Characterization of Major Emission Sources in the Imperial and Mexicali Valleys along the US/Mexico Border . Sci. Total Environ. , 276 : 33 – 47 .
- Lin , C.C. , Chen , S.J. , Huang , K.L. , Hwang , W.I. , Chang-Chien , G.P. and Lin , W.Y. 2005 . Characteristics of Metals in Nano/Ultrafine/Fine/Coarse Particles Collected beside a Heavily Trafficked Road . Environ. Sci. Technol. , 39 : 8113 – 8122 .
- Henry , R.C. , Lewis , C.W. , Hopke , P.K. and Williamson , H.J. 1984 . Review of Receptor Model Fundamentals . Atmos. Environ. , 18 : 1507 – 1515 .
- Dodd , J.A. , Ondov , J.M. , Tuncel , G. , Dzubay , T.G. and Stevens , R.K. 1991 . Multimodal Size Spectra of Submicrometer Particles Bearing Various Elements in Rural Air . Environ. Sci. Technol. , 25 : 890 – 903 .
- Steinhauser , G. , Sterba , J.H. , Foster , M. , Grass , F. and Bichler , M. 2008 . Heavy Metals from Pyrotechnics in New Years Eve Snow . Atmos. Environ. , 42 : 8616 – 8622 .
- Vecchi , R. , Bernardoni , V. , Cricchio , D. , d'Alessandro , A. , Fermo , P. , Lucarelli , F. , Nava , S. , Plazzalunga , A. and Valli , G. 2008 . The Impact of Fireworks on Airborne Particles . Atmos. Environ. , 42 : 1121 – 1132 .
- Sisler , J.F. 1996 . Spatial and Seasonal Patterns and Long-Term Variability of the Composition of the Haze in the United States: An Analysis of Data from the IMPROVE Network , Fort Collins , CO : Cooperative Institute of Research in the Atmosphere .
- Majestic , B.J. , Anbar , A.D. and Herckes , P. 2009 . Elemental and Iron Isotopic Composition of Aerosols Collected in a Parking Structure . Sci. Total Environ. , 407 : 5104 – 5109 .
- Majestic , B.J. , Anbar , A.D. and Herckes , P. 2009 . Stable Isotopes as a Tool to Apportion Atmospheric Iron . Environ. Sci. Technol. , 43 : 4327 – 4333 .
- Singh , M. , Jaques , P.A. and Sioutas , C. 2002 . Size Distribution and Diurnal Characteristics of Particle-Bound Metals in Source and Receptor Sites of the Los Angeles Basin . Atmos. Environ. , 36 : 1675 – 1689 .
- Qureshi , S. , Dutkiewicz , V.A. , Khan , A.R. , Swami , K. , Yang , K.X. , Husain , L. , Schwab , J.J. and Demerjian , K.L. 2006 . Elemental Composition of PM2.5 Aerosols in Queens, New York: Solubility and Temporal Trends . Atmos. Environ. , 40 : S238 – S251 .
- Malm , W.C. and Day , D.E. 2000 . Optical Properties of Aerosols at Grand Canyon National Park . Atmos. Environ. , 34 : 3373 – 3391 .
- Malm , W.C. and Hand , J.L. 2007 . An Examination of the Physical and Optical Properties of Aerosols Collected in the IMPROVE Program . Atmos. Environ. , 41 : 3407 – 3427 .
- Utsunomiya , S. , Jensen , K.A. , Keeler , G.J. and Ewing , R.C. 2004 . Direct Identification of Trace Metals in Fine and Ultrafine Particles in the Detroit Urban Atmosphere . Environ. Sci. Technol. , 38 : 2289 – 2297 .
- Maykut , N.N. , Lewtas , J. , Kim , E. and Larson , T.V. 2003 . Source Apportionment of PM2.5 at an Urban IMPROVE Site in Seattle, Washington . Environ. Sci. Technol. , 37 : 5135 – 5142 .