ABSTRACT
Epidemiological studies of exposure to vegetation fire smoke are often limited by the availability of accurate exposure data. This paper describes a systematic framework for retrospectively identifying the cause of air pollution events to facilitate a long, multicenter analysis of the public health effects of vegetation fire smoke pollution in Australia. Pollution events were statistically defined as any day at or above the 95th percentile of the 24-hr average concentration of particulate matter (PM). These were identified for six cities from three distinct ecoclimatic regions of Australia. The dates of each event were then crosschecked against a range of information sources, including online newspaper archives, government and research agency records, satellite imagery, and aerosol optical thickness measures to identify the cause for the excess particulate pollution. Pollution events occurred most frequently during summer for cities in sub-tropical and arid regions and during winter for cities in temperate regions. A cause for high PM on 67% of days examined in the city of Sydney was found, and 94% of these could be attributed to landscape fire smoke. Results were similar for cities in other subtropical and arid locations. Identification of the cause of pollution events was much lower in colder temperate regions where fire activity is less frequent. Bushfires were the most frequent cause of extreme pollution events in cities located in subtropical and arid regions of Australia. Although identification of pollution episodes was greatly improved by the use of multiple sources of information, satellite imagery was the most useful tool for identifying bushfire smoke pollution events.
Landscape fire smoke is an episodic and increasingly important environmental hazard for human populations. However, the health effects attributable to landscape fire smoke remain uncertain, partially because of the challenges associated with exposure assessment. This paper describes a systematic framework for retrospectively identifying the cause of air pollution events to facilitate a long, multicenter analysis of the public health effects of vegetation fire smoke pollution in Australia.
INTRODUCTION
It is difficult to assess the potential health effects of smoke from large vegetation fires, primarily because it is challenging to assess the exposure of affected populations. The episodic nature of large events makes it impossible to know precisely when and where air quality will be affected, and exposures are often difficult to quantify retrospectively. In many cases smoke from large fires affects (1) rural areas where there are few or no air quality monitoring data to inform quantitative exposure assessment, (2) populations that are too small to support meaningful epidemiological study, or (3) large populations for durations that are too short to detect a significant effect.Citation1
Despite these challenges, a growing body of literature has consistently reported that particulate matter (PM) during episodes of vegetation fire smoke is associated with respiratory morbidity, especially related to adult asthma and chronic obstructive pulmonary disease.Citation2–19 This association is now well accepted.Citation20,Citation21 However, the effect of PM from fire smoke on other health outcomes such as cardiovascular morbidity and mortality is uncertain. Only oneCitation22 of a few studiesCitation2,Citation23,Citation24 reports that smoke-related PM is associated with mortality, and none have reported any consistent cardiovascular effect.Citation2,Citation6,Citation9,Citation10,Citation14–16 The latter is surprising given the weight of evidence suggesting that smoke particles elicit toxicological effects similar to those of urban particlesCitation25–27 and that urban PM has been causally linked with respiratory and cardiovascular morbidity and mortality.Citation21 One possible explanation is that the PM in vegetation fire smoke is different enough from urban PM that it carries a different public health risk. The other possible explanation is that most studies to date have been too small to detect mortality and cardiovascular effects.Citation1,Citation20
Previous researchers in this area have used a creative range of study designs and analytical approaches. Over time they have included larger study groups, covered longer periods, and developed increasingly sophisticated approaches to data analysis and exposure assessment. The authors feel that a practical way to move forward in the identification of health effects associated with vegetation smoke is to increase the size and duration of studies by collecting data from multiple centers and reaching deep into the historical records of areas habitually affected by this pollutant. Several major urban centers and smaller regional towns in the Australian states of New South Wales, Western Australia, and Tasmania are intermittently affected by extreme episodes of vegetation fire smoke. The authors are currently pooling hospital admissions and mortality data from 1994 through 2007 for these locations and linking them to historical evidence of large fire events and PM monitoring data to quantify the pollution-related health effects of these events.
This paper presents approaches the authors have developed to identify historical spikes in PM concentrations and to evaluate whether they were caused by vegetation fire smoke or by other possible sources (i.e., dust storms or industrial fires). These methods provide a systematic framework for retrospective identification of the air quality impacts of biomass smoke in a region that is seasonally affected by fires. This approach anticipates increasing impacts on air quality if the frequency and severity of bush-fires continues to increase as predicted by the Intergovernmental Panel on Climate Change.Citation28 This framework could be useful for other epidemiologists working in similar fire-prone environments to contribute to building a useful database for improving the understanding of the public health effects of vegetation fire smoke.
METHODS
Atmospheric PM concentrations measured in six cities from the following three distinct ecoclimatic regions of Australia were studied:
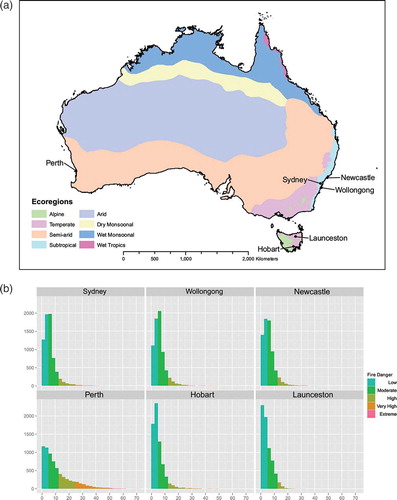
| 1. | Central New South Wales—a subtropical region with a fire-prone sclerophyll landscape composed of eucalypt forest and smaller patches of headlands (Sydney, Newcastle. and Wollongong). Hot summers, mild winters, and year-round precipitation characterize the climate of this region. These cities experience fire danger in the high, very high, or extreme categories on 7.1% of days. | ||||
| 2. | The Southwest—a region with a semi-arid to Mediterranean climate characterized by long hot summers, mild winters, and limited precipitation during the summer (Perth). Vegetation ranges from closed eucalypt forest to extensive heathland. Perth experiences fire danger in the high, very high, or extreme categories on 33.1% of days. | ||||
| 3. | Tasmania is an island with a temperate climate where vegetation growth is limited in the winter months because of low temperatures, but summers are mild and wet (Hobart and Launceston). This region features areas of tall, closed eucalypt forests carrying high fuel loads. These cities experience fire danger in the high, very high, or extreme categories on 5% of days. | ||||
All cities are shown in .
Figure 1. (a) Map of Australia's ecoclimatic regions (based on Hutchinson et al.Citation41) showing the location of the six cities in the study. (b) Distribution of McArthur Forest Fire Danger Index MK5 fire danger days calculated from daily meteorological records obtained from the Australian Bureau of Meteorology for each city for the period 1990–2008.
For each location, up to 13 yr (between 1994 and 2007) of daily air quality data measured as PM less than 10 μm (PM10) or less than 2.5 μm (PM2.5) in aerodynamic diameter were examined. Air pollution data were provided by government agencies in the states of Western Australia, New South Wales, and Tasmania. Daily averages for each site were calculated excluding days with less than 75% of hourly measurements. In Sydney and Perth, where data were collected from several monitoring stations, the missing daily site-specific PM10 and PM2.5 concentrations were imputed using available data from other proximate monitoring sites in the network. The daily city-wide PM10 and PM2.5 concentrations were then estimated following the protocol of the Air Pollution and Health: a European Approach studies.Citation29 For each city, all days in which PM10 or PM2.5 exceeded the 95th percentile were identified over the entire time series. These extreme values were termed “events.” A range of sources was examined to identify the cause of particulate air pollution events, including electronic news archives, Internet searches for other reports, government and research agencies, and satellite imagery. Also examined were remotely sensed aerosol optical thickness (AOT) data to provide further information about days for which the other methods yielded uncertain or conflicting results.
Electronic News Archives
Media searches included the Google News Archive, High-Beam, and Australia-specific reports from News Limited and the Australian Broadcasting Corporation. The following protocol was used:
| 1. | The search dates were defined as the day before event until 2 days after the event. | ||||
| 2. | Search terms were included to identify each date, location, and potential event types. For example, for events in Sydney, the terms “Sydney,” “New South Wales,” and “NSW” were included. For event type, the terms “bushfire,” “fire,” “burning,” “smoke,” “haze,” “air pollution,” “particulate,” “smog,” and “dust” were included. | ||||
| 3. | The URL of relevant articles was documented and the reports were electronically archived. | ||||
An example of a retrieved news report is reproduced in .
Figure 2. An example of a retrieved news report.
Internet Search for Other Reports
The same dates and search terms were also used in a standard Google search to find reports from official bodies such as government departments, weather, or fire services. These were also archived.
Land Management and Research Agencies
The government agencies responsible for land management and bushfire/dust research in each jurisdiction were contacted directly and asked to provide information from their internal records. A list of event dates for each PM type was sent to their representatives with a request to identify whether the following types of pollution had been recorded on those dates: (1) bushfire (2) prescribed burn, (3) woodsmoke from domestic wood heater use, and (4) other (including salt and dust). All correspondence was retained in the project archives. Information was provided by the Western Australian Department of Environment and Conservation, the New South Wales Department of Environment, the University of Wollongong Centre for Environmental Risk Management of Bushfires,Citation30 and the Griffith University Dustwatch Project.Citation15,Citation16
Moderate Resolution Imaging Spectroradiometer Satellite Imagery
The Moderate Resolution Imaging Spectroradiometer (MODIS) instruments aboard the National Aeronautics and Space Administration's Aqua and Terra satellites image most of Australia 4 times daily. Data from the red, green, and blue wavelength channels are processed as true color images in near real time. They have been made publicly available since 2001 and are searchable by date via the MODIS Rapid Response System online archives.Citation31 Thermal anomalies, or “hot spots” (i.e., fires burning on the Earth's surface) are detected by processing data from the 4-and 11-μm wavelengths.Citation32 Hot spots are marked on the MODIS images; hot spots next to visible smoke plumes represent strong evidence for bushfire-related pollution without the need for great technical expertise. Other causes of hot spots include industrial activities such as power stations; however, these are easy to identify because they remain at a constant location through time on satellite images, whereas bushfires vary in space and time. Although this study covers the period between 1994 and 2007, MODIS true color images were only available from 2001 forward.
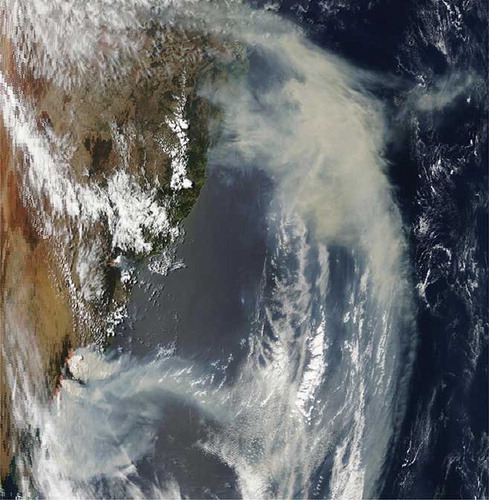
The region of Australia was examined on the day of and the day before air pollution episodes. The location of all hot spots and those hot spots with visible smoke plumes affecting the urban center of interest were examined. If smoke plumes were observed to be affecting the city of interest, the URL of the MODIS image was recorded. Satellite images demonstrating hot spots and bushfire smoke affecting Sydney are reproduced in .
Figure 3. MODIS imagery showing hot spots and smoke plumes affecting Sydney (see bottom left corner of image).
Total Ozone Mapping Spectrometer
AOT data from the Total Ozone Mapping Spectrometer (TOMS) were examined as a secondary source of information for a subset of days in which media reports were unclear about the location of fires, MODIS imagery was unavailable or inadequate, and other sources of information were lacking. AOT is a unitless measure of light extinction because of aerosol in cloudless atmospheric columns, so it provides evidence of the geographic extent of increased aerosol in the atmosphere. The TOMS AOT data were chosen over AOT data from MODIS because they provide a longer record (1979–1994 and 1994–present) and the data are readily available at the TOMS web-site.Citation33 By plotting AOT values in a geographic information system, whether aerosols were concentrated over desert or vegetated regions of the continent was able to be assessed. As such, events could be classified as “dust” or “probable landscape fire smoke,” respectively, as described below.
Landscape Fire Smoke
The primary aim was to determine which episodes of particulate air pollution could be confidently ascribed to smoke from landscape fires. Landscape fires from prescribed burning were documented when the information was available, but they were otherwise classified as bushfire. The following were accepted as evidence of landscape fire smoke (LFS): (1) media or government agency reports of fires in or adjacent to cities experiencing peaks in air pollution, and (2) MODIS imagery demonstrating hot spots with associated smoke plumes affecting the urban airshed. Although MODIS imagery provided a high level of confidence for the classification of LFS, absence of evidence from MODIS cannot be equated to an absence of landscape fire. Cloud cover can suppress the detection of thermal anomalies and can obscure smoke plumes in true color images. Furthermore, MODIS can miss any fires that occur between the four daily overpasses.
Probable LFS
This category described days for which remote sensing data were highly suggestive of LFS but no confirmatory information was available from other sources. For example, if there were hot spots in adjacent bush land but no smoke plumes were visible on MODIS imagery, the cause of the PM elevation was classified as probable LFS. Similarly, if the TOMS AOT data showed aerosol centered over a vegetated region this was considered likely to be due to landscape fire activity.
Dust
Large dust storms were identified by nearly all of the sources of information. They often generated news stories, were documented by local environment agencies, and were clearly visible in satellite imagery and TOMS AOT data.
Woodsmoke
The authors did not have a systematic method for retrospectively identifying days in which high levels of particulate air pollution could be attributed to the use of wood for domestic heating. However, the internal records of some government agencies did identify some days for which woodsmoke was considered to be the main cause. It is probable that many days of excess pollution in winter in the colder parts of Australia were due to increased use of wood heaters.Citation34,Citation35
Nonbiomass Particulate Air Pollution
In some cities, peaks in air pollution were occasionally attributed to higher levels of background pollution associated, for example, with an atmospheric temperature inversion. The media occasionally reported such events.
Nonbiomass Fire Smoke
This category referred to urban factory or warehouse fires and was usually clearly identified as such by media and government agencies.
No Cause Identified
Occasionally no cause could be found for the observed peaks in air pollution. On such days, the peak could have been due to background PM, sea salt, pollution from the increased use of wood heaters in winter, or a combination of factors or specific events such as bushfires or dust storms for which no reports were found.
All primary data sources were independently re-examined on dates for which (1) the available information was inconclusive or conflicting, (2) no event could be identified, and (3) event types were only identified by media sources. A random subset of 5% of all dates was also re-examined. For days in which the information remained inconclusive, the TOMS AOT database was also checked. For example, if there were media reports of fires burning several hundred kilometers from a city, examination of the TOMS database could usefully confirm if the geographic distribution of the aerosols generated by those fires included the city.
The references for the sources of evidence for each date were entered in a Microsoft Access database, including the name of the source (i.e., journal/newspaper/database), the date of publication, and the URL if relevant. Each event was classified as listed below. If there was good evidence for more than one source of air pollution (e.g., bushfire smoke and dust), then both were recorded.
RESULTS
The PM data are summarized in . The identified causes of these pollution events by city, PM type, and percentile group are shown in . The distribution of pollution events by season and PM size class is shown in .
Table 1. Air quality data availability and distribution for the six cities included in this study
Table 2. A description of all identified events by city, PM size class, and percentile bracket (95–96%, 97–98%, ≥99%)
Table 3. Seasonal distribution of days in which PM10 and PM2.5 equaled or exceeded the 95th percentile
There was considerable variation in the magnitude and seasonal distribution of pollution events between the three ecoregions studied. The three cities in central New South Wales all had the greatest maximum PM events and these occurred most frequently during the summer months. The 99th percentile was very close to Australia's 24-hr air quality standard of 50 μg/m3 for PM10 in all three cities in this region and to the current reporting standard of 25 μg/m3 for PM2.5. In the city of Perth in southwestern Australia, peak PM concentrations were not as high: the 99th percentile was 37.4 μg/m3 for PM10 and 21.4 μg/m3 for PM2.5. Although PM10 events were more frequent in summer, PM2.5 events were most frequent in spring. In Tasmania, the 99th percentile was 42.4 μg/m3 for PM10 and 26.7 μg/m3 for PM2.5 in Hobart, whereas in Launceston the corresponding figures were 67.7 μg/m3 for PM10 and 40.1 μg/m3 for PM2.5. Most PM events occurred in win ter,Citation36 which is consistent with the well-documented issue of air pollution from wood heaters in this region.
The ability to identify the causes of air pollution events varied by city. It was greatest for the mainland cities of Sydney and Perth and lowest for the Tasmanian cities of Hobart and Launceston (). There were several reasons for a lower identification rate in Tasmania, including the shorter period of air pollution records and more prevalent use of wood heaters in winter. Tasmania has a colder climate than mainland Australia and, contrary to the other cities examined, most pollution events occurred during winter when bushfires are infrequent. Furthermore, satellite imagery is a less useful resource in Tasmania because of the higher proportion of days for which cloud cover reduces the ability to interpret the satellite images ().
As expected, the more severe the pollution, the more likely a cause was to be clearly identified. For example, in the city of Sydney there were 52 of 5113 days during which PM10 reached or exceeded the 99th percentile. A cause was identified for 48 (92%) of these days, of which 47 (98%) were bushfire smoke and 1 was dust. Of the 256 days on which PM10 reached or exceeded the 95th percentile, 172 (67%) had a cause identified and 162 (94%) were attributed to bushfire smoke.
Over the entire study period, the most frequent source of information about air pollution events was from satellite imagery (). However, before the start of the MODIS archive in 2001, media reports were the primary source of information and the proportion of events for which a cause could be identified was just 30%. This rose to 75% once satellite imagery became available (.)
Table 4. Proportion of Sydney PM10 events due to LFS identified by each source of information before and after the online MODIS archive became available in 2001
DISCUSSION
The main cause of excess particulate pollution episodes in mainland Australian cities was smoke from landscape fires. In Sydney this ranged from 59% of days in which PM10 exceeded the 95th percentile to 90% of days in which PM10 exceeded the 99th percentile. These were mainly identified from media reports and, from 2001 onward, MODIS satellite imagery. Correlation was high between satellite imagery and media reports for identifying severe bushfire episodes, whereas smaller fires were less frequently reported in the media. The use of multiple sources of information to identify severe pollution episodes gives confidence in the findings, with more than half of the identified events being confirmed by more than one source ().
Table 5. Contribution of different sources of information for identifying PM10 events in Sydney (2001 onward)
The use of satellite imagery had some inherent limitations. These include bad images, cloudy days, and the complete absence of an online MODIS archive before 2001. Although very severe bushfires and pollution episodes were reported in the media, MODIS was the primary source of information and the identification success rate rose considerably after 2001. The TOMS AOT data were a useful adjunct, typically for determining the geographic area affected by smoke from fires identified through media or other reports. The search was restricted to remote sensing data from MODIS and TOMS because both are conveniently available online. However, data from other platforms (e.g., Landsat) or smoke dispersal modeling tools such as the Hybrid Single-Particle Lagrangian Integrated Trajectory (HYSPLIT) might improve future work in this area.Citation36
This study was not designed to identify excess pollution from other sources such as motor vehicles or wood heaters, although any such information was recorded if it was reported. Thus, many air pollution episodes from the colder parts of Australia, particularly Tasmania where winter woodsmoke pollution is a well-recognized problem,Citation37 were not identified. However, the authors are confident most episodes of LFS and dust storms were found unless these events were so small or geographically localized that they did not cause the citywide PM to exceed the 95th percentile.
The main advantage in this approach was that smaller scale events (i.e., those causing PM elevations between the 95th and 99th percentiles) could be identified that are less likely to attract media attention. Using news archives and government records, Morgan et al.Citation2 were able to attribute 32 pollution episodes in Sydney to bushfire smoke. However, analyses were restricted to events in which PM10 was greater than the 99th percentile and thus likely to be reported by news media. Over the same period an additional 3 days over the 99th percentile and a further 120 days in which LFS caused the PM10 to reach the 95th to 99th percentile were identified.
LFS is an episodic and increasingly important environmental hazard for human populations. Droughts, extreme fire weather, and landscape fire activity are increasing globally, and fire emissions are an important source of greenhouse gases.Citation38 This database of identified episodes has been developed as an ongoing resource for future environmental epidemiologic studies, including LFS episodes and other related exposures such as heat waves and dust storms. The database is a step forward in overcoming one of the major limitations of studies of the health effects of exposure to LFS to date—accurate exposure assessment. These results have now been used to undertake the first Australian study of mortality associated with pollution events from bushfires and dust storms.Citation39 The database will be refined and improved over time, and information from other sources (e.g., the Australasian Fire Authorities Council's Australian Incident Reporting SystemCitation40) can be added.
The manual searching of multiple information sources adds value to these findings. However, it is labor-intensive and difficult to automate. As an extension of this project, the authors have been using MODIS measurements on remotely sensed fires to model their relationship with air quality measurements and evaluate their utility for identifying pollution episodes from landscape fires. The database described here has allowed the authors to validate this less-intensive approach and to apply it within different settings in Australia and Canada. The authors hope that others working in similar regions will consider using similar methods to assess their historical data so that, together, an extensive validated PM event database can be developed for health and landscape research that will continue to improve global understanding of the public health effects of vegetation fire smoke.
REFERENCES
- Hänninen , O. 2008 . Challenges in Estimating the Health Effects of Biomass Smoke. Response to Sverre Vedal and Steven J. Dutton: Wildfire Air Pollution and Daily Mortality in a Large Urban Area . Environ. Res. , 106 : 423 – 425 . discussion 425
- Morgan , G. , Sheppeard , V. , Khalaj , B. , Ayyar , A. , Lincoln , D. , Jalaludin , B. , Beard , J. , Corbett , S. and Lumley , T. 2010 . The Effects of Bushfire Smoke on Daily Mortality and Hospital Admissions in Sydney, Australia, 1994 to 2002 . Epidemiology , 21 : 47 – 55 .
- Duclos , P. , Sanderson , L.M. and Lipsett , M. 1990 . The 1987 Forest Fire Disaster in California: Assessment of Emergency Room Visits . Arch. Environ. Health , 45 : 53 – 58 .
- Chen , L. , Verrall , K. and Tong , S. 2006 . Air Particulate Pollution Due to Bushfires and Respiratory Hospital Admissions in Brisbane, Australia . Int. J. Environ. Health Res. , 16 : 181 – 191 .
- Arbex , M.A. , Martins , L.C. , de Oliveira , R.C. , Pereira , L.A.A. , Arbex , F.F. , Cancado , J.E.D. , Saldiva , P.H.N. and Braga , A.L.F. 2007 . Air Pollution from Biomass Burning and Asthma Hospital Admissions in a Sugar Cane Plantation Area in Brazil . J. Epidemiol. Community Health , 61 : 395 – 400 .
- Delfino , R.J. , Brummel , S. , Wu , J. , Stern , H. , Ostro , B. , Lipsett , M. , Winer , A. , Street , D.H. , Zhang , L. and Tjoa , T. 2009 . The Relationship of Respiratory and Cardiovascular Hospital Admissions to the Southern California Wildfires of 2003 . Occup. Environ. Med. , 66 : 189 – 197 .
- Frankenberg , E. , McKee , D. and Thomas , D. 2005 . Health Consequences of Forest Fires in Indonesia . Demography , 42 : 109 – 129 .
- Golshan , M. , Faghihi , M. , Roushan-Zamir , T. , Marandi , M.M. , Esteki , B. , Dadvand , P. , Farahmand-Far , H. , Rahmati , S. and Islami , F. 2002 . Early Effects of Burning Rice Farm Residues on Respiratory Symptoms of Villagers in Suburbs of Isfahan, Iran . Int. J. Environ. Health Res. , 12 : 125 – 131 .
- Hanigan , I.C. , Johnston , F.H. and Morgan , G.G. 2008 . Vegetation Fire Smoke, Indigenous Status and Cardio-Respiratory Hospital Admissions in Darwin, Australia, 1996–2005 . BMC Environ. Health , 5 : 42
- Johnston , F.H. , Bailie , R. , Pilotto , L. and Hanigan , I. 2007 . Ambient Biomass Smoke and Cardio-Respiratory Hospital Admissions . BMC Public Health , 7 : 240
- Johnston , F.H. , Webby , R.J. , Pilotto , L. , Bailie , R. , Parry , D. and Halpin , S. 2006 . Vegetation Fires, Particulate Air Pollution and Asthma: a Panel Study in the Australian Monsoon Tropics . Int. J. Environ. Health Res. , 16 : 391 – 404 .
- Kunii , O. , Kanagawa , S. , Yajima , I. , Hisamatsu , Y. , Yamamura , S. , Amagai , T. and Ismail , I.T. 2002 . The 1997 Haze Disaster in Indonesia: Its Air Quality and Health Effects . Arch. Environ. Health , 57 : 16 – 22 .
- Kunzli , N. , Avol , E. , Wu , J. , Gauderman , W.J. , Rappaport , E. , Millstein , J. , Bennion , J. , McConnell , R. , Gilliland , F.D. , Berhane , K. , Lurmann , F. , Winer , A. and Peters , J.M. 2006 . Health Effects of the 2003 Southern California Wildfires on Children . Am. J. Respir. Crit. Care Med. , 174 : 1221 – 1228 .
- Moore , D. , Copes , R. , Fisk , R. , Joy , R. , Chan , K. and Brauer , M. 2006 . Population Health Effects of Air Quality Changes Due to Forest Fires in British Columbia in 2003: Estimates from Physician-Visit Billing Data . Can. J. Public Health , 97 : 105 – 108 .
- Mott , J.A. , Mannino , D.M. , Alverson , C.J. , Kiyu , A. , Hashim , J. , Lee , T. , Falter , K. and Redd , S.C. 2005 . Cardiorespiratory Hospitalizations Associated with Smoke Exposure during the 1997 Southeast Asian Forest Fires . Int. J. Hygiene Environ. Health , 208 : 75 – 85 .
- Mott , J.A. , Meyer , P. , Mannino , D. , Redd , S.C. , Smith , E.M. , Gotway-Crawford , C. and Chase , E. 2002 . Wildland Forest Fire Smoke: Health Effects and Intervention Evaluation, Hoopa, California, 1999 . West. J. Med. , 176 : 162 – 163 .
- Ovadnevaitd , J. , Kvietkus , K. and Marsalka , A. 2002 . Summer Fires in Lithuania . Impact on the Vilnius City Air Quality and the Inhabitants Health; Sci. Total Environ. 2006 , 356 : 11 – 21 .
- Sutherland , E.R. , Make , B.J. , Vedal , S. , Zhang , L. , Dutton , S.J. , Murphy , J. R. and Silkoff , P.E. 2005 . Wildfire Smoke and Respiratory Symptoms in Patients with Chronic Obstructive Pulmonary Disease . J. Allergy Clin. Immunol. , 115 : 420 – 422 .
- Tham , R. , Erbas , B. , Akram , M. , Dennekamp , M. and Abramson , M.J. 2009 . The Impact of Smoke on Respiratory Hospital Outcomes during the 2002–2003 Bushfire Season, Victoria, Australia . Respirology , 14 : 69 – 75 .
- Naeher , L.P. , Brauer , M. , Lipsett , M. , Zelikoff , J.T. , Simpson , C.D. , Koenig , J. Q. and Smith , K.R. 2007 . Woodsmoke Health Effects: a Review . Inhal. Toxicol. , 19 : 67 – 106 .
- Pope , C.A. , Dockery , D.W. and Review , Critical . 2006 . Health Effects of Fine Particulate Air Pollution: Lines That Connect . Journal of the Air & Waste Management Association , 56 : 709 – 742 .
- Sastry , N. 2002 . Forest Fires, Air Pollution, and Mortality in Southeast Asia . Demography , 39 : 1 – 23 .
- Vedal , S. and Dutton , S.J. 2006 . Wildfire Air Pollution and Daily Mortality in a Large Urban Area . Environ. Res. , 102 : 29 – 35 .
- Hanninen , O.O. , Salonen , R.O. , Koistinen , K. , Lanki , T. , Barregard , L. and Jantunen , M. 2009 . Population Exposure to Fine Particles and Estimated Excess Mortality in Finland from an East European Wildfire Episode . J. Expo. Sci. Environ. Epidemiol. , 19 : 414 – 422 .
- Jalava , P.I. , Salonen , R.O. , Hälinen , A.I. , Penttinen , P. , Pennanen , A.S. , Sillanpää , M. , Sandell , E. , Hillamo , R. and Hirvonen , M.R. 2006 . In Vitro Inflammatory and Cytotoxic Effects of Size-Segregated Particulate Samples Collected during Long-Range Transport of Wildfire Smoke to Helsinki . Toxicol. Appl. Pharmacol. , 215 : 341 – 353 .
- Danielsen , P.H. , Loft , S. , Kocbach , A. , Schwarze , P.E. and Møller , P. 2009 . Oxidative Damage to DNA and Repair Induced by Norwegian Wood Smoke Particles in Human A549 and THP-1 Cell Lines . Mutat. Res. , 674 : 116 – 122 .
- Mazzoli-Rocha , F. and Magalhães , B. 2008 . Comparative Respiratory Toxicity of Particles Produced by Traffic and Sugar Cane Burning . Environ. Res. , 108 : 35 – 41 .
- Confalonieri , U. , Menne , B. , Akhtar , R. , Ebi , K.L. , Hauengue , M. , Kovats , R.S. , Revich , B. and Woodward , A. 2007 . Contribution of Working Group II to the Fourth Assessment Report of the Intergovernmental Panel on Climate Change , Edited by: Parry , M.L. , Canziani , O.F. , Palutikof , J.P. , van der Linden , P.J. and Hanson , C.E. 402 Cambridge , , United Kingdom : Cambridge University .
- Atkinson , R.W. , Anderson , H.R. , Sunyer , J. , Ayres , J. , Baccini , M. , Vonk , J.M. , Boumghar , A. , Forastiere , F. , Forsberg , B. , Touloumi , G. , Schwartz , J. and Katsouyanni , K. 2001 . Acute Effects of Particulate Pollution on Respiratory Admissions. Results from the APHEA 2 Project . Am. J. Respir. Crit. Care Med. , 164 : 1860 – 1866 .
- Centre for Environmental Risk Management of Bushfires; University of Wollongong http://www.uow.edu.au/science/biol/icb/cermb.html (http://www.uow.edu.au/science/biol/icb/cermb.html) (Accessed: 2010 ).
- MODIS Rapid Response System; National Aeronautics and Space Administration http://rapidfire.sci.gsfc.nasa.gov (http://rapidfire.sci.gsfc.nasa.gov) (Accessed: October 2010 ).
- Kaufman , Y.J. , Ichoku , C. , Giglio , L. , Korontzi , S. , Chu , D.A. , Hao , W.M. , Li , R.R. and Justice , C.O. 2003 . Fire and Smoke Observed from the Earth Observing System MODIS Instrument: Products, Validation, and Operational Use . Int. J. Remote Sens. , 24 : 1765 – 1781 .
- Total Ozone Mapping Spectrometer; National Aeronautics and Space Administration http://toms.gsfc.nasa.gov/aerosols/aerosols_v8.html (http://toms.gsfc.nasa.gov/aerosols/aerosols_v8.html) (Accessed: October 2010 ).
- Hinwood , A.L. , De Klerk , N. , Rodriguez , C. , Jacoby , P. , Runnion , T. , Rye , P. , Landau , L. , Murray , F. , Feldwick , M. and Spickett , J. 2006 . The Relationship between Changes in Daily Air Pollution and Hospitalizations in Perth, Australia 1992–1998: a Case-Crossover Study . Int. J. Environ. Health Res. , 16 : 27 – 46 .
- Robinson , D.L. , Monro , J.M. and Campbell , E.A. 2007 . Spatial Variability and Population Exposure to PM2.5 Pollution from Woodsmoke in a New South Wales Country Town . Atmos. Environ. , 41 : 5464 – 5478 .
- Draxler , R.R. and Hess , G.D. 1998 . An Overview of the HYSPLIT_4 Modeling System of Trajectories, Dispersion, and Deposition . Australian Meteorol. Mag. , 47 : 295 – 308 .
- Keywood , M.D. , Ayers , G.P. , Gras , J.L. , Gillett , R.W. and Cohen , D.D. 2000 . Size Distribution and Sources of Aerosol in Launceston, Australia, during Winter 1997 . Journal of the Air & Waste Management Association , 50 : 418 – 427 .
- Bowman , D.M.J.S. , Balch , J.K. , Artaxo , P. , Bond , W.J. , Carlson , J.M. , Cochrane , M.A. , D'Antonio , C.M. , DeFries , R.S. , Doyle , J.C. , Harrison , S.P. , Johnston , F.H. , Keeley , J.E. , Krawchuk , M.A. , Kull , C.A. , Marston , J.B. , Moritz , M.A. , Prentice , I.C. , Roos , C.I. , Scott , A.C. , Swetnam , T.W. , van der Werf , G.R. and Pyne , S.J. 2009 . Fire in the Earth System . Science , 324 : 481 – 484 .
- Johnston , F.H. , Hanigan , I.C. , Henderson , S.B. , Morgan , G.G. and Bowman , D. M.J.S. The Association between Mortality and Extreme Particulate Air Pollution Events from Bushfires and Dust Storms in Sydney, Australia 1994–2007, submitted for publication . Environ. Res. ,
- Bryant , C. 2008 . Understanding Bushfire: Trends in Deliberate Vegetation Fires in Australia , 56 Canberra , , Australia : Australian Institute of Criminology .
- Hutchinson , M.F. , McIntyre , S. , Hobbs , R.J. , Stein , J.L. , Garnett , S. and Kinloch , J. 2005 . Integrating a Global Agro-Climatic Classification with Bioregional Boundaries in Australia . Global Ecol. Biogeography , 14 : 197 – 212 .