ABSTRACT
As part of the Advanced Collaborative Emissions Study (ACES), regulated and unregulated exhaust emissions from four different 2007 model year U.S. Environmental Protection Agency (EPA)-compliant heavy-duty highway diesel engines were measured on an engine dynamometer. The engines were equipped with exhaust high-efficiency catalyzed diesel particle filters (C-DPFs) that are actively regenerated or cleaned using the engine control module. Regulated emissions of carbon monoxide, nonmethane hydrocarbons, and particulate matter (PM) were on average 97, 89, and 86% lower than the 2007 EPA standard, respectively, and oxides of nitrogen (NOx) were on average 9% lower. Unregulated exhaust emissions of nitrogen dioxide (NO2) emissions were on average 1.3 and 2.8 times higher than the NO2 emissions reported in previous work using 1998- and 2004-technology engines, respectively. However, compared with other work performed on 1994- to 2004-technology engines, average emission reductions in the range of 71–99% were observed for a very comprehensive list of unregulated engine exhaust pollutants and air toxic contaminants that included metals and other elements, elemental carbon (EC), inorganic ions, and gas- and particle-phase volatile and semi-volatile organic carbon (OC) compounds. The low PM mass emitted from the 2007 technology ACES engines was composed mainly of sulfate (53%) and OC (30%), with a small fraction of EC (13%) and metals and other elements (4%). The fraction of EC is expected to remain small, regardless of engine operation, because of the presence of the high-efficiency C-DPF in the exhaust. This is different from typical PM composition of pre-2007 engines with EC in the range of 10–90%, depending on engine operation. Most of the particles emitted from the 2007 engines were mainly volatile nuclei mode in the sub-30-nm size range. An increase in volatile nanoparticles was observed during C-DPF active regeneration, during which the observed particle number was similar to that observed in emissions of pre-2007 engines. However, on average, when combining engine operation with and without active regeneration events, particle number emissions with the 2007 engines were 90% lower than the particle number emitted from a 2004-technology engine tested in an earlier program.
To meet the 2007 EPA heavy-duty highway PM emissions standard, engine manufacturers have elected to equip engine exhaust with a high-efficiency C-DPF. Because of the use of the C-DPF, the PM emissions were 86% below the 2007 standard, and many unregulated gas and particle-phase emissions compounds were substantially lower than those emitted from pre-2007-technology engines. Signifi-cant air quality benefits can be expected as the C-DPF technology, or other equivalent technology, continues to be applied to future highway engines and to other nonroad and stationary diesel engines.
INTRODUCTION
Model year 2007 heavy-duty highway diesel engines sold in the United States must comply with the 2007 U.S. Environmental Protection Agency (EPA) particulate matter (PM) emission standard of 0.01 g/hp-hr, a 90% reduction from the 1994 limit of 0.1 g/hp-hr.Citation1 The 2007 highway engines must also comply with a phased-in oxides of nitrogen (NOx) limit of approximately 1.2–1.5 g/hp-hr, a 38–50% reduction from the 2004 limit. This will be followed by a NOx limit of 0.20 g/hp-hr for 2010 heavy-duty highway diesel engines. Compliance with carbon monoxide (CO) and nonmethane hydrocarbon (NMHC) emissions limits of 15.5 and 0.14 g/hp-hr, respectively, is also required.
Complying with 2007 emission limit challenges required on-highway heavy-duty diesel engines to adopt design and external equipment changes, most notably the addition of a high-efficiency catalyzed diesel particle filter (C-DPF) in the exhaust system to trap PM. A C-DPF requires periodic cleaning to prevent an unacceptable exhaust system pressure increase as the C-DPF collects PM. The cleaning process is called “regeneration” and it is achieved by several techniques. For engines in this investigation, diesel fuel injection into the diesel oxidation catalyst (DOC) or igniting a burner within the exhaust system achieved regeneration. The main goal of fuel injection or a burner is to elevate the exhaust stream temperature to oxidize soot trapped in the C-DPF to reduce engine exhaust back pressure. In addition to the exhaust C-DPF, a coalescent filter was added to the blow-by system to remove PM from the blow-by stream before it is vented to the atmosphere. The blow-by stream is a small fraction (<0.01) of the engine exhaust stream. It escapes the combustion chamber from around the piston rings. It has a high interaction with the engine oil gallery and typically contains a high level of unburned and partially burned lube oil mist. Cooled exhaust gas recirculation (EGR) with increased flow and more effective EGR coolers were used as the main strategy to reduce NOx emissions. These technologies are the main improvements to 2007-technology engines, but other changes such as high boost pressure, high injection pressure, and improved combustion chamber design also played a role in optimizing the emissions, particularly NOx and fuel economy.Citation2
Recognizing the potential emissions reduction benefits from 2007-technology engines, phase 1 of the Advanced Collaborative Emissions Study (ACES) was launched to fully characterize and document the emissions from four 2007 heavy-duty diesel engines.Citation3 The characterization included regulated engine exhaust emissions of CO, NMHCs, NOx, and PM; greenhouse gas emissions of carbon dioxide (CO2), methane (CH4), and nitrous oxide (N2O); and a detailed list of unregulated engine exhaust gas and particle-phase species such as nitrogen dioxide (NO2), elemental carbon (EC), organic carbon (OC), metals and elements, ions, speciated C2–C12 hydrocarbons, alcohols, nitrosamines, aldehydes and ketones, alkanes, polar compounds, polycyclic aromatic hydrocarbons (PAHs), nitrogenated PAHs (nitroPAHs), oxygenated PAHs (oxyPAHs), hopanes, steranes, and dioxins and furans. These are in addition to particle number and size distribution characterization. The data provide a comprehensive characterization of the emissions from new technology diesel engines. They also established the basisCitation3 for selecting one of the four engines for a major animal exposure study as a part of phase 3 of the ACESCitation4 (currently underway at the Lovelace Respiratory Research Institute [LRRI]).
This paper summarizes the exhaust emissions data measured and analyzed from four 2007 heavy-duty highway diesel engines operated on an engine dynamometer. The regulated engine exhaust emissions data are compared with the regulatory standards. The unregulated engine exhaust emissions data are compared with data available in the literature using pre-2007 engines to add some perspective on the emissions performance of modern 2007 engines compared with older technology engines.
APPROACH
2007-Technology Engines
The 2007 heavy-duty highway engines evaluated in the phase 1 ACES work were a Caterpillar C13 (430 hp), a Cummins ISX (455 hp), a Detroit Diesel Corporation series 60 (455 hp), and a Mack MP7 (395 hp) manufactured by Volvo. All engines were equipped with variable geometry turbochargers with water-cooled intake air systems. Three of the four engines were equipped with water-cooled high-pressure loop EGR systems in which the exhaust gas is routed from the exhaust manifold to the high-pressure side of the intake air compressor. The remaining engine was equipped with a low-pressure loop water-cooled EGR system in which the exhaust gas is routed from downstream of the C-DPF to the inlet side of the intake air compressor. Three of the four engines were equipped with a DOC followed by a C-DPF in the exhaust system. The C-DPF for each of these engines was actively regenerated or cleaned using diesel fuel injection into the exhaust stream upstream of the DOC. The fuel injected into the exhaust stream reacts with oxygen over the surface of the DOC, leading to an increase in exhaust temperature at the outlet of the DOC/inlet of C-DPF. The high exhaust temperature triggers the oxidation of soot trapped inside of the C-DPF by exhaust oxygen and NO2. A high fraction of NO2 is typically formed in the exhaust inside of the DOC/C-DPF. This is due to an enhanced nitric oxide (NO)-to-NO2 oxidation by the catalysts. NO2 formation in the exhaust promotes soot oxidation at a lower temperature compared with oxygen. One of the four engines was equipped with an exhaust diesel fuel burner that supplies a stream of hot exhaust. The burner stream is mixed with the main exhaust stream to elevate the temperature before entering the C-DPF to achieve soot oxidation similar to that of the other three engines.
The active regeneration strategy of the C-DPF for each engine is different. It may take into consideration engine operating time, fuel used, C-DPF loading condition, DOC inlet temperature, soot loading, and other factors (e.g., passive regeneration during normal operation). The engine control module (ECM) triggered all active regenerations occurring during emissions testing without any interference by the engine operator. A monitored signal broadcasted by the engine ECM was used to determine if C-DPF active regeneration was “on” or “off.” During exhaust system conditioning, before an official emissions test, the C-DPF went into a “forced” C-DPF active regeneration that was triggered by the engine operator. An active C-DPF regeneration may include multiple, separate exhaust fuel injection events until the C-DPF is “clean.” The length of the C-DPF regeneration process is likely to depend on the duty cycle of the engine or it may be time-based. High load (and therefore higher temperature) operation will allow the regeneration to proceed quicker, resulting in a shorter overall regeneration time. In the case of using a fuel burner for C-DPF active regeneration, continuous operation of the fuel burner is enacted until the C-DPF reaches a clean condition that is defined by the engine manufacturer.
Fuel and Lubricant
The fuel used in phase 1 of the ACES program was a commercial refinery ultralow sulfur diesel (ULSD) fuel that conformed to the EPA 2007 fuel specifications for 2007 highway engines.Citation5 shows some selected fuel properties analyzed in phase 1 of the ACES in accordance with the American Society for Testing and Materials (ASTM). The fuel had typical ASTM characteristics and a sulfur content of 4.5 ppm. In addition to the selected fuel properties shown in , additional analysesCitation3 demonstrated the presence of residual lube oil elements in the fuel such as phosphorus, calcium and zinc with concentrations of 1.36, 1.38, and 1.19 parts per million (ppm), respectively. In addition, the fuel contained sodium at 14.5 ppm. The concentrations of these elements in commercially available ULSD fuel may vary depending on the fuel-refining source and pipeline transportation.Citation6 Although these elements are typically captured by the C-DPF, their presence in the fuel may increase the ash loading by the C-DPF and affect its long-term durability, although that is not the subject of the work presented here.
Table 1. ULSD fuel properties used in the ACES program
shows the ACES phase 1 ASTM analyses for the fresh and used lube oil. The fresh oil was analyzed once. The used lube oil was collected by the Southwest Research Institute (SwRI) from each of the four engines before any emissions testing, but after 125 hr of engine operation run by the respective manufacturers before shipping the engine and lube oil to SwRI. The average, minimum, and maximum levels for the used lube oil shown in are based on four lube oil analyses, one per engine. The dominant elements observed in the fresh lube oil were calcium (2268 ppm), phosphorus (1043 ppm), and zinc (1157 ppm). Sulfur concentration is expected to be approximately 3000 ppm, but it was not measured. The used lube oil had higher levels of boron, copper, magnesium, manganese, iron, silicon, sodium, and tin compared with the fresh oil, which implies that these elements were accumulated in the oil during normal use.
Table 2. ACES engines ASTM average lube oil properties after 125 hr of engine operation
EXPERIMENTAL SETUP
The experimental setup is described with sufficient information for the reader to be able to understand what has been done in this work. The reader is also encouraged to review ref 3 for more information about the experimental setup, measurements performed, and analytical procedures used.
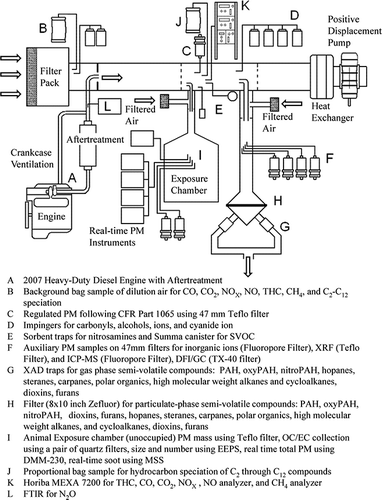
shows the overall exhaust sampling and measurement setup with a short description of each measurement performed. Regulated emissions measurement and testing complied with 40 Code of Federal Regulations (CFR) Part 1065 using a full-flow constant volume sampler (CVS).Citation5 The average nominal dilution ratio (DR) between engine exhaust and CVS was approximately 20 for the Federal Test Procedure (FTP) and the 16-hr cycle. Note that in this work DR is defined as
Figure 1. Overall experimental setup for the ACES program. A= 2007 heavy-duty diesel engine with aftertreatment. B= background bag sample of dilution air for CO, CO2, NOx, NO, THCs, CH4, and C2–C12 speciation. C= regulated PM following CFR Part 1065 using 47-mm Teflo filter. D= impingers for carbonyls, alcohols, ions, and cyanide ion. E= sorbent traps for nitrosamines and Summa canister for SVOCs. F= auxiliary PM samples on 47-mm filters for inorganic ions (Fluoropore filter), XRF (Teflo filter), and inductively coupled MS (Fluoropore filter), DFI/GC (TX-40 filter). G= XAD traps for gas-phase semi-volatile compounds: PAHs, oxyPAHs, nitroPAHs, hopanes, steranes, carpanes, polar organics, high-molecular-weight alkanes and cycloalkanes, dioxins, furans. H= filter (8× 10 in. Zefluor) for particulate-phase semi-volatile compounds: PAHs, oxyPAHs, nitroPAHs, dioxins, furans, hopanes, steranes, carpanes, polar organics, high-molecular-weight alkanes, cycloalkanes, dioxins, and furans. I= UAEC PM mass using Teflo filter, OC/EC collection using a pair of quartz filters, size and number using EEPS, real-time total PM using DMM-230, real-time soot using MSS. J= proportional bag sample for hydrocarbon speciation of C2–C12 compounds. K= Horiba MEXA 7200 for THCs, CO, CO2,NOx, NO analyzer, and CH4 analyzer. L= FTIR for N2O.
To increase the mass of semi-volatile organic compounds (SVOCs) collected during a test to improve engine emissions detection limits, a high volume sampler (HVS) connected to the sample zone of the CVS was used. The HVS total nominal flow rate extracted from the CVS tunnel was 850 standard L/min, and the nominal DR was 2. The HVS contained a 203- by 254-mm Zefluor filter assembly followed by four 106-mm diameter XAD holders.
To provide information on the concentration level of PM mass, OC/EC, and particle size and number that might guide the design of experiments for the animal exposure study under phase 3 of the ACES, an unoccupied animal exposure chamber (UAEC) was used. The UAEC was provided by LRRI. It was set up on the CVS tunnel and used for collections and measurements described in item “I” under . The flow residence time through the chamber was approximately 4 min and the nominal DR between CVS tunnel and the exposure chamber was 2, resulting in an average nominal DR of 40 during an FTP or a 16-hr cycle.
Analytical Methods
Dilute CO and CO2 were measured using nondispersive infrared detectors, NOx was measured using a heated chemiluminescence detector, and total hydrocarbons (THCs) and CH4 were measured with heated flame-ionization detectors. All regulated emission measurements complied with 40 CFR Part 1065.Citation5 NO2 was determined by subtracting NO from NOx using another heated chemiluminescence detector for NO measurement. The analytical work for the unregulated emissions was performed by SwRI and the Desert Research Institute. Particle- and gas-phase semi-volatiles were extracted and analyzed using a Varian 4000 ion trap in electron impact mode gas chromatograph/mass spectrometer (GC/MS). A Varian 1200 triple quadrupole high-resolution GC/high-resolution MS (HRGC/HRMS) operating in negative chemical ionization mode was used for nitroPAH compounds. The analytical protocol followed for analysis of dioxins and furans (polychlorinated dibenzodioxins or polychlorinated dibenzofurans) was EPA method 8290. The instruments used included a VG AutoSpec HRGC/HRMS, a Fi-sons AutoSpec Ultima HRGC/HRMS, and a Micromass AutoSpec Ultima HRGC/HRMS. The analytical procedures used for conducting hydrocarbon speciation (C2–C12 hydrocarbons, aldehydes and ketones, and alcohols) followed the Coordinating Research Council (CRC) Auto/Oil phase II protocols.Citation7 With these methods, exhaust emissions samples are analyzed for more than 200 species. Four GCs and one high-performance liquid chromatograph were used to identify and quantify compounds.
PM was collected on a Teflon membrane filter (Teflo) and analyzed for elements using energy-dispersive X-ray fluorescence. PM was collected on a Teflon-coated filter (Fluoropore) and analyzed for particle-phase ions using ion chromatography. The significant figures reported for each species in signify the detection limit for that species, as determined using EPA CFR Part 136.
Table 4. Average regulated emissions summary for four FTP composite cycles (1/7 × cold start+ 6/7 × hot start), one per ACES phase 1 2007 engine
Table 5. Average NO2 emissions summary for all 12 repeats of the hot-start FTP transient cycle for all four 2007 ACES engines
Table 6. Summary of average unregulated emissions for all 12 repeats of the 16-hr cycles for all four 2007 ACES engines and for 2004-technology engines used in CRC E55/E59Citation12 (dioxins were compared to 1998 levels).Citation1 Citation3
Table 7. CARB toxic air contaminant average emissions for all 12 repeats of the 16-hr cycles for all four 2007 ACES engines and for 1994- to 2000-technology engines running over the FTP transient cycle.Citation15
Table 8. PAH and nitroPAH average emissions for all 12 repeats of the 16-hr cycles for all four 2007 ACES engines and for a 2000-technology engine running over the FTP transient cycle.Citation16
Table 9. Elemental average emissions for all 12 repeats of the 16-hr cycles for all four 2007 ACES engines and for 1994- to 2000-technology engines running over the FTP transient cycle.Citation15,Citation16
Table 10. Average element emissions rate and composition used in for all 12 repeats of the 16-hr cycles using all four 2007 ACES engines
Figure 3. Average element emissions rate and composition for all 12 repeats of the 16-hr cycles using all four 2007 ACES engines. As a percentage of total PM: sodium (1%), phosphorus (0.6%), calcium (0.5%), iron (0.7%), and zinc (0.1%). Note that the graph shows the percent of total elements and not PM; PM was collected from the full-flow CVS for these analyses.
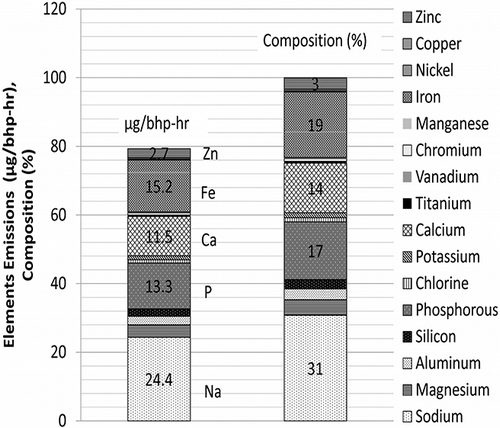
Table 11. Summary of data plotted in
Figure 5. Maximum potential of particle-phase emissions using chemical composition compared with filter weighing and other chemical makeup. Data plotted based on the average emissions for all 12 repeats of the 16-hr cycles using all four 2007 ACES engines. PM for OC/EC was collected from the exposure chamber; PM for sulfate, elements, and gas- and particle-phase semi-volatiles and volatiles were collected from the full-flow CVS.
The focus of this paper is on two test cycles. The first is on the 20-min FTP transient cycle. EPA requires the FTP cycle for compliance with regulated engine exhaust emissions species. The second is on a new 16-hr transient cycle developed by West Virginia University.Citation8–11 The information from this cycle is relevant to the ACES phase 3 work because the 16-hr cycle is a part of it. This cycle also provides longer sample time and improved detection limit of low-concentration unregulated exhaust emissions compounds. In addition, the 16-hr cycle represents a more complete engine operation that includes C-DPF active regenerations. The 16-hr cycle consists of four 4-hr segments that are repeated 4 times. Each 4-hr segment is composed of three FTP transient cycles and several California Air Resources Board (CARB) steady-state modes,Citation10,Citation11 including three creeps, four transients, two cruises, and four high-speed cruises.
One cold-start FTP transient cycle was performed with each of the four engines only for regulated emissions measurements. Along with the cold-start FTP, three repeats of the FTP hot-start transient cycle were performed with each of the four ACES engines with blow-by. Three hot-start repeats were also performed without blow-by. Official certification testing using the FTP must be done with the blow-by stream routed to a location in the exhaust downstream of the C-DPF. Testing without blow-by was done to quantify the blow-by contribution to PM emissions. Before each of the three hot-start FTP emission tests, a forced active regeneration was performed to condition the exhaust and CVS system and to clean the C-DPF to a baseline level. No active regenerations were encountered during FTP emission testing. The 16-hr cycle was run over 2 days, two 4-hr segments per day with 15 min of engine idle in between segments. All 16-hr cycles on all four engines were run with blow-by. On day 1, a forced C-DPF active regeneration was performed once before the beginning of a hot-start 4-hr segment of the 16-hr cycle. On day 2, the continuation of the 16-hr cycle proceeded with a cold-start 4-hr segment, without any forced C-DPF active regeneration. The regeneration status was determined via a monitored signal that is triggered by the engine ECM whenever active regeneration is on. Because of the infrequent nature of C-DPF regeneration that may occur once or twice during a 16-hr cycle, it is possible to find two or three 4-hr segments within a 16-hr cycle without active regenerations. Thus, with real-time particle instruments such as the engine exhaust particle sizer (EEPS) that measure particle number and size distributions and the microsoot sensor (MSS) that measures soot mass, it is possible to report average data or real-time data on the basis of 4-hr segments with and without regenerations, as can be seen later in the results section. All measurements and filter collections listed in were performed in parallel. lists all of the tests performed over the entire program, with the bold entries being those that are discussed in this paper. Regulated exhaust emissions species are reported based on a weighted emissions composite of a 20-min cold-start followed by a 20-min hot-start FTP transient cycle. The weighted regulated emissions species is equal to one-seventh of the integrated emissions during the cold-start FTP plus six-sevenths of the emissions during the hot-start FTP. Unregulated exhaust emissions species are reported based on the entire 16-hr cycle. Unless otherwise noted, all emissions data are reported on a brake-specific emissions basis, which is defined as the total mass emitted during a test interval over the work during that test interval in brake horsepower-hour. Except for real-time data, in which only one representative ACES engine is used, all other ACES engines data are reported on an average basis using all four engines and all repeats of the cycles used.
Table 3. Test matrix with the number of repeated runs for each of the four 2007 ACES engines used in the ACES program (only the highlighted events in are reported in this paper)
RESULTS AND DISCUSSION
Regulated Emissions
Engine emissions compliance with EPA regulations is based on the sum of 14.3 and 85.7% of each regulated emissions species emitted during a cold-start and a hot-start FTP transient cycle, respectively. Following this procedure, shows the average regulated emissions results on the basis of four cold-start and hot-start FTP transient cycles, one per engine. Data were collected on the ACES phase 1 engines with blow-by, but without any active C-DPF regeneration. PM, CO, NMHCs, and NOx were on average 86, 97, 89, and 9% below the 2007 standard, respectively, and 99, 97, 97, and 73% below the 1998 standard. The 1998 standard was based on THCs, and the percent reduction was based on measured THCs performed during phase 1 of the ACES work. For EPA in-use testing and compliance using heavy-duty highway trucks, it is difficult to route the blow-by stream to downstream of the C-DPF to account for its PM emissions contribution during in-use PM emissions measurement.Thus, in-use testing on-board vehicles without blow-by is permitted by EPA, but a PM emissions value for the blow-by contribution is required. EPA accepts a PM emissions value of 0.0004 g/hp-hr to account for blow-by contribution. This value was determined from the difference between PM emissions with and without blow-by measured in phase 1 of the ACES using hot-start FTP transient cycles. The average hot-start FTP PM emissions with and without blow-by were 0.0011± 0.0005 and0.0007± 0.0003 g/bhp-hr, respectively. The average PM for the hot-start FTP transient cycle was based on 12 tests, 3 tests per engine.
NO2 Emissions
Table 5 shows the average NO2 emissions for 12 repeats of the hot-start FTP transient cycle using the ACES phase 1 engines. It also shows NO2 emissions from model year 1998 and 2000 heavy-duty highway diesel engines on the basis of other work that used the same test cycle and procedures to determine NO2 emissions.Citation12,Citation13 In both cases, NO2 emissions are reported as the difference between measured NOx and NO emissions. On the basis of the data shown in , the emissions rate of NO2 from the 2007 ACES engines is 33% higher than that from engines meeting the 1998 standard. On the basis of SwRI internal data for a 2004-technology engine, the NO2/NOx ratio was 11% for the FTP transient cycle. Using such information, the average NO2 emissions from the 2007 ACES engines are calculated to be a factor of 2.8 higher than the emissions from an engine meeting the 2004 NOx standard. Although NOx emissions from 2007 engines are lower than those from engines meeting the 1998 and 2004 NOx standards, a higher NO2 or higher NO2/NOx ratio was observed. The increase in NO2 emissions from 2007 engines is mainly because of oxidation of partial NO in the exhaust by the DOC and/or the C-DPF. It is important to note that the NO2 emissions increase will affect only heavy-duty highway engines sold between 2007 and 2009. Starting with 2010 production engines, a stringent NOx limit of 0.20 g/bhp-hr is required. Assuming that the NO2/NOx ratio for 2010 engines is similar to that of 2007 engines, the average direct emissions rate of NO2 from 2010-technology engines is expected to be less than or equal to 0.12 g/hp-hr, which is 84% below 2007 levels, 55% below 2004 levels, and 78% below 1998 levels.
Important Contributors of the 795 Unregulated Engine Exhaust Emissions Species Investigated during the ACES phase 1 program
All average unregulated engine exhaust emissions data reported for the 2007 ACES engines are based on emissions collected during 12 tests of the 16-hr cycle, 3 tests per engine. shows the average emissions of several groups of unregulated exhaust emissions compounds for the 2007 ACES phase 1 engines and for 2004-technology engines. The 2004 engine emissions are based on work performed by other researchers using vehicles operating at the idle, transient, and cruise modes of the five CARB steady-state modes, which comprise only a portion of the 16-hr cycle tested in this work.Citation14 The average of the three modes combined is reported in in grams per hour. Substantial emissions reductions were observed with the 2007-technology engines ranging from 71 to 99% as compared with 2004-technology engines. The average emissions for the three modes on a grams-per-hour basis, as reported in , will result in lower emissions because of the low emission rates in grams per hour at idle compared with the transient and creep modes. Thus, the percent reduction reported below relative to 2004-technology engines is considered a conservative estimate. The reduction from 2007 engines would likely be even greater if 2004-technology engines were used for comparison on the basis of the 16-hr cycle. The 99% reduction in dioxins and furans was relative to 1998-technology engines.Citation15 The above comparison indicates an overall substantial reduction in total unregulated engine exhaust emissions species. This is also true for individual pollutants that are considered air toxic contaminants by CARB,Citation16 as shown in . shows that 2007 engines substantially reduce CARB air toxic contaminants compared with emissions technology from 1994 to 2001 engines.Citation17,Citation18
Table 8 shows further evidence for the reduction of some selected PAHs and nitroPAHs, including those that are typically required to be measured by regulatory agencies such as EPA and CARB in fuel-testing registration and verification. The reductions in PAHs range from 80% to more than 99% relative to a 2000-technology engine.Citation19
All PAHs with more than four rings except fluoranthene and pyrene were below the detection limit. reports a 92% reduction in nitroPAH compound emissions with the 2007-technology engines. Previous work showed artifact formation during filter collection of the compounds highlighted in bold in .Citation20 The work presented here shows that even for these compounds, a substantial reduction is observed, with 6-nitrobenzo(a)pyrene reported to be below the detection limit. This suggests that nitroPAH artifact formation, if any, is negligible with the 2007-technology engines. It did not seem to affect the high nitroPAH reductions observed relative to older technology engines.
Table 9 shows a substantial reduction in metals and other elements relative to 1994- to 2000-technology engines. Sulfur emissions are lower because of a reduction in sulfur level in the fuel from 500 ppm to less than 15 ppm, complemented by a reduction in sulfur in lube oil from approximately 6000 to 3000 ppm. The ACES phase 1 work demonstrates that all of the unregulated emissions compounds measured from 2007 technology heavy-duty diesel engines, except NO2, were substantially lower than those emitted from 1994- to 2004-technology engines.
PM Composition
shows the average PM emissions on the basis of filters collected from the exposure chamber during the 16-hr cycles for all four ACES engines tested in phase 1. The measured chemical makeup of PM includes OC and EC, sulfate, and elements and metals. The bar on the right shows the percent chemical composition of PM. In addition to the very low PM mass emissions discussed previously, sulfate (53%) and OC (30%) dominate the total PM emitted from 2007 heavy-duty highway diesel engines. EC represents only 13% of the total PM emissions, followed by metals and elements at 4%. This PM composition is different from what has been measured from earlier technology diesel engines having much higher emissions of soot in the range of 10–90% of total PM, depending on engine operating conditions. With 2007-technology engines, it is likely that the soot fraction remains very low, regardless of engine operation, provided that the high-efficiency C-DPF functions properly in real-world use.
Figure 2. Average PM emissions rate and composition for all 12 repeats of the 16-hr cycles using all four 2007 ACES engines. The filter for weighing was collected from the exposure chamber using a Teflo filter; OC and EC were collected from the exposure chamber using a quartz filter and analyzed using TOT; and sulfate and elements were collected from a full-flow CVS on fluoropore and Teflo filters, respectively, and were analyzed using ion chromatography and XRF, respectively
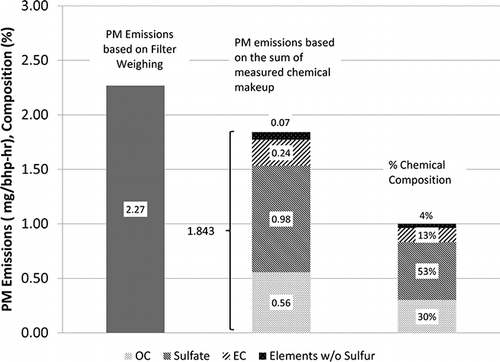
The sum of the measured chemical composition of PM was 19% lower than the total PM on the basis of filter collection and weighing. To perform a material balance between the filter weighed and the sum of the chemical makeup, one needs to estimate the mass of material bound to each of the measured species, which is not an easy task. For exhaust PM collected on a filter and weighed in a 9.5 °C dew point environment at an ambient temperature of 21 °C, it is a common practice to treat a sulfate ion as a sulfuric acid molecule with 7.19 water molecules attached to it.Citation21 Under such treatment, the calculated hydrated sulfuric acid for this work will be within 1% of the total PM collected by the filter. In addition, the sum of the chemical makeup will be 37% higher using OC, metals, and other elements as measured. Thus, simply converting sulfate to hydrated sulfuric acid using the above treatment may have worked for pre-2007 practices in which the sulfate is less than 5% of total PM, but for 2007 engines with a sulfate level at 53% of total PM, such conversion leads to an overestimation of the contribution of sulfate to PM.
Relative to OC, there are several issues encountered when converting OC to total organic matter. First, the operational definition of the OC/EC split using the thermal optical transmittance (TOT) or thermal optical reflectance (TOR) method is a key issue.Citation22,Citation23 The TOR method isreported in this work because it gives a better agreement in ambient PM measurements.Citation24 However, there could be as much as 30–80% lower EC reported based on the TOR compared with the TOT method.Citation20 Work is needed to investigate which of the two methods is appropriate for 2007 diesel engine PM emissions characterization. Second, quartz filters used for the collection of OC are subject to significant absorption and desorption of organic vapors and artifact formation and loss as compared with the Teflon membrane filter media used to report total PM.Citation25 Thus, artifact formation and loss on quartz filters is an issue, particularly when 30% of the PM is volatile hydro-carbon, as is the case in this work. Previous work related to emissions from engines showed a reasonable agreement between OC/EC and total PM collected on a Teflon membrane filter when a quartz backup filter was used for artifact subtraction from the primary quartz filter using 20-min short engine cycles.Citation25,Citation26 For this work, the backup filter was not subtracted from the primary filter to report OC because of concerns that some of the materials lost from the primary filter could have deposited on the backup filter during the long 16-hr cycle. Third, the conversion factor from OC to organic mass (OM) is not well quantified to account for hydrogen, oxygen, and other species that are attached to OC. For ambient PM, conversion factors ranging from 0.73 to 2.1 are used to convert OC to OM.Citation27 In the Interagency Monitoring of Protected Visual Environments (IMPROVE), a revised conversion factor of 1.8 instead of 1.4 is used.Citation24 For fresh particles emitted from diesel exhaust, a conversion factor of 1.18 (corresponding to a diesel fuel hydrogen-to-carbon ratio of 18%) is typically used. Using a 1.18 conversion factor for OC but without making any correction for other measured chemical species, the sum of the chemical makeup increased, but it was still 14% below the total PM collected by the filter. If a factor of 1.8 is used, the sum of the chemical makeup will be within less than 1% of the total PM collected by the filter, making no room for sulfate or other corrections to be made. More work is needed to determine a more appropriate OC-to-OM conversion factor when it comes to 2007 diesel engines.
Relative to the measured elements, one needs to assume that elements are bound to other elements such as oxygen, hydrogen, and nitrogen that were not measured by the X-ray fluorescence (XRF) method. For example, a calcium oxide molecule will weigh 40% more than the calcium measured. Measured elements were 4% of the total PM in this study. If the actual molecular composition is known, including elements that were not measured using XRF, they can add up to a higher percentage of total PM compared with the level reported. The main point from the above discussion is that it is difficult to make a mass balance between total PM on a filter and the sum of the chemical species without making many assumptions
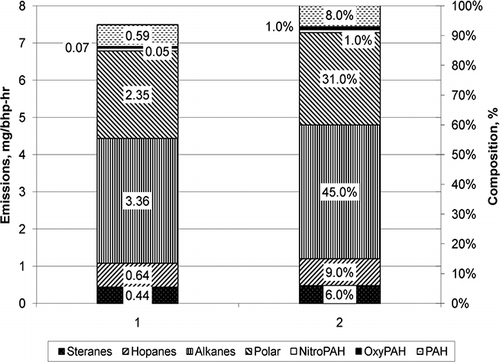
() shows the elements comprising the 4% of total PM. Sulfur is not a part of the 4% because it was accounted for in the sulfate portion. Sodium was the dominant metal, representing 31%, followed by iron, calcium, and zinc at 19, 14, and 3%, respectively. Phosphorus was the highest nonmetallic element, representing 17%. Note that phosphorus, calcium, and zinc were present in the fuel and the lube oil. Sodium was measured mainly in the fuel at a concentration of 14.5 ppm, a factor of approximately 11 higher than phosphorus, calcium, and zinc. shows the particle-phase SVOCs collected on a Zefluor filter. Alkanes and polar compounds (mainly alcohols and organic acids) dominated the PM composition at 45 and 31%, respectively. PAHs, hopanes, and steranes were in the range of 6–9%, and nitroPAHs and oxyPAHs were 1%. The total measured particle-phase emissions of semi-volatile compounds were 7.5 μg/bhp-hr, representing only 1.4% of the OC measured by the OC/EC method.
Figure 4. Average particle-phase semi-volatile emissions rate and composition for all 12 repeats of the 16-hr cycles using all four 2007 ACES engines. Particle-phase semi-volatiles were collected from the full-flow CVS.
Differences between the OC and the particle-phase semi-volatile collection may help explain the lower particle-phase semi-volatile emissions. First, particle-phase semi-volatile compounds were collected on a Teflon filter (Zefluor) whereas the quartz filter was used for the OC/EC analyses. A quartz filter is known to have a higher gas-phase adsorption capacity than a Teflon filter. Second, particle-phase semi-volatiles were collected on a filter having an average filter face temperature in the range between 35 and 52 °C with a residence time of approximately 2 sec, whereas OC determined by the OC/EC method was collected at an ambient temperature of 25 °C from an exposure chamber having a residence time of 4 min. The higher filter face temperature and lower residence time favor less collection of particle-phase material. For example, the PM emission rate based on a Teflon filter used on the full-flow CVS at a filter face temperature of 47 °C and a residence time of approximately 2 sec was 50% lower than that reported based on the exposure chamber collection. On the analytical side, the SVOCs included an unresolved complex mixture with its mass not being reported. This may also explain part of the discrepancy between the measurement of particle-phase semi-volatiles and the OC using the OC/EC method.
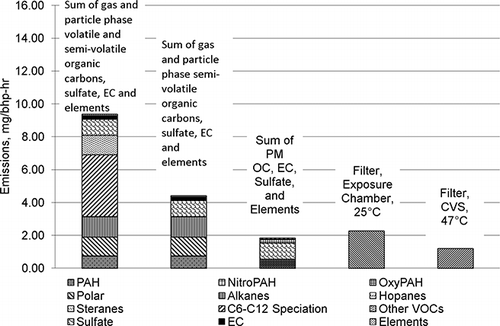
Essentially, there is different partitioning between gas- and particle-phase semi-volatiles in engine laboratory testing depending on the dilution and cooling process, DR, temperature, and residence time, with some added complexities associated with the filter collection methods that are related to the filter media, filter face temperature, and filter face velocity. The total measured gasand particle-phase semi-volatile emissions were 3.14 mg/hp-hr, a factor of 418 higher than the particle-phase semi-volatiles reported in and a factor of 5.6 higher than the OC reported in . If one adds to the semi-volatiles the sum of measured hydrocarbon species (C2–C12) with a boiling point greater than 80 °C and other volatile organic carbons such as nitromethane, the total measured emissions of OC materials will increase to 8 mg/hp-hr, a factor of 14 higher than the OC measured by the OC/EC method. This is also a factor of 3.5 higher than the total PM based on weighed filters collected from the exposure chamber, and a factor of 7 higher than the total PM based on the CFR method.
shows a comparison between the filter-based collection and weighing method and the sum of gas- and particle-phase organic and inorganic materials measured using different scenarios. illustrates the discrepancies that can arise at low emissions levels when definitions of PM and the measurement methods do not self-consistently distinguish species that can act as gases or particles. The emission rate sum of measured gas-phase volatile and SVOCs (boiling point of 80 °C) and particle-phase chemical composition collected by the filter (including volatile and SVOCs, sulfate, EC, and elements) was a factor of 4 higher than the emissions based on exposure chamber filter collection and weighing. It was also a factor of 9 higher than the emissions based on CVS filter collection and weighing following CFR Part 1065. These results indicate that there are substantial amounts of materials measured in the gas phase compared with particle phase, mainly because of the sample and dilution method. For example, if 0 °C was used for exhaust dilution instead of 25 °C, and/or instead of the high-efficiency particulate air (HEPA) dilution air used in this work, and one uses ambient air containing particles, then the partitioning between particle and gas phase will likely be different from what has been observed in this work. This subject of partitioning between the gas and particle phase deserves more research. The laboratory method in accordance with CFR Part 1065 is operationally defined. It specifies a minimum DR between 5 and 7, a residence time greater than 0.5 sec and less than 5 sec, a filter face velocity of 100 cm/sec, and a filter face temperature of 47± 5 °C. When deviating from these defined variables and/or when different methods are used to measure or determine PM, one expects to obtain different results, particularly with engines such as the 2007 ACES engines, in which a large fraction of the PM is volatile. It is beyond the scope of this work to investigate how PM should be measured in the laboratory to reflect PM emissions to the atmosphere.
Particle Number and Size
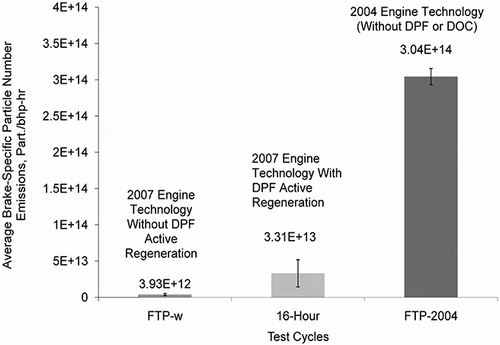
Phase 1 2007 ACES engine particle number and size distribution data were based on measurement of total (solid plus volatile) particles in the size range from 5.6 to 560 nm using the EEPS. Measurements were taken from the exposure chamber during the FTP and the 4-hr segments of the 16-hr cycle with and without C-DPF active regeneration. The 2004-technology engine particle size and number data were based on data generated by SwRI on a 2004 heavy-duty diesel engine, similar to one of the ACES engines but without a DOC and a C-DPF. The 2004-technology engine was also operated on ULSD fuel with a sulfur content of 1 ppm. The 2004 engine data were measured from the full-flow CVS for the FTP transient cycle using the EEPS. The dilution profile and temperatures were similar to those of the ACES engines, but the residence time was 3 sec, much shorter than the 4-min residence time in the exposure chamber. shows the average brake-specific particle number emissions for 2007 and 2004-technology engines on the basis of data collected using the EEPS. For 2007 engines, the average total particle number emissions for the FTP transient cycle without active regeneration were 88% lower than those for the 16-hr cycle with active regeneration and 99% lower than those for the FTP of a 2004-technology engine. Because the operation of 2007-technology engines must include infrequent active C-DPF regeneration events, the average number emissions based on the 16-hr cycle accurately reflect the overall emissions from these technology engines because it has one or two active regeneration events. Nevertheless, even with the 16-hr cycle including C-DPF active regeneration, the average particle number was still 89% lower than that emitted from 2004-technology engines.
Figure 6. Average particle number emissions comparison between the 2007 ACES engines with and without C-DPF regeneration and a 2004-technology engine. Data for the 2007 ACES engines were based on 12 repeats of the FTP transient cycle and 12 repeats of the 16-hr cycle using all four ACES engines. Data for the 2004-technology engine were based on six repeats of the FTP transient cycle. Data for the 2007 ACES engines were taken from exposure chamber and from full-flow CVS for the 2004-technology engine.
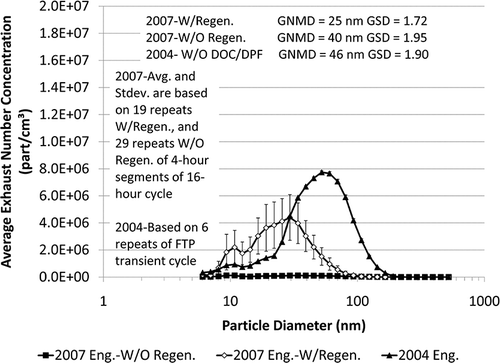
The average number-weighted size distribution is shown in for the case with and without active C-DPF regeneration using 19 4-hr segments with regeneration and 29 4-hr segments without regeneration. The data are also compared with the average size distribution of the 2004-technology engine used in . The number mean diameter for the case with regeneration is 25 nm compared with 40 nm for the case without regeneration and with 46 nm with the 2004-technology engine. Note that for particles larger than 30 nm, total particle number with the 2004-technology engine is higher than those reported for the ACES engine with and without regeneration. For particles below 30 nm, the number emission is comparable between the ACES engines during regeneration and the 2004-technology engine. However, it is important for the reader to keep in mind that the 2004-technology engine number emission, particularly nuclei-mode volatile particles, could have been higher if the measurement was taken from the exposure chamber and if the fuel sulfur content was higher.
Figure 7. Average size distribution comparison between all 2007 ACES engines with and without C-DPF regeneration and a 2004-technology engine without a DOC and/or a C-DPF. Data for the 2007 ACES engines were taken from the exposure chamber for the 4-hr segments of the 16-hr cycle. Data for the 2004 engine were taken from the full-flow CVS for the FTP transient cycle. GNMD= geometric number mean diameter, GSD= geometric standard deviation.
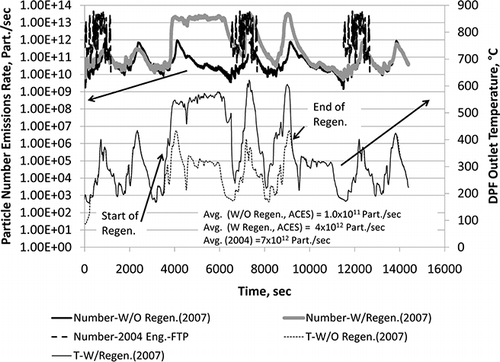
shows the particle number emissions profile for one of the 2007 ACES engines during 4-hr segments of the 16-hr cycle with and without C-DPF active regeneration. This was compared with the 2004-technology engine during the FTP transient cycle. Each repeated 4-hr segment of the 16-hr cycle contains three FTP transient cycles that start at 0, 6500, and 11,500 sec. For the 2004-technology engine, number data were plotted at time periods that coincided with the 2007 engine's FTP portions of the 4-hr segment of the 16-hr cycle. The real-time data show that there is an approximate 1 order of magnitude increase in particle number when the exhaust temperature reaches 400 °C, and there is a substantial increase in particle number when the temperature exceeds 400 °C during active C-DPF regeneration. The increase in particle number for events without active regeneration remained lower than the 2004 technology particle number, but the increase in particle number during active regeneration was comparable to that of a 2004-technology engine. However, it is important to note that the long residence time in the exposure chamber of approximately 4 min serves as an integrator that may have clipped the peak concentration of the 2007 engine, compared with the 2004 engine data that were measured with a much shorter residence time of 3 sec.
Figure 8. Example of particle number emissions and C-DPF outlet temperature during two separate 4-hr segments of the 16-hr cycle with and without C-DPF active regeneration using one of the ACES engines. Plotted also for comparison are the number emissions from a 2004-technology engine without DOC/C-DPF using the FTP transient cycle. The same FTP data with the 2004-technology engine are plotted in three separate locations to coincide with the FTP transient cycle that is part of the 4-hr segment of the 16-hr cycle.
shows that the number emissions from the 2007 engines were dominated mainly by nuclei-mode sub-30-nm particles, particularly during active regeneration, when the number of sub-30-nm particles represents more than 80% of the total particle number. The nature of particles emitted during C-DPF active regeneration can be inferred to be mainly volatile particles. This can be observed as shown in by comparing real-time total particle mass using the EEPS with soot mass using the MSS during C-DPF active regeneration. The MSS is a photoacoustic instrument that measures the mass of black carbon or soot particles. The EEPS measures total particle size and number. The EEPS data were converted into mass assuming spherical particles with a unit density of 1 g/cmCitation3 to look at the trend of the total mass emissions compared with soot mass. The accuracy of the EEPS mass, using the above assumption, and how it compares with other mass measuring techniques deployed on this program deserves a separate paper devoted to such a topic.
Figure 9. Nuclei-mode particle number in the sub-30-nm size range plotted as a percentage of total particle number during a 4-hr segment of the 16-hr cycle with active C-DPF regeneration. Data are similar to the data shown in for the ACES engine with active regeneration but are plotted as the percentage of total number for sub-30-nm particles.
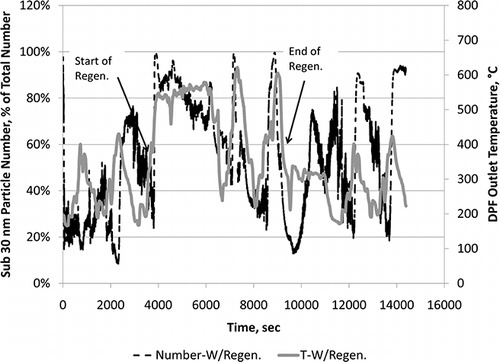
Figure 10. Total and soot particle mass emissions rate profile during a 4-hr segment of the 16-hr cycle with C-DPF active regeneration
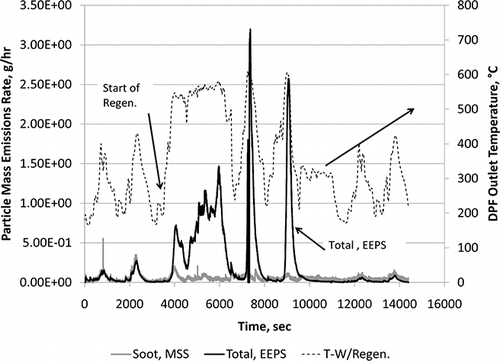
shows a substantial increase in total particle mass compared with soot mass during active regeneration, suggesting that most particles formed during active regeneration are volatile in nature. This is also consistent with the PM composition that was dominated by sulfate and OC. Because of the large increase in exhaust temperature (∼600 °C) during C-DPF active regeneration, sulfate stored on the surface of the DOC/C-DPF may be released to the exhaust stream. This may contribute to the rise of volatile nanoparticles through sulfuric acid nucleation and growth during dilution and cooling.Citation28,Citation29 Storage and release of volatile hydrocarbon material from the surface of the C-DPF and exhaust system downstream may contribute to the increase in the number of volatile nanoparticle formation and growth.Citation30 Previous work showed that it can take several hours of high-temperature engine operation to purge the exhaust and sample system of the material that can contribute to higher emissions of volatile mass.Citation31 Storage and release can even occur without C-DPF active regeneration. For example, in , more than a 10-fold increase in particle number can be observed when the exhaust temperature exceeded 400 °C for the case without active regeneration, and for the case with active regeneration but before exhaust fuel injection, in which the exhaust temperature was very similar to that without active regeneration. also shows that during a temperature increase of normal engine operation before exhaust fuel injection, the sub-30-nm particle number increased from 10 to 70% of the total particle number, further supporting the hypothesis of the increase in volatile nanoparticles due to the storage and release phenomenon.
Note also for the case without active regeneration in , there is a volatile nuclei mode in the sub-30-nm size range with a concentration level similar to that of the accumulation mode at 40 nm. This mode could be related to multiple short events of storage and release processes that occurred under normal increases in engine exhaust temperature during the 16-hr transient operation without active regeneration. For example, showed that between 0 and 3000 sec, before any active regeneration, there was a rise in sub-30-nm particles from 10 to 70% of the total particle number. Because of a much lower mass of volatile material in the exhaust downstream of the C-DPF for the case without active regeneration compared with active regeneration, it is hypothesized that the nucleation and growth process was limited during exhaust dilution and cooling because of the lack of available material. However, the nucleation and growth process was sufficient to produce nuclei-mode particles in the sub-30-nm size range that have an equal weighting to the accumulation-mode particles with a mean diameter at 40 nm. Recent modeling work showed that particle nucleation during exhaust dilution and cooling can take place using ULSD fuel with a catalyzed C-DPF,Citation32 but with limited growth, when the exhaust temperature is sufficient to promote the conversion and release of sulfate. The formation of nuclei-mode particles in the sub-30-nm particle size range coincides with an exhaust temperature that is peaking at 400 °C. This temperature enhances the conversion of sulfur dioxide to sulfur trioxide by exhaust oxidation catalysts.Citation33 Volatile particle formation and growth depend strongly on the dilution process.Citation31,Citation34 The data reported during this portion of the ACES work were collected from an exposure chamber with a residence time of approximately 4 min at a temperature of approximately 25 °C. Using different residence times and/or different temperatures may produce fewer or more particles, depending upon ambient conditions.Citation31,Citation34 The long residence time used in this work typically promotes particle growth and reduces the number of sub-30-nm particles because of growth into larger particles by volatile adsorption/condensation or by loss to the wall of the exposure chamber via particle diffusion.Citation31,Citation34 Furthermore, the long chamber residence time, particularly under transient engine operation, serves as an integrator before particles are measured by the instruments. The actual instantaneous particle number concentration at similar DRs but with shorter residence time may produce much higher instantaneous peaks than those reported with the exposure chamber. Thus, the exposure chamber may reduce sharp peaks in particle concentration dynamics during actual animal exposure in phase 3 of ACES because of the long residence time. Currently, there is no protocol for the measurement of total particle number and size from engine exhaust in ways representative of atmospheric dilution. The subject is still being debated and discussed among the scientific community.
CONCLUSIONS
Phase 1 of the ACES program included a comprehensive characterization of regulated and unregulated species emitted from 2007-technology engines that utilized an exhaust C-DPF. All four ACES engines tested along with the C-DPFs were new with only 150 hr of engine operation before emissions testing. Except for NO2, very substantial reductions in average regulated and unregulated emissions were observed from 2007-compliant highway heavy-duty diesel engines compared with pre-2007 highway diesel engine emissions. Regulated emissions of NMHCs, CO, and PM were on average 89, 97, and 86% less than the EPA 2007 certification standard, respectively, and NOx emissions were on average 9% less than the standard. Total unregulated exhaust emissions that included inorganic ions, single-ring aromatics, PAHs, nitroPAHs, alkanes, alcohol and organic acids, hopanes/steranes, carbonyls, metals and elements, OC, EC, and dioxins/furans were 71–99% less than the corresponding emissions from 2004 technology heavy-duty highway engines. Substantial reductions in CARB-defined toxic air contaminants, individual PAH and nitroPAH compounds, and elements also were reported relative to 1994- to 2000-technology engines. The reductions ranged from 59% to more than 99%.
The average NO2 emission rates were 1.3 and 2.8 times higher than the levels emitted by 1998- and 2004-technology engines, respectively. The stringent 2010 NOx regulatory limit will force NO2 emissions to be much lower with 2010 heavy-duty highway engines compared with pre-2010 highway engines. The average NO2/NOx ratio from the 2007-compliant ACES engines was 61% compared with a ratio of 14% for 1998 engines during the FTP transient cycle.
The average PM emission for the 16-hr cycle, including infrequent C-DPF active regeneration, is composed of 53% sulfate and 30% OC with only 13% EC and 4% elements. Elemental composition (except sulfur) was dominated by sodium (31%), iron (19%), phosphorus (17%), calcium (14%), and zinc (3%). Phosphorus, calcium, and zinc were measured in the lube oil and fuel, and sodium was measured in the fuel. The presence of these elements in the ULSD fuel was due to refinery and/or fuel transportation contamination. Eliminating or reducing contamination of these elements from ULSD fuel should result in lower emissions. It should also extend the lifetime of the C-DPF before plugging because most of these elements are expected to be captured by the C-DPF.
Measured particle-phase semi-volatiles were dominated by alkanes (45%), alcohols and organic acids (31%), hopanes (9%), PAHs (8%), steranes (6%), nitroPAHs (1%), and oxyPAHs (1%). The measured particle-phase semi-volatiles were only 1.4% of the OC measured using the OC/EC method. Partitioning between the gas phase and the particle phase because of filter media and dilution and sampling differences may have led to this discrepancy, particularly because total semi-volatiles (gas plus particle phase) can be as much as a factor of 5.6 higher than the measured OC using the OC/EC method.
Active C-DPF regenerations led to 1 order of magnitude increases in cycle-average particle number emissions compared with cycles without regeneration, although their occurrence was infrequent. However, even with the particle number increase during C-DPF active regenerations, the average particle number emission rates were still 1 order of magnitude lower than the average rates from a typical 2004-technology engine. Exposure chamber real-time total particle number emissions during active regeneration were comparable to those observed with 2004-technology engines. However, the long residence time in the exposure chamber may have reduced the peak concentration levels observed with the 2007 engines, compared with the levels reported with the 2004-technology engine using a much shorter residence time. Most particle number increases during active regeneration occurred for volatile nuclei-mode particles in the sub-30-nm size range. Sulfate formation and the release of volatile materials from the exhaust system at temperatures exceeding 400 °C during active regeneration may have contributed to nanoparticle nucleation and growth during dilution and cooling. However, as of today, there is no standard protocol for measuring total (solid plus volatile) particle number and size emitted from engines, and the volatile particle number emissions reported in this work may not fully represent what occurs in the real world.
ACKNOWLEDGMENTS
The financial support from the U.S. Department of Energy (DOE) Office of Vehicle Technologies (Dr. James Eberhardt) through the National Renewable Energy Laboratory (NREL) and the Engine Manufacturers Association (EMA) is acknowledged for supporting the efforts to write this paper. Phase 1 of the ACES was coordinated by CRC and the Health Effects Institute (HEI), with funding from the DOE Office of Vehicle Technologies, EPA, EMA, CARB, API, Corning, Inc., and ArvinMeritor. Caterpillar, Cummins, Detroit Diesel, and Volvo Powertrain provided the engines and engine support. Key contacts were Reynaldo Agama, Caterpillar; Dr. Shirish Shimpi, Cummins; Don Keski-Hynnila, Detroit Diesel; and Steve Berry, Volvo Powertrain. Lubrizol provided the lube oil, and the key contact was Dr. Ewa Bardasz. The authors also acknowledge the following CRC ACES panel members for their comments and feedback on this paper and throughout phase 1 of the ACES: Reynaldo Agama, Caterpillar; Dr. James Ball, Ford Motor Company (now retired); Brent Bailey, CRC; Dr. Nicholas Barsic, John Deere; Steve Berry, Volvo Powertrain; Dr. Steven Cadle, General Motors R&D Center (now retired); Dr. Maria Costantini, HEI; Dr. James Eberhardt, DOE Office of Vehicle Technologies; Dr. Annemoon van Erp, HEI; Timothy French, Engine Manufacturers Association; Dan Greenbaum, HEI; Dr. Thomas Hesterberg, Navistar; Donald Keski-Hynnila, Detroit Diesel; Christopher Laroo, EPA; Dr. Douglas Lawson, NREL; Hector Maldonado, CARB; Dr. Matti Maricq, Ford Motor Company; Dr. Mani Natarajan, Marathon Petroleum Company, LLC; Ralph Nine, DOE/NREL; Dr. Robert Okamoto, CARB; Charles Schleyer, ExxonMobil; Dr. Shirish Shimpi, Cummins; Dr. Joseph Somers, EPA; Dr. Chris Tennant, CRC; Steve Trevitz, Volvo Powertrain; Dr. Timothy Wallington, Ford Motor Company; Dr. Urban Wass, Volvo AB; and Dr. Jane Warren, HEI (now retired).
REFERENCES
- Emission Standards for 1994 and Later Model Year Diesel Heavy-Duty Engines and Vehicles. CFR, Part 86.094-11, Title 40, 2003.
- Johnson , T.V. 2007 . Diesel Emissions Control in Review. Society of Automotive Engineers (SAE) Paper 2007-01-0233 , Warrendale , PA : SAE .
- Khalek, I.A.; Bougher, T.; Merritt, P. Phase 1 of the Advanced Collaborative Emissions Study; Coordinating Research Council (CRC) Report ACES-Phase 1; CRC: Alpharetta, GA, 2009 http://www.crcao.org/publications/emissions/index.html (http://www.crcao.org/publications/emissions/index.html) (Accessed: 2010 ).
- Greenbaum, D.; Costantini, M.; Van Erp, A.; Tennant, C. Advanced Collaborative Emissions Study; Diesel Forum Webinar, 2009 http://www.dieselforum.org (http://www.dieselforum.org) (Accessed: 2010 ).
- Electronic Code of Federal Regulations, Title 40 Protection of the Environment, Vol. 15, Part 1065 http://ecfr.gpoaccess.gov (http://ecfr.gpoaccess.gov) (Accessed: 2010 ).
- Bailey , B. 2009 . Coordinating Research Council , Alpharetta , GA : Personal Communication .
- Walter , O. , Richert , J. , Jensen , T , Schuetzle , D. , Swarin , S. , Loo , J. , Prostak , A. , Nagy , D. and Schlenker , A. Improved Emissions Speciation Methodology for Phase II of the Auto/Oil Air Quality Improvement Research Program–Hydrocarbons and Oxygenates. Society of Automotive Engineers (SAE) Paper 930142 , 1993 Warrendale , PA : SAE .
- Clark, N.; Zhen, F.; Bedick, C.; Gautam, M.; Wayne, W.; Thompson, G.; Lyons, D. Creation of the 16-Hour Engine Test Schedule from the Heavy Heavy-Duty Diesel Engine Test Schedule; Coordinating Research Council (CRC) Report ACES-1a; CRC: Alpharetta, GA, 2007 http://www.crcao.org/publications/emissions/index.html (http://www.crcao.org/publications/emissions/index.html) (Accessed: 2010 ).
- Clark, N.; Gautam, M.; Wayne, W.; Thompson, G.; Lyons, D.; Zhen, F.; Bedick, C.; Atkinson, R.; McKain, D. Creation of the Heavy Heavy-Duty Diesel Engine Test Schedule for Representative Measurement of Heavy-Duty Engine Emissions; Coordinating Research Council (CRC) Report ACES-1; CRC: Alpharetta, GA, 2007 http://www.crcao.org/publications/emissions/index.html (http://www.crcao.org/publications/emissions/index.html) (Accessed: 2010 ).
- Zhen , F. , Clark , N. , Bedick , C. , Gautam , M. , Wayne , W. , Thompson , G. and Lyons , D. 2009 . Development of a Heavy Heavy-Duty Diesel Engine Schedule for Representative Measurement of Emissions . Journal of the Air & Waste Management Association , 59 : 950 – 959 . doi: 10.3155/1047-3289.59.8.950
- Bedick , C. , Clark , N. , Zhen , F. , Atkinson , R. and McKain , D. 2009 . Testing of a Heavy Heavy-Duty Diesel Engine Schedule for Representative Measurement of Emissions . Journal of the Air & Waste Management Association , 59 : 960 – 971 . doi: 10.3155/1047-3289.59.8.960
- Test Report of Mobile Source Emission Control Devices: Johnson Matthey PCRT2® 1000, Version 2, Filter+ Diesel Oxidation Catalyst; U.S. Environmental Protection Agency (EPA) Environmental Technology Verification; 2009 http://www.epa.gov/etv (http://www.epa.gov/etv) (Accessed: 2010 ).
- Test Report of Mobile Source Emission Control Devices: Donaldson Series 6100 Diesel Oxidation Catalyst Muffler; U.S. Environmental Protection Agency (EPA) Environmental Technology Verification; 2003 http://www.epa.gov/etv (http://www.epa.gov/etv) (Accessed: 2010 ).
- Clark, N.; Gautam, M.; Wayne, W.; Lyons, D.; Thompson, G.; Zielinska, B. Heavy-Duty Vehicle Chassis Dynamometer Testing for Emissions Inventory, Air Quality Modeling, Source Apportionment and Air Toxics Emissions Inventory; Coordinating Research Council (CRC) Report RE55/E59; CRC: Alpharetta, GA, 2007 http://www.crcao.org/publications/emissions/index.html (http://www.crcao.org/publications/emissions/index.html) (Accessed: 2010 ).
- An Inventory of Sources and Environmental Releases of Dioxin-Like Compounds in the United States for the Years 1987, 1995, and 2000; U.S. Environmental Protection Agency; National Center for Environmental Assessment; Office of Research and Development: Washington, DC, 2006 http://www.epa.gov/ncea/pdfs/dioxin/2006/dioxin.pdf (http://www.epa.gov/ncea/pdfs/dioxin/2006/dioxin.pdf) (Accessed: 2010 ).
- Ullman , T. , Smith , L. , Anthony , J. , Slodowske , W. , Trestrail , B. , Cook , A. , Bunn , W. , Lapin , C. , Wright , K. and Clark , C. 2003 . Comparison of Exhaust Emissions, Including Toxic Air Contaminants, from School Buses in Compressed Natural Gas, Low Emitting Diesel, and Conventional Diesel Engine Configurations. Society of Automotive Engineers (SAE) Paper 2003-01-1381 , Warrendale , PA : SAE .
- Merritt, P. Diesel Exhaust Standard Phase 1; Coordinating Research Council (CRC) Report AVFL-10A; CRC: Alpharetta, GA, 2003 http://www.crcao.org/publications/emissions/index.html (http://www.crcao.org/publications/emissions/index.html) (Accessed: 2010 ).
- Liu , Z. , Berg , D. and Schauer , J. 2008 . Effects of a Zeolite-Selective Catalytic Reduction System on Comprehensive Emissions from a Heavy-Duty Diesel Engine . Journal of the Air & Waste Management Association , 58 : 1258 – 1265 . doi: 10.3155/1047-3289.58.10.1258
- Tang , S. , Frank , B. , Lanni , T. , Eout , G. , Meyer , N. and Beregszaszy , C. 2007 . Unregulated Emissions from a Heavy-Duty Diesel Engine with Various Fuels and Emission Control Systems . Environ. Sci. Technol. , 41 : 5037 – 5043 .
- Khalek , I.A. 2004 . Nitro-PAH Artifact Investigation; Contract No. ACI–4–44029–01 , Golden , CO : Final Report Prepared by Southwest Research Institute for the National Renewable Energy Laboratory .
- 2002 . “ Chemical Methods for the Measurement of Nonregulated Diesel Emissions ” . In Society Automotive Engineers (SAE) J1936 , Warrendale , PA : SAE .
- Birch , M. and Cary , R. 1996 . Elemental Carbon-Based Method for Monitoring Occupational Exposures to Particulate Diesel Exhaust . J. Aerosol Sci. Technol. , 25 : 221 – 241 .
- Chow , J. , Watson , J. , Pritchett , L. , Pierson , W. , Frazier , C. and Purcell , R. 1993 . The DRI Thermal/Optical Reflectance Carbon Analysis System: Description, Evaluation and Applications in US Air Quality Studies . Atmos. Environ. , 27 : 1185 – 1201 .
- Chow , J. , Watson , J. , Chen , L. , Arnott , W. , Moosmüller , H. and Fung , K. 2004 . Equivalence of Elemental Carbon by Thermal/Optical Reflectance and Transmittance with Different Temperature Protocols . Environ. Sci. Technol. , 38 : 4414 – 4422 .
- McDonald , J. , Osborne , D. and Khalek , I. 2009 . The Composition of Particulate Matter Emissions from Two Tier 2 Locomotives; 2009-A-425-AWMA , Pittsburgh , PA : A&WMA .
- Khalek, I.A. 2007 Diesel Particulate Measurement Research; Coordinating Research Council (CRC) Report E-66 Phase 1; CRC: Alpharetta, GA, 2005 http://www.crcao.org/publications/emissions/index.html (http://www.crcao.org/publications/emissions/index.html) (Accessed: 2010 ).
- Pitchford , M. , Malm , W. , Schichtel , B. , Kumar , N. , Lowenthal , D. and Hand , J. 2007 . Revised Algorithm for Estimating Light Extinction from IMPROVE Particle Speciation Data . Journal of the Air & Waste Management Association , 57 : 1326 – 1336 . doi: 10.3155/1047–3289.57.11.1326
- Khalek , I.A. , Kittelson , D. and Brear , F. 2000 . Nanoparticle Growth during Dilution and Cooling of Diesel Exhaust: Experimental Investigation and Theoretical Assessment. Society of Automotive Engineers (SAE) Paper 2000-01-0515 , Warrendale , PA : SAE .
- Swanson , J. , Kittelson , D. , Watts , W. , Gladis , D. and Twigg , M. 2009 . Influence of Storage and Release on Particle Emissions from New and Used CRTs . Atmos. Environ. , 43 : 3998 – 4004 .
- Khalek , I.A. , Kittelson , D. and Brear , F. 1998 . Diesel Trap Performance: Particle Size Measurements and Trends. Society of Automotive Engineers (SAE) Paper 982599 , Warrendale , PA : SAE .
- Khalek, I.A. 2007 Diesel Particulate Measurement Research; Coordinating Research Council (CRC) Report E-66 Phase 2; CRC: Alpharetta, GA, 2006 http://www.crcao.org/publications/emissions/index.html (http://www.crcao.org/publications/emissions/index.html) (Accessed: 2010 ).
- Du , H. and Yu , F. 2008 . Nanoparticle Formation in the Exhaust of Vehicles Running on Ultra-Low Sulfur Fuel . Atmos. Chem. Phys. , 8 : 4729 – 4739 .
- Henk , M.G. , Williamson , W.B. and Silver , R.G. 1992 . Diesel Catalysts for Low Particulate and Low Sulfate Emissions. Society of Automotive Engineers (SAE) Paper 920368 , Warendale , PA : SAE .
- Khalek , I.A. , Kittelson , D. and Brear , F. 1999 . The Influence of Dilution Conditions on Diesel Exhaust Particle Size Distribution Measurements. Society of Automotive Engineers (SAE) Paper 1999-01-1142 , Warrendale , PA : SAE .