ABSTRACT
Although it is much safer and more fuel-efficient to transport children to school in buses than in private vehicles, school buses in the United States still consume 822 million gal of diesel fuel annually, and school transportation costs can account for a significant portion of resource-constrained school district budgets. Additionally, children in diesel-powered school buses may be exposed to higher levels of particulates and other pollutants than children in cars. One solution to emission and fuel concerns is use of hybrid-electric school buses, which have the potential to reduce emissions and overall lifecycle costs compared with conventional diesel buses. Hybrid-electric technologies are available in the passenger vehicle market as well as the transit bus market and have a track record indicating fuel economy and emissions benefits. This paper summarizes the results of an in-use fuel economy evaluation for two plug-in hybrid school buses deployed in two different school districts in Iowa. Each school district selected a control bus with a route similar to that of the hybrid bus. Odometer readings, fuel consumption, and maintenance needs were recorded for each bus. The buses were deployed in 2008 and data were collected through May 2010. Fuel consumption was calculated for each school district. In Nevada, IA, the overall average fuel economy was 8.23 mpg for the hybrid and 6.35 mpg for the control bus. In Sigourney, IA, the overall average fuel economy was 8.94 mpg for the hybrid and 6.42 mpg for the control bus. The fuel consumption data were compared for the hybrid and control buses using a Wilcoxon signed rank test. Results indicate that fuel economy for the Nevada hybrid bus was 29.6% better than for the Nevada control bus, and fuel economy for the Sigourney hybrid bus was 39.2% higher than for the Sigourney control bus. Both differences were statistically significant.
The results of the research presented in this paper can be readily used by school districts and policy-makers who are interested in purchasing hybrid school buses. Very little information about actual on-road fuel consumption or costs is available. Because the cost of a hybrid bus can be significantly more than the cost of a conventional bus, the information provided in this paper can be very useful for an agency to determine the costs and benefits of a hybrid bus. The information is also useful to researchers who are studying hybrid school and transit buses.
INTRODUCTION
There are over 480,000 school buses in the United States, which transport 26 million children to school and result in 5.76 billion mi of travel per year.Citation1 Transporting children in school buses is significantly saferCitation2 and more fuel-efficient than transportation in private passenger vehicles. For example, the American School Bus CouncilCitation1 estimates that if children who customarily ride the school bus took those school trips in private vehicles, the school trips would consume an additional 2.3 billion gal of fuel.
Although school bus travel is much safer and more fuel-efficient than private vehicle transportation, school buses consume 822 million gal of diesel fuel annually,Citation1 and school transportation costs can account for a significant portion of resource-constrained school districts’ budgets. Additionally, school buses emit thousands of tons of pollutants per year,Citation1 and school children transported by bus spend an average of 1.5 hr/day on school buses that are primarily diesel powered.Citation3,Citation4 One source measured on-board emissions in Connecticut school buses and found that PM2.5 (particulate matter [PM] ≤ 2.5 μm in aerodynamic diameter) emissions were 5–10 times higher than at fixed-site monitoring sites.Citation5 Additionally, Adar et al.Citation6 collected on-board concentrations of PM2.5 on 43 school buses during in-use driving in the state of Washington. They reported that average PM2.5 concentration levels were 2 times higher than levels on corresponding roadways. This is problematic because diesel exhaust affects children with respiratory problems, such as asthma and bronchitis.
Once solution to emission and fuel concerns is the use of hybrid-electric school buses, which have the potential to reduce emissions and overall lifecycle costs compared with conventional diesel buses. Although not previously available in school buses, hybrid technology has been demonstrated in passenger vehicles and transit buses. Transit buses have used hybrid technology for some time and have overall shown significant fuel economy and emissions improvements over conventional buses.
Hybrid Performance in the Transit Market
Chandler et al.Citation7 conducted chassis dynamometer tests for 10 low-floor plug-in hybrid buses and 14 conventional high-floor diesel transit buses run by the New York City Transit (NYCT). The buses were tested over three driving cycles: the Central Business District (CBD), New York bus cycle, and the Manhattan cycle. The operating costs, efficiency, emissions, and overall performance were also compared while both types of buses were operating on similar routes. Data were collected from 1999 to 2001.
Results indicate that for the CBD cycle, emissions for the hybrid transit buses were 97% lower for carbon mon-oxide (CO), 36% lower for nitrogen oxides (NOx), 43% lower for hydrocarbons (HCs), 50% lower for PM, and 19% lower for carbon dioxide (CO2). Fuel economy in miles per gallon was reported as 23% higher for the hybrid buses. Results from the New York bus cycle showed a decrease of 56% for CO, 44% for NOx, 77% for PM, and 40% for CO2 for the hybrid buses. However, HC emissions increased by 88% for the hybrid buses. Hybrid buses on the New York bus cycle had 64% higher fuel economy. With the Manhattan cycle, the researchers found a decrease in CO of 98%, NOx of 44%, HC of 28%, PM of 99%, and CO2 of 33%. The fuel economy was 48% higher for the hybrid buses.
Emissions tests for one diesel hybrid-electric bus and two diesel buses (Orion V, with and without catalyzed diesel particulate filters [DPFs]) were evaluated using a dynamometer in Ottawa, Canada.Citation8 The buses were tested on the CBD cycle using ultralow sulfur diesel no. 1 fuel. The researchers indicated that the hybrid bus had 94% lower emissions for CO, 49% lower emissions for NOx, 120% higher emissions for HC, 93% lower emissions for PM, and 37% lower emissions for CO2 than the diesel bus without a catalyzed DPF. Fuel economy for the hybrid bus was 54% higher. Emissions for the hybrid bus compared with the diesel bus with catalyzed DPF installed were 38% lower for CO, 49% lower for NOx, 450% higher for HC, 60% lower for PM, and 38% lower for CO2. Fuel economy for the hybrid bus was 59% higher than for the conventional bus with a catalyzed DPF. Tests were conducted in February 2000. Although the authors did not state the reason for the increase in HC, it may be because HC emissions are typically low for diesel engines and as a result small relative changes can result in large percentage changes. Additionally, because HC emissions are low, changes may be within the error for the measuring systems and as a result, the change may not be meaningful.
In another study, two buses (one from a conventional diesel fleet and another from a hybrid fleet) were tested using a dynamometer at the National Renewable Energy Laboratory's ReFUEL facility in Golden, CO.Citation9 The buses were tested over several drive cycles including Manhattan, Orange County Transit A, CBD, and King County Metro (KCM). Tests were conducted in May and June 2005. Depending on the drive cycle, CO emissions were 32–59.5% lower, NOx emissions were 17.8–28.7% lower, and HC emissions were not statistically different for the Manhattan and OCTA cycles but were 56.3 and 75.2% lower for the CBD and KCM drive cycles, respectively. PM emissions were not statistically different for the hybrid bus as compared with the conventional bus for the KCM cycle but were 50.8–97.1% lower for the other cycles. CO2 emissions were 34.8% higher for the CBD cycle but were 24.1–43.8% lower for the other driving cycles. Fuel economy was 30.3–74.6% higher for the hybrid bus compared with the conventional buses.
Clark et al.Citation10 evaluated six transit buses with traditional diesel engines, two powered by spark-ignited compressed natural gas (CNG), and one hybrid transit bus in Mexico City using a transportable heavy-duty emissions testing laboratory. Buses were tested over a driving cycle representative of Mexico City transit bus operation, which was developed using Global Positioning System (GPS) data from in-use transit buses. Depending on how emissions were compared, the hybrid bus and one of the CNG buses had the lowest NOx emissions of the nine buses tested. Particulate emissions from the hybrid bus were less than 10% of the average PM emissions for the diesel-powered buses. The hybrid bus and one of the CNG buses had the lowest CO emissions, and the hybrid bus and buses equipped with continuously regenerating technology (CRT) exhaust aftertreatment had HC emissions that were below the detectable limit of the instrument used. Depending on how fuel economy was evaluated, the hybrid bus ranked fourth and first in fuel economy.
Shorter et al.Citation11 used a chase vehicle sampling strategy to measure NOx from 170 in-use NYCT buses. The authors sampled emissions from conventional diesel buses, diesel buses with CRT, diesel hybrid-electric buses, and CNG buses. The authors found that NOx emissions from CNG buses and hybrid buses were comparable. NOx emissions for the hybrid buses were approximately one-half of those for conventional transit buses.
In contrast, Jackson and HolmenCitation12 collected second-by-second particle number (PN) emissions from four conventional and one hybrid transit bus in Connecticut over six predefined test routes that had multiple road types and ranges of driving conditions. For most of the routes, few differences were noted between the conventional and hybrid transit buses. However, the hybrid had higher emission rates on two routes with steep uphill grades, and PN emissions were 51% higher on one route and 24% higher on the other.
Results from Other Hybrid School Buses
The following describes results that have been reported from other sources for Hybrid-Electric School Bus Project (HESB) buses. EnovaCitation13 tested a plug-in hybrid school bus using a chassis dynamometer to evaluate fuel economy under controlled test conditions. The company used the West Virginia University Suburban Cycle (WVUSC) and Torrance California Test Cycle (TCTC). With the WVUSC, the researchers found that the hybrid bus had a fuel economy of 12.7 mpg, whereas a conventional bus used for comparison had a fuel economy of 7.1 mph (an 81% improvement). For the TCTC, the researchers found a 57% improvement in fuel economy for the hybrid bus, with 12.8 mpg for the hybrid and 8.1 mpg for the conventional bus.
GarabedianCitation14 compared a plug-in hybrid-electric school bus to a conventional school bus in Vermont using an on-road emissions tester over a 32-km route. It was estimated that the hybrid-electric school bus consumed 28.7% less fuel than a standard diesel school bus. It was also reported that NOx emissions were 49% lower for the hybrid-electric school bus than for the conventional school bus, CO emissions were 72% lower, and HC emissions were 49% lower.
Advanced EnergyCitation13 cited a study by M.J. Bradley & Associates that evaluated school buses for the New York Power Authority. The researchers collected data on a conventional charge-sustaining (hybrid) bus, a standard diesel control bus, and a charge-depleting (plug-in hybrid) bus. They measured fuel consumption for three test routes (urban, suburban, and rural) and found that the plug-in hybrid school bus had a fuel economy 51–131% higher than the other buses, depending on the test route. However, this was only observed while the hybrid-electric school bus operated in charge-depleting mode. Once it began operating in charge-sustaining mode, it performed similar to the conventional hybrid and diesel control buses.
The University of Texas compared a plug-in hybrid school bus to a control bus for the U.S. Department of Transportation. The study authors found that fuel economy for the conventional bus was 6.9 mpg, whereas fuel economy was 9 mpg for the hybrid-electric school bus (an increase of 30%). The researchers also reported that the control bus emitted approximately 63 kg of CO2 per day whereas the hybrid-electric school bus emitted 51 kg; when electricity regeneration to recharge batteries is included, this represents a reduction of 23.5%.Citation13
Advanced EnergyCitation13 conducted early tests using a chassis dynamometer to assess fuel economy under controlled conditions. They used the WVUSC and the TCTC route. Although not stated in the report, it is assumed that they tested one plug-in hybrid bus and one control bus. The plug-in hybrid had 81% better fuel economy on the WVUSC than the control bus (12.7 vs. 7.1 mpg). The plug-in hybrid had 57% better fuel economy on the TCTC route than the convention bus did (12.8 vs. 8.1 mph).
Advanced EnergyCitation13 has also been collecting in-use fuel economy data from each school district involved in the HSEB project across the United States. Advanced Energy's researchers have reported the fuel economy results shown in . However, the report does not state how the comparison was conducted; for example, whether outliers were removed or the data were screened to remove data points when the charging system was not functioning. As shown in the table, the hybrid buses have generally done better than the control buses, with one school district showing a 57% improvement. However, several school districts have shown worse fuel economy for the hybrid bus than for the control bus.
Table 1. Fuel economy comparison for hybrid and conventional school bus reported for HESB project
Fuel economy is significantly affected by driver driving style, school bus route where the bus is operated, and bus maintenance. After reviewing initial results, including maintenance information, Advanced EnergyCitation13 suggested that the fuel economy for plug-in hybrid school buses is affected by the following, and as a result the buses are best suited to routes with the following features:
| • | Short distances (the largest benefit is ∼30 mi after charge) | ||||
| • | Routes with 25- to 35-mph posted speed limits | ||||
| • | Frequent stops, which require regenerative braking that recharges the battery | ||||
Hybrid-Electric School Bus
Although the concept of hybrid-electric school buses was always promising, the technology was not commercially available in school buses before instigation of the HESB (http://www.advancedenergy.org/corporate/initiatives/heb) in 2006. The HESB was organized by Advanced Energy (http://www.advancedenergy.com), which first created an initiative to explore the technical and economic feasibility of bringing plug-in hybrid technology to the school bus market. Once the feasibility studies were completed, Advanced Energy developed the basic bus design and formed a buyers’ consortium to provide a critical mass for investment in the concept.Citation13
The project was designed to bring hybrid school buses to market by creating enough demand among school districts to encourage a manufacturer to invest in the development of the technology.Citation15 Several school districts in the United States joined the HESB consortium to purchase plug-in hybrid-electric school buses. Sixteen hybrid-electric school buses were purchased and are being piloted in 11 states.
The Center for Transportation, Research, and Education (CTRE) at Iowa State University worked with the Iowa Energy Center (IEC) to solicit districts in Iowa to participate in the HESB. Two Iowa school districts— Nevada Community School District and Sigourney Community School District—volunteered. Their responsibilities included procuring the hybrid-electric school buses; operating the buses in general service; maintaining the buses; and recording fuel use, mileage, and other relevant information. Because the cost of the hybrid-electric school bus was significantly more than that of a conventional school bus, the IEC put together a funding package to offset the additional cost. Each school district purchased one bus. The Iowa hybrid-electric buses were unveiled in January 2008. Local press and others were invited to the unveiling.
The hybrid-electric school buses were manufactured by IC Bus, which was partnered with Enova (http://www.enova-systems.com), who developed the hybrid system. The school bus body is the same as that of a standard school bus. The plug-in hybrid-electric school bus specifications are as followsCitation13:
| • | 6.4-L, 210-hp diesel | ||||
| • | Hybrid system with plug-in capability | ||||
| • | Post-transmission parallel drive | ||||
| • | 80-kW electric motor | ||||
| • | 350-kWh lithium-ion phosphate battery pack | ||||
Both of the Iowa hybrid-electric school buses are 2009 International 65-passenger buses with an International MaxForce (V8) 6.4-L engine with an Allison automatic 2000 transmission. The hybrid function can be turned off so that the bus runs only on the internal combustion engine.
ANALYSIS
Data Collection
Because the hybrid technology was new to the school bus market, part of the HESB plan was to evaluate the hybrid buses. CTRE was funded by the IEC to conduct the evaluation for the two Iowa schools. As part of the evaluation, each school district was asked to select a control bus that was as similar as possible to the plug-in hybrid-electric school bus.
The Nevada control school bus was a 2009 Bluebird 65-passenger bus with a Cummins ISB07 engine (220-hp, Allison automatic GEN4, 2500PTS, TC 221). The Sigourney control bus was a 2005 Bluebird, 65-passenger with a Caterpillar C-7 (V6) engine (210 hp) with an Allison automatic 2000 transmission.
The Iowa school districts were asked to interchange the control bus with the hybrid-electric school bus at regular intervals to reduce the variability between the hybrid bus and the control bus. The widest sources of variability in emissions and fuel economy come from the route and the driver of the vehicle. By keeping a specific driver on a specific route and interchanging the buses biweekly, the level of variability could be minimized.
However, both school districts declined the request to interchange the buses. Districts typically keep the same bus and driver on a route for the entire school year. School children are taught to recognize the bus number and driver, and the districts felt that changes in bus and driver would confuse the children. Districts were also concerned that parents would complain about the lack of consistency. As a result, the control bus and hybrid-electric school bus were assigned to similar routes within each district and the buses were not interchanged.
The evaluation program included reporting several variables regarding the operation of each school bus so that various metrics could be compared between the two types of buses. Each time a bus was refueled, school districts were asked to record the following:
| • | Date | ||||
| • | Odometer reading | ||||
| • | Gallons of fuel added | ||||
| • | Fuel cost | ||||
| • | Kilowatt-hour reading (for the hybrid buses) | ||||
| • | Any problems encountered | ||||
To streamline the process, the CTRE team regularly obtained the information from the two school districts and entered the data through a webpage maintained by Advanced Energy. The school districts typically reported data from every 2 weeks to once a month. They reported the date, odometer reading, fuel used over the reporting period, fuel cost, and a kilowatt reading for the hybrid buses. Major maintenance issues and other notes were also recorded.
The hybrid buses were in use and evaluated from January 2008 to the end of May 2010. The Nevada control bus was selected in January 2008, and data were recorded until May 2010. The control bus in Sigourney was added in October 2008.
The Nevada School District is located in Nevada, IA, approximately 10 mi west of Ames, IA. The district has approximately 13 operational buses and transports around 828 school children per day. The district uses a 20% biodiesel blend. The blend amount varies, but the same fuel was used in the hybrid and control buses. The Nevada control bus was driven an average of 705 mi per month whereas the Nevada hybrid-electric school bus was driven an average of 987 mi per month.
The Sigourney School District is located approximately 90 mi southeast of Des Moines, IA. The district has approximately 11 buses and transports around 320 school children per day. The Sigourney control bus was driven an average of 1010 mi per month, whereas the Sigourney hybrid-electric school bus was driven an average of 1339 mi per month. These numbers reflect the total average time the buses were on the road.
Analysis
The fuel and mileage data and school district notes were examined to determine if any problems had occurred that needed to be addressed. Both hybrid buses experienced maintenance issues related to the battery charging system and did not hold a charge during some periods when data were reported. When they were experiencing problems, the hybrid buses were switched to just the ICE and were thus running as conventional buses. This occurred for nearly 6 months for Nevada and 7 months for Sigourney. In other cases, the schools indicated that data were uncertain. For instance, one bus was in the shop for several days, and the school district did not know whether additional fuel had been added. Data for times when a bus was not functioning properly or when errors were noted were removed from the dataset. Although the buses experienced limited use in the summer when school was not in session, bus information was provided if they were used during that time.
Once erroneous data were removed, it was noted that several time periods only had data for the control bus or the hybrid-electric school bus. Because temperature and weather conditions affect bus fuel economy, it was important not to have more observations reported for a particular bus during one time period because this could bias results. Consequently, data for a particular time period were only included in the analysis when there were observations for the control and hybrid bus. Unfortunately, this significantly reduced the number of observations. A total of 18 time periods were used in the analysis for Nevada, and 13 time periods were used in the analysis for Sigourney.
Fuel economy was calculated using
where FuelEcon t is the fuel economy for period t (mpg), m t is the miles driven in period t on the basis of the odometer reading, and galt is the gallons of fuel used in period t.
RESULTS
Simple statistics for the hybrid and conventional school buses are shown in for Nevada and in for Sigourney. Months when weather conditions were most alike in Iowa were grouped into the seasons according to the following:
Figure 1. Fuel economy (mpg) for buses in Nevada by season.
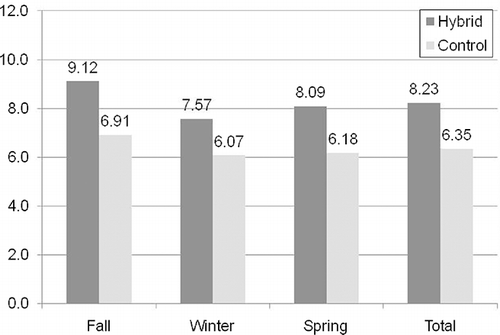
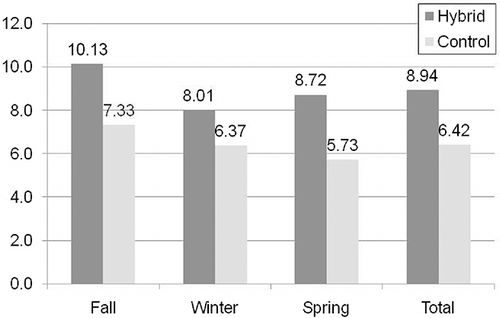
Figure 2. Fuel economy (mpg) for buses in Sigourney by season.
| • | Winter: December, January, and February | ||||
| • | Spring: March, April, and May | ||||
| • | Summer: June, July, and August | ||||
| • | Fall: September, October, and November | ||||
Average fuel economy is shown in and As shown, some variation occurred by season. Because there were not sufficient data to test statistical differences in fuel economy by season, only simple statistics were used for comparison. In Nevada, the hybrid bus had an overall fuel economy 29.6% higher than that of the conventional bus. A total of 18 observations were available for each Nevada bus overall, with 5 observations for fall, 5 observations for winter, and 8 observations for spring. Fuel economy for the hybrid was 32% higher during fall than for the control bus, 25% higher during winter, and 31% higher during spring. The buses were used on a limited basis for summer, so no data are presented for the summer period.
In Sigourney, the hybrid bus had an overall fuel economy 39.2% higher than that of the control bus. A total of 13 observations were available for each bus overall, with 4 observations for fall, 4 observations for winter, and 5 observations for spring. Fuel economy for the hybrid bus was 38% higher during fall, 26% higher during winter, and 52% higher during spring. No data were recorded for either bus during the summer.
Although a statistical test could not be performed for seasonal differences, differences between buses overall were compared for statistical significance. A total of 18 observations for Nevada were available and 13 observations were available for Sigourney. The data were expected to be normally distributed. However, because the sample size was low, the data were examined and it was determined that they were not normally distributed. The data were also tested for autocorrelation to determine whether the samples were independent, and it was determined that autocorrelation was not a problem.
Because the data were not normally distributed, a nonparametric alternative to the t test was used to compare fuel economy for the reported time periods. The Wilcoxon signed rank test compares the magnitude and sign of the rank between pairs of measurements. Results for both school districts indicate that the hybrid bus overall had better fuel economy than the control bus and that the differences are statistically significant (for Nevada, P [tlt] 0; for Sigourney, P < 0.0003).
Electricity Use
The electricity use for the hybrids was calculated based on times when the electrical meter was functioning. The average kilowatt-hour per mile used for the buses was 0.53 for Nevada and 0.37 for Sigourney.
It should be noted that the average electrical consumption rate for the hybrid buses was included in the overall fuel economy calculations because it was not possible to separate the two. As a result, this may have affected the operating costs by a very small amount.
MAINTENANCE ISSUES
In addition to the usual maintenance problems that school buses often have, the hybrid buses presented several new challenges to the local districts and to the development partners to find workable solutions. The most notable in Iowa are described below.
Recharging System
The initial charging connections and power cords furnished with the buses proved to be inadequate for the function for which they were needed. After both districts’ chargers burned (or shorted) out, all were replaced with heavier duty cords and more positive (locking) connections. In addition, the batteries required approximately 8 hr to achieve a full charge, so the intermediate charge between the typical morning and afternoon routes was insufficient to provide full electrical power in the afternoon. This resulted in the electrical mode being less capable of powering the buses in the afternoon than in the morning. This problem was much worse during the winter (cold weather) months, when the buses had to be brought in from the morning routes and warmed up before charging could begin because the districts reported that the batteries would not take a charge without that warming. In winter, a shorter time was therefore left for the midday charge, meaning less power to assist the engine. The cold weather also reduced the power that the batteries could sustain while on the route. Further, both districts had multiple problems throughout this period with the battery cable ends corroding, and this lessened the efficiency of the recharge until it became so bad that the batteries simply would not recharge at all. Frequent cleaning of the terminal ends was tried, but it seemed difficult to stay ahead of the problem. Replacement of all of the ends was performed on one bus for a longer-lasting remedy, but additional corrosion problems occurred in another few months.
Heating System
During periods of maximum electrical use (and minimal engine use), the idling engine did not circulate and heat enough water in its cooling system to provide adequate heat to the interior of the bus. This was unacceptable to the driver and the riders, so the attempted solution was an auxiliary electric heater. Although this greatly improved the amount of interior heat, the interior temperature still did not match that of a conventional bus.
LIMITATIONS
Although the fuel economy was clearly much higher for the hybrid-electric school bus, the school districts had expected a fuel economy of approximately 12 mpg, which is what had been reported in early tests. Fuel economy may have been compromised because the charging units in both districts experienced problems on several occasions that did not allow the buses to hold a charge. When this occurred and the bus operators were aware of it, the problem was noted in the records and the corresponding data were removed from the analysis. However, it may have taken some time for the drivers to become aware of and note the problem, so the buses may have been running while the charging system was not fully operational. Additionally, the bus operators felt that the charging problems prevented the buses from fully charging after the morning run, so the buses may not have been fully charged for the afternoon run and consequently fuel economy may have been compromised.
SUMMARY
Although the concept of hybrid-electric school buses was always promising, the technology was not commercially available in school buses before instigation of the HESB. HESB developed a consortium to create enough demand among school districts to encourage a manufacturer to invest in the development of the technology. Several school districts in the United States joined the HESB to purchase plug-in hybrid-electric school buses. Two of the hybrid-electric school buses were purchased by Iowa school districts—Nevada and Sigourney.
In-use fuel economy was assessed for the two Iowa hybrid school buses. Each school district also selected a control bus that ran on a route similar to the hybrid school bus. Each school recorded odometer readings and the amount of fuel used by buses. Fuel consumption and other operational metrics were calculated and compared for each school district.
An analysis was conducted to compare differences for in-use fuel economy between the hybrid and control school buses. Data were first disaggregated and compared by season. Months in Iowa for which weather conditions were most alike were grouped into seasons. Both hybrid buses experienced problems with the battery charging systems on several occasions, and while the problem was being resolved, the bus operated only on the ICE. Data for those times were removed from the analysis, resulting in sample sizes for any given season. As a result, data by season could not be tested for statistical significance and only simple statistics were reported. Results of the simple statistics indicate that fuel economy for the hybrid bus in Nevada was 32% higher than the control bus in fall, 25% higher in winter, and 31% higher in spring. Fuel economy for the hybrid bus in Sigourney was 38% higher in fall, 26% higher in winter, and 52% higher in spring.
Differences in fuel economy overall were compared for statistical significance. The data were assessed before performing a statistical test and it was determined that the data were not normally distributed. As a result, a nonparametric test, the Wilcoxon signed rank test, was used to compare fuel economy. Average fuel economy for all time periods for Nevada was 8.23 mpg for the hybrid-electric school bus and 6.35 mpg for the control bus. As a result, fuel economy for the Nevada hybrid bus was 29.6% better than for the control bus. The hybrid bus in Sigourney had an overall fuel economy that was 39.2% higher than the control bus, with an average fuel economy of 8.94 mpg for the hybrid-electric school bus and 6.42 mpg for the control bus. Results for both school districts were statistically significant at the 95% level of significance.
Although the fuel economy was clearly much higher for the hybrid-electric school bus, the school districts had expected a fuel economy of approximately 12 mpg. Fuel economy may have been compromised because of problems with the charging units, which were experienced by both districts. Although data were removed from the analysis when the problem was known, it may have taken some time for the drivers to notice the problem and consequently the hybrid buses may have been running for some time without having a fully operational charging system. Unknowingly, the corresponding biased data might have been included in the final dataset. Also, the bus operators expressed that the charging problems prevented the buses from fully charging after the morning run, so the buses were not fully charged for the afternoon run. This may also have resulted in lower-than-expected fuel economy.
The HESB experienced an unusual number of maintenance problems, and this was frustrating for the school districts. The research team believes that this problem is generational and can be overcome in future models. Transit buses have utilized plug-in and conventional hybrid technologies for some time, and it does not appear that they have experienced the same challenges. As a result, it is believed that the potential exists for manufacturers to overcome the initial problems.
ACKNOWLEDGMENTS
The research team thanks IEC for funding this project. They also thank the Nevada and Sigourney bus garages, drivers, and supervisors for their assistance in collecting data. In particular, the team thanks Dennis Kroeger, who provided much of the vision to bring hybrid school buses to Iowa.
REFERENCES
- National School Bus Fuel Data; American School Bus Council http://www.americanschoolbuscouncil.org/index.php?page=fuel-calculator (http://www.americanschoolbuscouncil.org/index.php?page=fuel-calculator) (Accessed: May 2010 ).
- Special Report 269: the Relative Risks of School Travel ; Transportation Research Board : Washington , DC , 2002 .
- Clean School Bus USA; U.S. Environmental Protection Agency http://www.epa.gov/cleanschoolbus (http://www.epa.gov/cleanschoolbus) (Accessed: February 2008 ).
- Hybrid-Electric Drive Heavy-Duty Vehicle Testing Project ; Prepared for the Defense Advanced Research Projects Agency by the Northeast Advanced Vehicle Consortium : Boston , MA , 2000 .
- Wargo , J. 2002 . Children's Exposure to Diesel Exhaust on School Buses , North Haven , CT : Environment and Human Health .
- Adar , S.D. , Davey , M. , Sullivan , J.R. , Compher , M. , Szpiro , A. and Liu , L.J. 2008 . Predicting Airborne Particle Levels aboard Washington State School Buses . Atmos. Environ. , 42 : 7590 – 7599 .
- Chandler , K. , Walkowicz , K. and Eudy , L. 2002 . New York City Transit Diesel Hybrid-Electric Buses: Final Results , Washington , DC : U.S. Department of Energy (DOE)/ National Renewable Energy Laboratory (NREL) Transit Bus Evaluation Project; DOE .
- Technical Assessment of Advanced Transit Bus Propulsion Systems ; Prepared for the Dallas Area Rapid Transit by Batelle : Columbus , OH , 2002 .
- Chandler , K. and Walkowicz , K. 2006 . King County Metro Transit Hybrid Articulated Buses: Final Evaluation Report , Golden , CO : National Renewable Energy Laboratory . NREL/TP-540-40585
- Clark , N.N. , Borrell , E.R. , McKain , D.L. , Paramo , V.H. , Wayne , W.S. , Vergara , W. , Barnett , R.A. , Gautam , M. , Thompson , G. , Lyons , D.W. and Schipper , L. 2006 . Evaluation of Emissions from New and In-Use Transit Buses in Mexico City, Mexico . Trans. Res. Rec. , 1987 : 42 – 53 .
- Shorter , J.H. , Herndon , S. , Zahniser , M.S. , Nelson , D.D. , Wormhoudt , J. , Demerjian , K.L. and Kolb , C.E. 2005 . Real-Time Measurements of Nitrogen Oxide Emissions from In-Use New York City Transit Buses Using a Chase Vehicle . Environ. Sci. Technol. , 39 : 7991 – 8000 .
- Jackson , E.D. and Holmen , B.A. 2009 . Modal Analysis of Vehicle Operation and Particulate Emissions from Connecticut Transit Buses . Trans. Res. Rec. , 2123 : 76 – 87 .
- Barghout , J. and Haggis , S. 2010 . Plug-In Hybrid Electric School Bus Project: 2010 Program Report , Raleigh , NC : Advanced Energy .
- Garabedian, H.A. Hybrid-Electric School Bus; Vermont Agency of Natural Resources http://www.advancedenergy.org/transportation/phesb/pdfs/EVermont.pdf (http://www.advancedenergy.org/transportation/phesb/pdfs/EVermont.pdf) (Accessed: February 2010 ).
- Plug-In Hybrid-Electric School Bus; Advanced Energy http://www.hybridschoolbus.org (http://www.hybridschoolbus.org) (Accessed: February 2008 ).