ABSTRACT
An urban community PM10 (particulate matter ≤ 10 μm in aerodynamic diameter) air pollution study was conducted in Paterson, NJ, a mixed land-use community that is interspersed with industrial, commercial, mobile, and residential land-use types. This paper examines (1) the spatial/temporal variation of PM10, elemental carbon (EC), organic carbon (OC), and nine elements; and (2) the impact of land-use type on those variations. Air samples were collected from three community-oriented locations in Paterson that attempted to capture industrial, commercial, and mobile source-dominated emissions. Sampling was conducted for 24 hr every 6 days from November 2005 through December 2006. Samples were concurrently collected at the New Jersey Department of Environmental Protection-designated air toxics background site in Chester, NJ. PM10 mass, EC, OC, and nine elements (Ca, Cu, Fe, Pb, Mn, Ni, S, Ti, and Zn) that had more than 50% of samples above detection and known sources or are toxic were selected for spatial/temporal analysis in this study. The concentrations of PM10, EC, OC, and eight elements (except S) were significantly higher in Paterson than in Chester (P < 0.05). The concentrations of these elements measured in Paterson were also found to be higher during winter than the other three seasons (except S), and higher on weekdays than on weekends (except Pb). The concentrations of EC, Cu, Fe, and Zn at the commercial site in Paterson were significantly higher than the industrial and mobile sites; however, the other eight species were not significantly different within the city (P > 0.05). These results indicated that anthropogenic sources of air pollution were present in Paterson. The source apportionment confirmed the impact of vehicular and industrial emissions on the PM10 ambient air pollution in Paterson. The multiple linear regression analysis showed that categorical land-use type was a significant predictor for all air pollution levels, explaining up to 42% of the variability in concentration by land-use type only.
This study provides a useful approach to characterize community air pollution and identify the sources of concern and the impact of land-use type on community air pollution in an urban area with mixed emission sources. Data obtained from the air monitoring sites, which were located at community-oriented locations, can be used to better estimate community exposure to air pollution.
INTRODUCTION
Mounting evidence shows an association between elevated concentrations of ambient PM10 (particulate matter [PM] ≤ 10 μm in aerodynamic diameter) and increased respiratory and cardiovascular mortality and morbidity.Citation1–4 However, the underline mechanisms that are responsible for the observed health effects associated with exposure to PM10 have not been well understood. Some studies have suggested that transition metals in ambient particles (e.g., Fe, Ni, and V) contribute partially to the adverse health effects.Citation5 Also, transition metals (e.g., Cu and Fe) can promote generation of reactive oxygen species, which has been suggested to be responsible for cardiopulmonary health effects associated with particle air pollution.Citation6 Therefore, it is important to characterize chemical species in ambient PM10.
The U.S. Environmental Protection Agency (EPA) has established extensive monitoring networks, including the Urban Air Toxic Monitoring Program (UATMP), to monitor PM and other air pollutants, including but not limited to metals, volatile organic compounds, and carbonyls.Citation7 Those national monitoring networks, although adequate for establishing trends of air pollutants,Citation8 do not always reflect the variety of local air pollution problems that may affect urban communities.Citation9,Citation10 As reported by many studies,Citation10–12 elevated concentrations of ambient PM and its chemical species can occur in a “hot spot” for air pollution because of various local emission sources. Thus, to better understand community exposures to particulate air pollution and potential health effects associated with those exposures, it is important to measure PM10 and its chemical components and to characterize spatial and temporal variations of PM10 and its chemical species at the community level.
Spatial variation of air pollutants has been characterized in urban and regional areas.Citation10–13 Generally, ambient concentrations are higher around areas with industrial facilities and heavy traffic, and spatial variation is largely attributed to the proximity of local sources of air pollution. This suggests that local air pollution may be associated with the land-use pattern (e.g., commercial, residential, industrial, and mobile) in a given area. In other words, different land-use types may lead to different types of community air pollution and may be a predicting variable in explaining the spatial and temporal variations of air pollution in a community. Thus, the strategic placement of ambient air monitoring systems in a mixed land-use urban community may help in capturing the effect of different land-use types on local air pollution.
Paterson, the third most populated city in New Jersey, is located in Passaic County.Citation14 There are mixed sources of particle air pollution, including emissions from industrial, commercial, mobile, and residential sources.Citation15–17 Previous studies reported that 21% of participating third graders in Paterson were diagnosed with asthma or a related health problem,Citation16 and the hospitalization rates because of asthma were more than 3 times higher than the state average.Citation18 To better assess community exposures and thus the health effects associated with local particle air pollution, the spatial and temporal variations of PM10, elemental carbon (EC), organic carbon (OC), and trace elements were measured by strategic placement of sampling systems in proximity to local air pollution sources. The effects of land-use type and meteorological parameters on the variation of PM10 and its chemical species are also examined in this paper.
METHODS
Study Areas
Paterson is located in Passaic County in New Jersey and has a high population density (6826.4 people/km2 in the U.S. Census of 2000).Citation15 It is composed of sections that are dominated by industrial (e.g., textiles; dyes; chemicals; metal fabrication, refinishing, and recovery; plastics; printing; electronics; paper and food products, etc.), commercial (e.g., dry-cleaning, fast-food restaurants, photo laboratories, commercial heating/boilers, salons, print shops, etc.), and mobile sources (e.g., U.S. Interstate 80; Route 19; and County Routes 649, 639, and 648). Mobile sources appear to have a strong influence on levels of air pollution at all three monitoring locations on the basis of the observations during the site visits, particularly at the commercial area. In addition, long-range transported air pollutants emitted from coal-fired power plants in Lehigh Valley, PA, may affect the city. Also, Paterson may be affected by the nearby urban sources because it is part of the greater New York metropolitan area, the most populous and highly urbanized metropolitan area in the United States.
Monitoring Sites
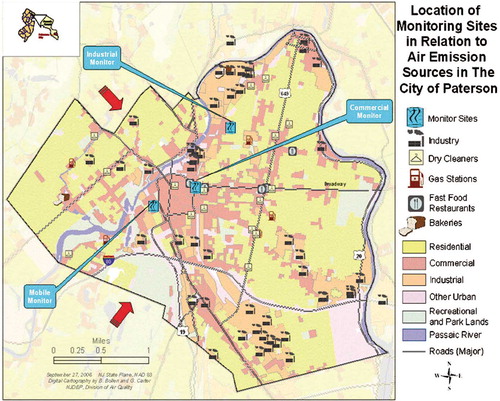
Three monitoring sites (i.e., a commercial, industrial, and mobile sampling site) were selected for sampling on the basis of the land-use type, locations of emission sources, Geographic Information System (GIS) layers of population density, school location and accessibility, security of the sampling systems, and availability of electricity. As shown in , the industrial site was located at a public school in northern Paterson. This school is south-southeast (0.1–1 km) of a highly industrialized area known as Bunker Hill. This area hosts various industrial facilities, including a facility that emits Cu compounds, a metal recovery operation, and a plating operation that emits Ni and Zn compounds. The monitoring site for the mobile source-dominated area was located at a public school in southwestern Paterson (). Several major roadways are located within 0.8 km of the school, including U.S. Interstate 80 and Route 19, a major New Jersey transit bus depot, and an active rail yard/line. The monitoring devices were placed on the roof (∼13 m above the ground) of each school because of space and security restrictions. The commercial monitoring site was located near the shopping district in downtown Paterson. The monitoring equipment was placed on the top of a local building, approximately 10 m above the ground. This site is close to urban commercial sources such as dry cleaners, fast-food restaurants, photo-finishing laboratories, commercial heating/boilers, salons, print shops, etc. A ground-level background site was located in Chester in Morris County, NJ, approximately 58 km west-southwest of Paterson. This site is designated as the background/rural site for the UATMP by the New Jersey Department of Environmental Protection (NJDEP) and has been in operation since 2001.
Figure 1. The location of air monitoring sites at local commercial, industrial, and mobile source-dominated sites in Paterson (information from NJDEP). The prevailing wind directions (northwestern for winter and spring seasons and southwest for summer and fall seasons) were obtained from meteorological data monitored at the Teterboro Airport weather station and are displayed as red arrows in the figure.
Sample Collection and Measurement
Field sampling was conducted from November 18, 2005 to December 20, 2006. Sampling frequency was approximately 1 in 6 days, and the duration of sampling was 24 hr, from midnight to midnight. This sampling frequency is consistent with the current UATMP sampling schedule to capture trends of air toxic pollutants. However, 15 measurements distributed over a season is a relatively small amount and might affect the power to detect the seasonal variation. Samples for PM10 mass and trace elements were collected on a 47-mm Teflon-membrane filter housed in a ChemComb cartridge using a four-channel PM sampler (Thermo Fisher Scientific) at a flow rate of 16.7 L/min. Samples for EC and OC analyses were a portion of a 1- by 1-cm2 cut from a 47-mm quartz fiber filter used to collect particle-phase polyaromatic hydrocarbons (PAHs) in this study. The sampling procedure for PAHs is similar to the EPA TO-13 method and is described in the authors' PAH paper.Citation19 The PM10 mass was measured with a microbalance (Mettler Toledo) in the Environmental and Occupational Health Sciences Institute (EOHSI) weighing room, where temperature (20 ± 1 °C) and relative humidity (RH; 35% ± 5%) are constantly controlled (filters were equilibrated before and after sampling). These two types of filter samples were mailed to Research Triangle Institute (RTI) for the analysis of EC and OC and trace elements. RTI is an EPA-approved research laboratory and standard operating procedures for all of the sample analyses are available online.Citation20 Specifically, the EC and OC samples were analyzed using a thermal/optical transmittance analysis method, and trace elements were analyzed by energy-dispersive X-ray fluorescence spectrometry.
Quality Assurance/Quality Control
The study collected approximately 5 and 10% of trip blanks and duplicate samples, respectively. Several field blanks were also collected during the study; however, no difference was found between the two types of blanks. Therefore, the average of all field blanks was used for blank correction. The averaged blank concentrations were 0.009 and 0.905 μg/m3 for EC and OC, respectively, and nondetect to 0.286 ng/m3 for the 48 trace elements. The measurement precision for each air pollutant, which was measured as a relative percent difference (RPD) between two co-located samples, was 7.8% for PM10 (n = 21), 14.7% for EC (n = 7), 3.7% for OC (n = 7), and less than 35% for most trace elements, except Cr (48%) and Hf (54%). The poor precision was mainly due to the low concentrations of these two species (three and two pairs of duplicates, respectively). The method detection limit (MDL) was calculated as 3 times the standard deviation (SD) of the trip blanks collected over the course of the study. The MDL for each species is reported in .
Table 1. Descriptive statistics for EC, OC, PM10, and 48 trace elements in PM10 for the study
Data Analyses
Data Processing
A blank subtraction was performed for all valid field samples before data processing. Nondetects were substituted with (1) half of the MDL, if the nondetect was less than 15%; (2) full MDL and zero, respectively, if the nondetect was between 15 and 49%; and (3) no substitution if the nondetect was greater than 50%.
Statistical Analysis
Different statistical analyses, including multiple linear regression analysis, Spearman correlation analysis, and source apportionment using positive matrix factorization (PMF) were performed to examine spatial/temporal variations, identify the sources of the target species, and explain the variability in ambient air concentrations by the community's land-use pattern in this study. Specific descriptions for each analysis are presented below.
Descriptive Statistics and Comparison/Correlation Tests
Descriptive statistics were performed to characterize the distributions of the measured ambient concentrations. Among the 48 trace elements, 9 trace elements (Ca, Cu, Fe, Pb, Mn, Ni, S, Ti, and Zn) were selected for the analysis of spatial/temporal variations on the basis of consideration of their known sources in Paterson and the toxici-ties of transition metals (i.e., Cu, Fe, Mn, Ni, Ti, and Zn). Because the 12 species (i.e., PM10 mass concentration, EC, OC, and nine elements) were detected over 85% (see ), the substitution of a nondetect with a half of the MDL was not expected to have a significant effect on the statistical analyses.Citation21 A natural log transformation was conducted for all concentration data before further analyses because the measurements were not normally distributed.
Given the repeated measurements obtained from the study (i.e., measurements from the same location during different times of the year), a mixed linear model was used to examine the spatial and temporal variations. For example, to examine site differences, the categorical sampling location was assigned as a fixed effect, and temporal variables (e.g., season and a day of the week [i.e., weekday or weekend]) were assigned as random effects in the mixed model.Citation22 If the difference was found to be significant (P < 0.05), pairwise comparisons were followed to examine the individual mean difference within a group.
Spearman correlations among EC, OC, and nine selected elements at each monitoring location were examined to identify potential common air pollution sources for those species. Substituted data (e.g., a half of the MDL for a nondetect) were excluded in correlation tests to avoid potential bias in the analysis results. If a Spearman correlation coefficient (r s) is greater than 0.8 and signifi-cant (P < 0.05),Citation23 the results suggest that the two variables tested are strongly associated and may be generated from the same source. All statistical analyses were conducted by SAS (version 9.2).
Source Apportionment
To identify the major sources of the target species in Paterson, an EPA source-receptor model (PMF) was performed for the measurements obtained from the three monitoring sites in Paterson. The PMF is a multivariate receptor model providing source profiles and contributions to the given data. Detailed explanations and equations used in PMF can be found elsewhere.Citation24,Citation25 The predicted mass fractions and source factors obtained from the PMF analysis can help to identify the major sources that significantly contribute to the target species measured at each monitoring site in Paterson.
PM10, EC, OC, and all 48 trace elements measured in the study were initially used as the base input for the PMF model because some elements (e.g., Al, Mg, Si, and V) are presumed to be associated with some typical source profiles in urban ambient air. In addition, the mass concentration of PM10 was included as an independent variable in the PMF modeling to provide direct mass apportionments.Citation26,Citation27 The uncertainty for each species was calculated based on equations used in a previous studyCitation28 using reported MDLs and an error fraction (assumed to be 10% for all species in this study). Before running a base model, chemical species having a signal-to-noise (S/N) ratio less than 2 and a percent not detected greater than 15% were excluded from the original input data. The S/N ratio, defined as the sum of the squared signal vector over the sum of the squared noise vector, indicates whether the variability in the measurements is real or within the noise of the data.Citation25 A ratio greater than 2 indicates that the species is strong enough to provide meaningful contributions to the factor identifications for the PMF analysis.Citation29 On the basis of the criteria of a S/N ratio greater than 2 and detection over 85%, EC, OC, PM10 mass, and 17 trace elements (Al, Br, Ca, Cl, Cu, Fe, Pb, Mg, Mn, Ni, K, Si, Na, S, Ti, V, and Zn) were retained in the input data and used in the PMF analysis. Any nondetects in the input data were substituted with a half of the MDL for each species.
The eight-factor model was finally selected to best fit the data. The sensitivity analyses (e.g., running a PMF with the seven- and nine-factor models and 5% extra modeling uncertainty) were conducted. The bootstrap running for the selected eight-factor model was repeated 100 times to check that the factors were stable and consistent. Also, the positive FPEAK values (0.1–0.5) were used to sharpen the ambiguous source profiles in the base run model. After these additional tests, the final eight factors remained relatively constant. In this way, subjective bias was significantly reduced.Citation26,Citation27
Multiple Linear Regressions
A multiple linear regression analysis was performed to examine whether the land-use type contributed partially to the spatial variations of the species. Meteorological parameters (wind speed, temperature, RH, and precipitation) that may have a strong effect on the distribution of the air pollutants were also included in the model.
In the regression model, EC, OC, PM10, and nine selected elemental concentrations were considered as continuous dependent variables. The land-use type was a categorical independent variable, and the meteorological parameters (including temperature [°C], wind speed [km/hr], RH [%], and precipitation [cm]) were treated as continuous independent variables. It is necessary to note that the meteorological data were only measured in the last 5 months of the project at the industrial site in Paterson; thus, the meteorological data for the entire sampling period were obtained from the nearby weather stations under the operation of the National Weather Service (i.e., Teterboro Airport [for the Paterson sites] and Somerset Airport [for the Chester site] in New Jersey). The distances between the weather stations and the corresponding sampling locations are 11 and 18 km, respectively. The descriptive summary for meteorological data can be found in . The meteorological data measured at the industrial site in Paterson were compared with those acquired from the Teterboro Airport to examine whether there were significant differences between the two data-sets. As expected, the RPD was relatively small (<5%) for temperature, RH, and precipitation, but the wind speed measured at the Teterboro Airport was much higher (∼40%) than in Paterson. This may be because the airport area is more open than the industrial monitoring site in Paterson. The wind speed data obtained from two airport weather stations were corrected by the height of monitoring sites and surface roughness for the condition of Paterson and Chester, respectively.Citation30
Table 2. The summary of meteorological data reported in the two nearby airports for the sampling locations in Paterson and Chester
A set of dummy variables for the categorical land-use type was generated and used in SAS's REG procedure. This step can eliminate the implicit ordering and magnitude problems that occur by assigning each categorical land-use type with nominal values of “0,” “1,” “2,” and “3” in series.Citation31 A multiple linear regression model was developed based on Equationeq 1,
SAS's stepwise selection method was used for variable selection at a default significance level of 0.15.Citation32 The back ward and forward selection methods were additionally conducted, and the selected variables were robust to any selection method. If outliers or influencing observations (e.g., 2 times larger than the normalized residual) were found in the data, additional residual and outlier tests were conducted, and the regression analyses were performed again without the suspected data. Multicolinearity for predicting variables was examined for the regression model to check the effect of correlation of variables. No significant correlations were observed among predicting variables in the final regression models. Tests on equal variance, independence, and normality for residuals were used to check the assumptions of the linear regression model.Citation33
RESULTS AND DISCUSSION
Summary Statistics
Descriptive statistics for all measured concentrations were provided in . The ambient PM10 mass concentrations ranged from nondetectable to 71.8 μg/m3. EC and OC were found in a range of nondetectable to 4.27 μg/m3 and 0.32–18.4 μg/m3, respectively. Among the 48 trace elements in PM10, more than 85% of the measurements for each of the 20 elements (Al, As, Br, Ca, Cl, Cu, Fe, Pb, Mg, Mn, Ni, K, Se, Si, Na, Sr, S, Ti, V, and Zn) were above the MDLs. The concentrations of the remaining species were relatively low, with more than 50% nondetects.
Spatial and Temporal Variations
Spatial Variability
The concentrations of the 12 selected species at each sampling site and the comparison results among the four sampling sites are presented in . EC, OC, PM10, and the eight trace elements, except S, showed significant differences among the four sampling sites (P < 0.05). Multiple comparisons among the four sampling sites further demonstrated that the spatial variability resulted from the significant differences between the background site in Chester and the three sites (i.e., commercial, industrial, and mobile) in Paterson. The difference between the two geographical locations (i.e., higher concentrations in Paterson than in Chester) indicated the effect of local sources on air pollution in Paterson (i.e., Paterson is an urban area with mixed sources of air pollution).Citation34 Indeed, the NJDEP has identified many industrial sources of air pollutants in Paterson, such as emissions of Pb from battery manufacturers, Cu and Pb from a wire and cable manufacturing facility, and Ni and Zn from a hologram manufacturing facility. In contrast, there are no identified nearby industrial sources of air pollution at the Chester site.Citation15
Table 3. Descriptive statistics and spatial differences among the four sampling sites in the study
Ambient S concentrations were not significantly different among the four sampling sites (P = 0.39), probably because of a long-range transport of S influenced the ambient S levels in Paterson and Chester.
Among the three monitoring sites in Paterson, ambient EC, Cu, Fe, and Zn concentrations measured at the commercial site were significantly higher than at the industrial and mobile sites. This observation indicates that there were significant sources of those species at the commercial site. The dominant source of EC in an urban area may be diesel exhaust,Citation35 and common sources of Cu, Fe, and Zn are automobile exhaustCitation23 and industrial emissions.Citation36 Therefore, it was suspected that traffic-related emissions and metal processing emissions may contribute partially to the species observed at the commercial site in Paterson. However, no signifi-cant spatial differences were found for the other eight air pollutants within Paterson.
Seasonal Variability
The seasonal variations of some species at each sampling site are provided in . Concentrations measured at the three sites in Paterson were pooled before the statistical analyses. In pooled Paterson data, significant seasonal differences (P < 0.05) were found for EC, OC, Cu, Fe, Pb, Mn, Ni, Ti, and Zn. For the above species, all winter concentrations, except Ti (lower in fall), were observed to be higher than in the other three seasons. The winter measurements of PM10 and Ca were also higher than in other seasons, but their seasonal differences were marginally significant (P < 0.10). The observations presented here are consistent with previous findings.Citation35,Citation37,Citation38 For exam ple, Karar and GuptaCitation37 reported higher PM10 concentrations and associated chemical species (Cr, Zn, Pb, Cd, Ni, Mn, and Fe), mostly during winter in an urban region of India. Roosli et al.Citation35 have shown that monthly mean PM10 concentrations were more elevated during cold months in Basel, Switzerland. The higher winter concentrations of many pollutants may be from higher emissions in winter. For example, it is well known that in winter emissions from vehicles are elevated,Citation39,Citation40 with space heating being an additional source of air pollution.Citation41 Meteorological conditions also play an important role in air pollution levels. Surface temperature inversion commonly occurs near the ground, especially in winter. The meteorological effects (e.g., wind speed, precipitation, and temperature) will be examined and discussed in the following multiple linear regression analysis.
Figure 2. Seasonal variation (mean ± standard error [SE]) of (a) EC, (b) OC, (c) PM10, (d) Ca, (e) Cu, (f) Fe, (g) Pb, (h) Mn, (i) Ni, (j) S, (k) Ti, and (l) Zn at each sampling site.
![Figure 2. Seasonal variation (mean ± standard error [SE]) of (a) EC, (b) OC, (c) PM10, (d) Ca, (e) Cu, (f) Fe, (g) Pb, (h) Mn, (i) Ni, (j) S, (k) Ti, and (l) Zn at each sampling site.](/cms/asset/fc530efa-b255-4ed8-a9e9-2b56cd4c086d/uawm_a_10412132_o_f0002g.gif)
On the contrary, the ambient S concentrations were generally higher in summer than other seasons. This is probably due to higher secondary conversion from sulfur dioxide to particulate sulfate in summer, which leads to the increase of the summer concentrations of S in ambient particles.Citation42
Day-of-the-Week Variability
The ratios of weekday/weekend averages of the 12 species at each sampling site are plotted in . Data above the dotted reference line (ratio of 1) mean that the average weekday concentration was higher than the weekend concentration. Except for Pb, most air pollutants were measured higher on week-days than weekends at the four sampling sites. Measurements obtained from the three Paterson sites were pooled together before statistical analyses. The analysis results showed that the differences between weekday and weekend concentrations in Paterson were significant (P < 0.05) for EC, OC, PM10, Ca, Cu, Fe, Mn, S, Ti, and Zn. The elevated weekday concentrations for most air pollutants examined in the study confirmed previous findings (i.e., more anthropogenic activities during weekdays than weekends).Citation35,Citation43,Citation44 For example, Roosli et al.Citation35 observed higher mean concentrations of PM10 on weekdays than weekends, suggesting that regional human activities such as road traffic, construction work, and industrial processes are generally higher during weekdays. Hueglin et al.Citation44 reported significantly higher concentrations of PM, EC, mineral dust (Al, Mg, K, Ca, Fe, and Si) and trace elements of Mn and Cu on weekdays than weekends. The authors suggested that the traffic-related emissions (vehicular emission, resuspended road dust, and mechanically generated particles such as tire wear and brake lining dust) locally increased ambient PM and trace metal concentrations.
Figure 3. The ratios of weekday/weekend mean concentration by each sampling site. The dotted reference line (1.0) indicates the equivalent mean concentration for weekday and weekend measurements.
However, the difference was not significant for Ni (P = 0.23). The Ni concentrations on weekdays were not significantly elevated from the levels on weekends. In addition, the ambient Pb concentrations in Paterson were not significantly different between weekdays and weekends (P = 0.45), indicating no significant stationery Pb emission sources in Paterson during weekdays.
Correlations of EC, OC, and Elements at Each Monitoring Site
The Spearman correlation among EC, OC, and nine elements was further examined to identify potential sources of those species. As shown in , most correlations were significant (P < 0.05), and strong associations (r s > 0.8) were found among the eight species. Specifically, strong correlations between Ca and Ti as well as Fe and Mn were found for all of the four sampling sites. Ca and Ti are mostly from natural sources, such as crustal materials.Citation23 Fe and Mn may be generated from road dust aerosolized by traffic or from soil erosion.Citation23 Fe is a major crustal element and a traffic-related trace element.Citation23 Mn can be generated from mobile sources and emissions from industrial sources.Citation23,Citation36,Citation44 At the industrial monitoring site, EC, OC, Cu, and Zn were highly correlated with each other. For the mobile monitoring site, EC was strongly associated with Cu and Zn, whereas OC was strongly associated with Cu. At the commercial monitoring site, Cu was more strongly associated with OC than the other elements. In addition, stronger correlations were observed among EC, OC, Cu, Zn, Pb, and Ni at the three Paterson monitoring sites than at the Chester background site. These findings indicate that although NJDEP's emission inventory (EI) for this project did not have mobile sources, automobile exhaust and/or traffic-related emissions are the predominant sources for EC, OC, Cu, and Pb in Paterson. In addition, as discussed above, industrial emissions of Pb, Cu, Ni, and Zn are also significant contributors to the ambient air pollution in Paterson.Citation15
Table 4. Spearman correlation coefficients among EC, OC, and trace elements in PM10 by each monitoring site
Source Apportionments by PMF Analysis
A total of eight source profiles were identified for each site, and the resolved factors at the commercial site are presented in as an example. Each source profile is displayed by a log-scaled mass concentration (ng/m3) in gray bars and percent species in black boxes. The former represents a mass concentration apportioned by each species, and the latter indicates the contribution of each species to the source profile. The contribution of each factor to the PM10 mass estimated by PMF analysis is provided in . Because there were no data for PM ions (ammonium [NH4 +], nitrate [NO3 −], and sulfate [SO4 −2]), the estimated source contributions may not be accurate. Nonetheless, the percent obtained can be used to estimate the contribution of each source relative to the PM10 mass at each monitoring site in Paterson. The quality of the PMF solutions was evaluated by comparing the reconstructed PM10 mass contributions (sum of the contributions from PMF-resolved factors) with the measured PM10 mass concentrations. For the commercial (slope = 0.92; r 2 = 0.96) and industrial (slope = 0.99; r 2 = 0.99) sites, the r 2 close to 1 showed that the resolved factors well reproduced the measured values and accounted for most of the variations in the measured PM10 concentrations. However, the PMF solutions for the mobile site were not as good as the previous two results, with a value of 0.76 for slope and the coefficient (r 2).
Table 5. Factors identified by dominant species and temporal patterns using an EPA PMF model
Figure 4. The source profiles plotted as concentration and percent contribution vs. chemical species.
On the basis of source profiles, temporal patterns (e.g., higher in winter and/or higher on weekdays), and the source information (NJDEP's EI), possible sources for each factor profile were identified (see ). The most significant factor in Paterson is SO4 −2 aerosols, which are dominated by concentrations of S and PM10 and peak in the summer. The (secondary) SO4 −2 aerosols are the most dominant component in PM species in the northeastern United States.Citation45 The second most significant factor in Paterson is vehicular emissions, dominated by EC, OC, and trace metals (e.g., Cu, Fe, and Pb) during winter and weekdays. Similar source profiles in ambient air were also observed in previous studies.Citation27,Citation45,Citation46 The third most significant factor is airborne soil particles and/or road dust resuspended by traffic and wind. Ca, Mn, Si, and V dominated the source profile in spring. The trace elements of Ca and Si are major crustal materials,Citation23 and Mn is known as a traffic-related element.Citation23 The fourth contributing factor is airborne soil, specifically dominated by Ti concentration. The source profile is affected by Al, Si, and Ti, which are all from natural sources such as soil erosion.Citation45 The fifth contributing factor is oil combustion from commercial heaters and residential space heating, characterized by Ni and V in the heating season.Citation45,Citation46 The sixth contributing factor is industrial emissions, especially because of higher contributions from Cu, Fe, Pb, and Zn in winter and on weekdays. These elements are emitted from industrial facilities that process metals. The EI data collected by the NJDEP confirmed the frequent use of Cu, Pb, and Zn in industrial facilities in the Paterson area. The seventh significant factor is road salts, dominated by Cl and Na in winter. It is well known that de-icing road salts are frequently sprayed on roads in winter.Citation47
The PMF analysis results are consistent with the correlation results and confirmed that the vehicular and industrial emissions are significant anthropogenic sources of particle pollution in the ambient air of Paterson. In addition, land-use type may be a specific emission predictor for PM10 and its elements. For example, vehicular emissions were ranked as the most significant factor at the mobile site (26.1%), but they dropped to third and fifth at the commercial (16%) and industrial (9.7%) sites, respectively. This suggests the land-use pattern may directly affect the specific air pollution sources and the levels of air pollution in a community.
Concentration Gradients by Land-Use Type
Results obtained from the multiple linear regression models are provided in . The overall R 2 values for multiple linear regression models ranged from 0.25 to 0.64. A large portion of concentration variations can be explained by spatial variability (land-use type). Specifically, the variable of land-use type contributed significantly to the variability of all measured concentrations, with partial R 2 values of 0.04–0.42. Among the three land-use types in Paterson, the commercial land-use type contributed more to the increase of most of the air pollutant concentrations than the industrial and the mobile land-use types. For example, in the regression model of EC, a 1 SD increase at the commercial site would yield a 0.91 SD increase in the predicted EC concentrations when compared with 0.76 and 0.79 increases at the industrial and mobile sites, respectively. The increased contribution by the commercial site indicates additional air pollution sources are present in the commercial area of Paterson. As described earlier, the commercial monitoring site is surrounded by urban sources such as commercial heating/boilers, fast-food restaurants, gas stations, and dry cleaners. In addition, the monitoring site is located at the intersection of two major roadways and next to a very busy parking lot. High volumes of local traffic were observed at this site. Those local sources may partially contribute to the elevated concentrations of air pollutants observed at the commercial site.
Table 6. Final multiple linear regression models for each target species
The multiple linear regression analysis showed spatial differences for all air pollutants between Paterson and Chester (P < 0.05), including S concentrations, which was not found in previous spatial variability analysis (see ). This suggests that the multiple linear regression analysis, if coupled with meteorological parameters, has greater predictability for the variability in ambient pollutant concentrations than the mean comparison test for detecting spatial differences. For EC, Cu, Fe, and Zn, the commercial land-use type significantly contributed more to the increase of the four air pollutant concentrations than the industrial and mobile land-use types (P < 0.05), although a marginal difference was observed for Zn (P = 0.06) between the commercial and mobile land-use types. The regression results () were similar to the results obtained from the mean comparison tests presented in and were consistent with the identified sources by PMF analysis at the commercial site. These results confirmed a greater impact from local sources on air pollution in the commercial district in Paterson, specifically vehicle emissions and industrial emissions. These findings suggested that the community's land-use pattern might significantly influence the spatial variations of some pollutants (EC, Cu, Fe, and Zn) in Paterson.
Meteorological parameters (i.e., wind speed and precipitation) also played a significant role in the concentration gradients of the selected air pollutants. Wind speed and precipitation were found to be significant in all regression models (P < 0.05), except for Ti (wind speed only). The negative parameter estimates of wind speed and precipitation () indicated that the ambient air pollutant concentrations decrease because of dispersion and wet deposition, respectively, in ambient air. The effects from temperature and RH were not as significant as those for wind speed and precipitation for most of the examined species. Temperature and RH significantly affected only S and Ti. The S concentrations were higher in summer, which is consistent with the result of regression analysis. For Ti, the negative parameter estimate of RH and the positive parameter estimate of temperature might be related to the observation of the lowest fall concentrations in Paterson and the highest summer concentrations in Chester. However, these two parameters remained unchanged in the regression model with exclusion of the background data.
CONCLUSIONS
This study monitored PM10 mass concentration and its chemical species at three locations in Paterson, NJ, an urban community with mixed sources of air pollution, and at a background area in Chester, NJ. This paper characterizes the spatial/temporal variations of those species. Locational differences were observed for most target species between Paterson and the background site (P 0.05), with higher concentrations at the three Paterson sites than at the background site. The multiple linear regression analysis confirmed the locational differences for all of the species between the two study areas (Paterson and Chester). These results are consistent with the source apportionment conducted for each of the three sites in Paterson and the EI data from Paterson (i.e., there are mixed sources of particle air pollution in Paterson, particularly vehicular and industrial emission sources). In contrast, this study found no significant sources of PM air pollution near the background site in Chester. Spatial variations were found for EC, Cu, Fe, and Zn among the three sites in Paterson, with higher concentrations at the commercial site than at the mobile and industrial sites in Paterson. Seasonal variations were observed for most target species, with the highest concentrations in winter for most species. The higher winter concentrations can be largely attributed to stronger emission strength and frequent inversions during the winter. The differences in air pollutant concentrations were also observed between weekdays and weekends. These temporal variations indicated higher emissions from human activities during weekdays than weekends.
There are some limitations of the study. Because of the consideration of security of the monitoring equipment and accessibility of the sampling site, the air monitoring devices were placed on the approximately 10- to 13-m-high rooftops of the local buildings in Paterson. The concentrations measured on the rooftops may be different from the ground level, which are what people are exposed to. Second, the meteorological data during the entire study period were not obtained from the field sampling sites. Meteorological data obtained from the nearby airport may be different from the local conditions, which may affect the results of the regression analysis. Third, daily mixing height, one of the most important meteorological factors to affect the dispersion of air pollutants and consequently concentrations in ambient air, was not obtained and included in the data analysis. Future studies should try to find proper locations near ground level and locally collect necessary meteorological data.
ACKNOWLEDGMENTS
This study was supported by EPA (grant no. SR05-035). Dr. Fan is supported in part by the National Institute of Environmental Health Sciences (NIEHS)-sponsored University of Medicine and Dentistry of New Jersey (UMDNJ) Center for Environmental Exposures and Disease (grant no. NIEHS P30ES005022). The authors thank Dr. Robert Stiles, Dr. Kathy Black, and Ms. Martha Hernandez for their help with field sampling. The views expressed in this article are those of the authors and do not necessarily reflect the views or policies of the funding agencies.
REFERENCES
- Dockery , D.W. and Pope , C.A. 1994 . Acute Respiratory Effects of Particulate Air Pollution . Ann. Rev. Public Health , 15 : 107 – 132 .
- Dockery , D.W. , Pope , C.A. , Xu , X. , Spengler , J.D. , Ware , J.H. , Fay , M.E. , Ferris , B.G. and Speizer , F.E. 1993 . An Association between Air Pollution and Mortality in Six US Cities . New Engl. J. Med. , 329 : 1753 – 1759 .
- Pope , C.A. , Burnett , R.T. , Thurston , G.D. , Thun , M.J. , Calle , E.E. , Krewski , D. and Godleski , J.J. 2004 . Cardiovascular Mortality and Long-Term Exposure to Particulate Air Pollution Epidemiological Evidence of General Pathophysiological Pathways of Disease . Circulation , 109 : 71 – 77 .
- Pope , C.A. , Thun , M.J. , Namboodri , M.M. , Dockery , D.W. , Evans , J.S. , Speizer , F.E. and Heath , C.W. 1995 . Particulate Air Pollution as a Predictor of Mortality in a Prospective Study of US Adults . Am. J. Resp. Crit. Care Med. , 151 : 669 – 674 .
- Kelly , F. 2003 . Oxidative Stress: Its Role in Air Pollution and Adverse Health Effects . Occup. Environ. Med. , 60 : 612 – 616 .
- Shen , H. , Barakat , A and Anastasio , C. 2010 . Generation of Hydrogen Peroxide from San Joaquin Valley Particles in a Cell-Free Solution . Atmos. Chem. Phys. Discuss. , 10 : 21323 – 21356 .
- 2008 . National Monitoring Programs (UATMP and NATTS) Volume I: Main Content, EPA 2007 , Washington , DC : U.S. Environmental Protection Agency .
- McCarthy , M.C. , Hafner , H.R. and Montzka , S.A. 2006 . Background Concentrations of 18 Air Toxics for North America . Journal of the Air & Waste Management Association , 56 : 3 – 11 .
- Kinney , P.L. , Aggarwal , M. , Northridge , M.E. , Janssen , N.A. and Shepard , P. 2000 . Airborne Concentrations of PM2.5 and Diesel Exhaust Particles on Harlem Sidewalks: a Community-Based Pilot Study . Environ. Health Perspect. , 108 : 213 – 218 .
- Smith , L.A. , Stock , T.H. , Chung , K.C. , Mukerjee , S. , Liao , X.L. , Stallings , C. and Afshar , M. 2007 . Spatial Analysis of Volatile Organic Compounds from a Community-Based Air Toxics Monitoring Network in Deer Park, Texas, USA . Environ. Monitor. Assess. , 128 : 369 – 379 .
- Touma , J.S. , Cox , W.M. and Tikvart , J.A. 2006 . Spatial and Temporal Variability of Ambient Air Toxics Data . Journal of the Air & Waste Management Association , 56 : 1716 – 1725 .
- Zhu , X. , Fan , Z. , Wu , X. , Meng , Q. , Wang , S. , Tang , X. , Ohman-Strickland , P. , Georgopoulos , P. , Zhang , J. and Bonanno , L. 2008 . Spatial Variation of Volatile Organic Compounds in a “Hot Spot” for Air Pollution . Atmos. Environ. , 42 : 7329 – 7338 .
- Spicer , C.W. , Buxton , B.E. , Holdren , M.W. , Smith , D.L. , Kelly , T.J. , Rust , S.W. , Pate , A.D. , Sverdrup , G.M. and Chuang , J.C. 1996 . Variability of Hazardous Air Pollutants in an Urban Area . Atmos. Environ. , 30 : 3443 – 3456 .
- Census Data for Paterson City; U.S. Census Bureau http://factfinder.census.gov/servlet/GCTTable?_bm=y&-geo_id=04000US34&-_box_head_nbr=GCT-PH1-R&-ds_name=DEC_2000_SF1_U&-_lang=en&-format=ST-7S&-_sse=on (http://factfinder.census.gov/servlet/GCTTable?_bm=y&-geo_id=04000US34&-_box_head_nbr=GCT-PH1-R&-ds_name=DEC_2000_SF1_U&-_lang=en&-format=ST-7S&-_sse=on) (Accessed: 2010 ).
- 2010 . Urban Community Air Toxics Monitoring Project, Paterson City, NJ (UCAMPP) , Trenton , NJ : New Jersey Department of Environmental Protection .
- Freeman , N.C.G. , Schneider , D. and McGarvey , P. 2002 . School-Based Screening for Asthma in Third-Grade Urban Children: the Passaic Asthma Reduction Effort Survey . Am. J. Public Health , 92 : 45 – 46 .
- 2003 . Asthma in New Jersey , Trenton , NJ : New Jersey Department of Health and Senior Services .
- Wallace , L.A. , Mitchell , H. , O'Connor , G.T. , Neas , L. , Lippmann , M. , Kattan , M. , Koenig , J. , Stout , J.W. , Vaughn , V.J. , Wallace , D. , Walter , M. , Adams , K. and Liu , L.J.S. 2003 . Particle Concentrations in Inner-City Homes of Children with Asthma: the Effect of Smoking, Cooking, and Outdoor Pollution . Environ. Health Perspect. , 111 : 1265 – 1272 .
- Lin , L. , Fan , Z. , Zhu , X. , Huang , L. , Korn , L. and Bonanno , L. 2011 . Characterization of Atmospheric Polycyclic Aromatic Hydrocarbons in a Mixed-Use Urban Community in Paterson, NJ: Concentrations and Sources . Journal of the Air & Waste Management Association , 61 : 631 – 639 . doi: 10.3155/1047-3289.61.6.631
- PM2.5 Speciation Laboratory Standard Operating Procedures http://www.epa.gov/ttnamti1/specsop.html (http://www.epa.gov/ttnamti1/specsop.html) (Accessed: 2010 ).
- 2002 . RCRA Waste Sampling Draft Technical Guidance , Washington , DC : U.S. Environmental Protection Agency; Office of Solid Waste .
- Burstyn , I. , You , X. , Cherry , N. and Senthilselvan , A. 2007 . Determinants of Airborne Benzene Concentrations in Rural Areas of Western Canada . Atmos. Environ. , 41 : 7778 – 7787 .
- Martuzevicius , D. , Grinshpun , S.A. , Reponen , T. , Górny , R.L. , Shukla , R. , Lockey , J. , Hu , S. , McDonald , R. , Biswas , P. and Kliucininkas , L. 2004 . Spatial and Temporal Variations of PM2.5 Concentration and Composition throughout an Urban Area with High Freeway Density—the Greater Cincinnati Study . Atmos. Environ. , 38 : 1091 – 1105 .
- Paatero , P. 1997 . Least Squares Formulation of Robust Non-Negative Factor Analysis . Chemomet. Intel. Lab. Syst. , 37 : 23 – 35 .
- 2008 . EPA Positive Matrix Factorization (PMF) 3.0 Fundamentals and User Guide , Washington , DC : U.S. Environmental Protection Agency .
- Kim , E. and Hopke , P. 2007 . Comparison between Sample-Species Specific Uncertainties and Estimated Uncertainties for the Source Apportionment of the Speciation Trends Network Data . Atmos. Environ. , 41 : 567 – 575 .
- Kim , E. , Hopke , P. , Paatero , P. and Edgerton , E. 2003 . Incorporation of Parametric Factors into Multilinear Receptor Model Studies of Atlanta Aerosol . Atmos. Environ. , 37 : 5009 – 5021 .
- Polissar , A. , Paatero , P. , Hopke , P. , Malm , W. and Sisler , J. 1998 . Atmospheric Aerosol over Alaska, 2. Elemental Composition and Sources . J. Geophys. Res. , 103 : 19045 – 19057 .
- Paatero , P. and Hopke , P. 2003 . Discarding or Downweighting High-Noise Variables in Factor Analytic Models . Anal. Chim. Acta , 490 : 277 – 289 .
- Turner , D. 1994 . Workbook of Atmospheric Dispersion Estimates: an Introduction to Dispersion Modeling , Boca Raton , FL : CRC .
- Neter , J. , Kutner , M.H. and Nachtsheim , C.J. 1996 . Applied Linear Regression Models , 3rd , New York : McGraw-Hill/Irwin .
- SAS 9.1 User's Guide http://support.sas.com/documentation/onlinedoc/91pdf/sasdoc_91/stat_ug_7313.pdf (http://support.sas.com/documentation/onlinedoc/91pdf/sasdoc_91/stat_ug_7313.pdf) (Accessed: 2010 ).
- Ross , Z. , Jerrett , M. , Ito , K. , Tempalski , B. and Thurston , G.D. 2007 . A Land Use Regression for Predicting Fine Particulate Matter Concentrations in the New York City Region . Atmos. Environ. , 41 : 2255 – 2269 .
- 2000 . National Air Toxics Program: the Integrated Urban Strategy, Report to Congress , Washington , DC : U.S. Environmental Protection Agency .
- Röösli , M. , Theis , G. , Künzli , N. , Staehelin , J. , Mathys , P. , Oglesby , L. , Camenzind , M. and Braun-Fahrländer , C. 2001 . Temporal and Spatial Variation of the Chemical Composition of PM10 at Urban and Rural Sites in the Basel Area, Switzerland . Atmos. Environ. , 35 : 3701 – 3713 .
- Mugica , V. , Maubert , M. , Torres , M. , Muñoz , J. and Rico , E. 2002 . Temporal and Spatial Variations of Metal Content in TSP and PM10 in Mexico City during 1996–1998 . J. Aerosol Sci. , 33 : 91 – 102 .
- Karar , K. and Gupta , A.K. 2006 . Seasonal Variations and Chemical Characterization of Ambient PM10 at Residential and Industrial Sites of an Urban Region of Kolkata (Calcutta), India . Atmos. Res. , 81 : 36 – 53 .
- Marcazzan , G.M. , Vaccaro , S. , Valli , G. and Vecchi , R. 2001 . Characterisation of PM10 and PM2.5 Particulate Matter in the Ambient Air of Milan (Italy) . Atmos. Environ. , 35 : 4639 – 4650 .
- Etyemezian , V. , Kuhns , H. , Gillies , J. , Chow , J. , Hendrickson , K. , McGown , M. and Pitchford , M. 2003 . Vehicle-Based Road Dust Emission Measurement (III): Effect of Speed, Traffic Volume, Location, and Season on PM10 Road Dust Emissions in the Treasure Valley, ID . Atmos. Environ. , 37 : 4583 – 4593 .
- Parrish , D. 2006 . Critical Evaluation of US On-Road Vehicle Emission Inventories . Atmos. Environ. , 40 : 2288 – 2300 .
- Panther , B. , Hooper , M. and Tapper , N. 1999 . A Comparison of Air Particulate Matter and Associated Polycyclic Aromatic Hydrocarbons in Some Tropical and Temperate Urban Environments . Atmos. Environ. , 33 : 4087 – 4099 .
- Khoder , M.I. 2002 . Atmospheric Conversion of Sulfur Dioxide to Particulate Sulfate and Nitrogen Dioxide to Particulate Nitrate and Gaseous Nitric Acid in an Urban Area . Chemosphere , 49 : 675 – 684 .
- Almeida , S.M. , Pio , C.A. , Freitas , M.C. , Reis , M.A. and Trancoso , M.A. 2006 . Source Apportionment of Atmospheric Urban Aerosol Based on Week-days/Weekend Variability: Evaluation of Road Re-Suspended Dust Contribution . Atmos. Environ. , 40 : 2058 – 2067 .
- Hueglin , C. , Gehrig , R. , Baltensperger , U. , Gysel , M. , Monn , C. and Von-mont , H. 2005 . Chemical Characterization of PM2.5, PM10 and Coarse Particles at Urban, Near-City and Rural Sites in Switzerland . Atmos. Environ. , 39 : 637 – 651 .
- Song , X. , Polissar , A. and Hopke , P. 2001 . Sources of Fine Particle Composition in the Northeastern US . Atmos. Environ. , 35 : 5277 – 5286 .
- Kim , E. , Hopke , P. , Larson , T. , Maykut , N. and Lewtas , J. 2004 . Factor Analysis of Seattle Fine Particles . Aerosol Sci. Technol. , 38 : 724 – 738 .
- Lee , P. , Brook , J. , Dabek-Zlotorzynska , E. and Mabury , S. 2003 . Identification of the Major Sources Contributing to PM2..5 Observed in Toronto . Environ. Sci. Technol. , 37 : 4831 – 4840 .