ABSTRACT
Odor emission rates are commonly measured in the laboratory or occasionally estimated with inverse modeling techniques. A modified inverse modeling approach is used to estimate source emission rates inside of a postdigestion centrifuge building of a water reclamation plant. Conventionally, inverse modeling methods divide an indoor environment in zones on the basis of structural design and estimate source emission rates using models that assume homogeneous distribution of agent concentrations within a zone and experimentally determined link functions to simulate airflows among zones. The modified approach segregates zones as a function of agent distribution rather than building design and identifies near and far fields. Near-field agent concentrations do not satisfy the assumption of homogeneous odor concentrations; far-field concentrations satisfy this assumption and are the only ones used to estimate emission rates. The predictive ability of the modified inverse modeling approach was validated with measured emission rate values; the difference between corresponding estimated and measured odor emission rates is not statistically significant. Similarly, the difference between measured and estimated hydrogen sulfide emission rates is also not statistically significant. The modified inverse modeling approach is easy to perform because it uses odor and odorant field measurements instead of complex chamber emission rate measurements.
Emission rates of odor and odorant sources are used to assess and predict indoor environmental quality. The modified inverse modeling approach is an efficient, effective, and validated method for estimating emission rates using only odor and odorant concentrations measured indoors in the postdigestion centrifuge building of a water reclamation plant. The modified inverse modeling approach provides an easier method to predict odor and odorant emission rates in an indoor industrial environment than the conventional complex approach that simulates field conditions and then measures odor and odorant concentrations in the laboratory.
INTRODUCTION
Worker exposure to odors in water reclamation plants (WRPs) may cause complaints, sickness, discomfort, or stressCitation1; affect productivity; and lead to increased worker resignation and turnover at a plant. The postdigestion centrifuge building is among the worst odor-generating areas in a WRP.Citation2 Odor and odorant emission rates have been studied in outdoor environments, but research on emission rates of odors indoors in a postdigestion centrifuge building is sparse.
Periodic measurement of odor emission rates in the laboratory provides information on emission patterns, but it is complex, time-consuming, and expensive. Another approach for estimating emission rates of indoor sources is the inverse use of indoor air quality (IAQ) models. IAQ models are based on principles of mass balance and require that pollutant concentrations indoors are homogeneous throughout a building or in each of several building compartments, usually called “zones.” The airflow among such indoor zones is estimated with experimentally determined link functions or experimentally determined flow rate, Q ij, from zone i to zone j.Citation3,Citation4 The nearly perfect mixing requirement is not satisfied in many structures indoors. On the other hand, frequent measurement of indoor agent (odor or odorant) concentrations at strategically selected indoor sampling sites used in conjunction with inverse IAQ models is less expensive and the database used is generated on-site and provides sufficient information to determine compartments as a function of pollutant concentration distributions. In this work, source emission rates are estimated using a modified inverse modeling approach that uses fields, related to but different from conventional compartments or zones, defined by pollutant distribution and not a priori compartments determined simply by proximity to sources or by structural building divisions.
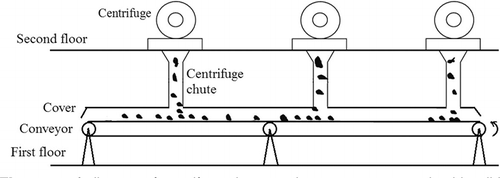
This approach is applied in the postdigestion centrifuge building of a WRP to estimate odor emission rates of centrifuge chutes and transport belts, the two major indoor odor sources. A chute is a vertical or inclined plane, channel, or passage through which objects are moved by means of gravity.Citation5 In this study, the biosolids undergo a 10-ft drop through the chutes from centrifuges present on the second floor on to primary conveyors on the first floor and hence are called “drop chutes” or “discharge chutes.” shows a diagram of the chutes and belts transporting biosolids. The cross-sectional area of one drop chute is 0.63 m2. There are 21 drop chutes in this postdigestion centrifuge building.
Figure 1. A diagram of centrifuge chutes and conveyors transporting biosolids.
The ultimate objective of this paper is to demonstrate that inverse modeling for estimating odor emission rates is an efficient (i.e., resource-conserving) and effective effort that leads to the correct outcome(s). The specific objectives are to (1) fully characterize measured odor emission rates, (2) estimate emission rate values by inverse modeling using indoor odor concentration (effective dose at the 50% level [ED50]) values, and (c) compare the outcome of inverse modeling with laboratory measurements of emission rates.
The first section of this paper assesses the literature and identifies voids in scientific efforts to estimate odor emission rates in a postdigestion centrifuge building of a WRP. The Experimental Studies section describes the indoor environment of the subject building and methods used to measure odor levels and odor emission rates, reviews the concept of inverse modeling as it applies to IAQ, and introduces an alternative method to IAQ inverse modeling. The next section presents study results and statistical comparisons between measured and estimated odor emission rates. The final section reaches a series of conclusions and potential applications of inverse modeling.
LITERATURE REVIEW
Because odors are subjective sensations and not chemicals, odor pollution measurement is difficult, highly variable, and poses intricate problems of characterization and challenges in relation to control strategies.
Odor Characterization
Odors are characterized in a four-dimensional space of sensory properties: (1) odor concentration, (2) intensity, (3) character, and (4) hedonic tone. Odor concentration is not an absolute value; rather, it measures the difference between two olfactory stimuli.Citation6 Units associated with odor measurement are pseudounits.Citation7 The odor threshold concentration is defined as the number of odor units (OUs) per unit volume (OU/m3); an OU is the number of dilutions of required fresh air to dilute the odor to its detection threshold. Liu and Liptak defined the related concept of dilution threshold by the following formulaCitation8:
Another definition of odor threshold concentration is the ED50, which is also called the “odor detection threshold.” In odor measurements, ED50 is the dilution ratio at which an odorous air sample is detected by 50% of the panelists. Intensity is associated with the sample odor strength or pungency perceived by an individual or a group of individualsCitation9; it is a qualitative odor characteristic that may be expressed in quantitative terms as a function of odorant concentration. The term “odor character” is associated with odor quality and responds to the question, “What does this odor smells like?” Hedonic tone describes the degree of odor offensiveness or the extent of the odor's pleasantness or unpleasantness.Citation10
Conventional pollution instruments are used to measure concentrations of odorants defined as chemical substances that stir up olfactory responses. However, sensory measurements use subjective judgments by individuals. Olfactometry is a subjective approach for measuring odor concentration using panelists or individuals who sniff diluted odorous air presented to them in an olfactometer. Because the odor acuity is variable among different persons, 4–10 panelists are used in a test panel. Panelists are presented with ascending odor concentrations to minimize olfactometry fatigue, adsorption, and exposure to odorous or potential toxic substances in the sample.Citation11 Odor measurement is further complicated by the fact that most odors perceived consist of various individual odor-ants and the overall odor of the mixture is difficult to assess.Citation12
Two methods of odor measurement are used widely—the yes/no method and the forced-choice method, both of which use panelists. In the yes/no method, each panelist is exposed to several dilutions of odorous air through a single sniffing port in ascending order until an odor is perceived. In the forced-choice method, the diluted odorous air sample is presented at one sniffing port, and two or more sniffing ports have odor-free air (blank samples). Each panelist is asked to identify the port that contains the odoriferous sample. The forced-choice method is more popular and reliable. Although static or dynamic dilution can be applied, dynamic dilution is superior because the air sample is delivered to the panelist under constant flow rate.Citation13
Odors and Odorants in Postdigestion Centrifuge Building
A study by the Water Environment Research Foundation (WERF) examined odor threshold values from different WRP processes of several WRPs and concluded that bio-solids cakes in the postdigestion centrifuge building typically produce the strongest odorant concentrations in a WRP.Citation2 Field and laboratory results show that better digestion, chemical addition, and reduced shear during dewatering and handling reduce odors.Citation14 Odors from biosolids processes are associated with the following volatile sulfur species generated from the degradation of proteins: hydrogen sulfide (H2S), dimethyl sulfide (DMS), dimethyl disulfide (DMDS), and dimethyl trisulfide (DMTS).Citation15,Citation16 Several papers estimated odors from incubated biosolids; for instance, Adams et al.Citation14 found detection threshold values consistently above 5000 dilution ratios by performing olfactometric measurements with sample bottle head-space gases using incubated centrifuging biosolids cakes from 11 WRPs.
To the best of the authors' knowledge, the literature is void of studies on odor emission rates from freshly dewatered biosolids sources indoors in a postdigestion centrifuge building.
Odor Emission Rate Measurement Methods
Several methods are used to measure emission rates of odors and odorants. A static flux chamber consists of a collection device and sampling ports but no sweep gas. Mass transfer takes place by molecular diffusion above the liquid or solid surface being investigated until pollutant concentrations reach equilibrium inside of the chamber. Emitted odors and odorous compounds are measured in the enclosed chamber at the end of a sampling period or at regular intervals in the course of a predetermined period.Citation17 Although potential disturbances of the natural flux conditions are minimized by not introducing flowing inlet and outlet gases, measured emission rate values critically depend on the configuration of the chamber and operating procedures. Additionally, emission rate values measured by the static flux chamber decrease over time, approaching zero as equilibrium concentrations are reached.Citation18 However, Mosher et al.Citation19 reported good agreement between flux chamber measurements from landfill gas (LFG) emissions and micrometeorological methods; micrometeorological methods are used outdoors to estimate source emission rates using downwind odor and odorant concentration field measurements and outdoor fate and transport models. Similarly, Tillman et al.Citation20 found static flux chamber measurements consistent with modeled fluxes for a soil test cell.
A second approach of measuring emission rates is the use of dynamic flux chambers. The two most frequently used dynamic flux chambers are the U.S. Environmental Protection Agency (EPA) flux chamber and the wind tunnel. The chamber consists of two parts: a cylinder skirt and a dome cover. The volume of the EPA flux chamber is 0.3 m3. This method requires continuous sweep gas, gas tanks, flow regulators, pressure gauges, fans, and other instruments that must be operated with care to avoid disturbing the natural flux.Citation12 Measurements in the airflow range of 1–40 L/m do not cause concentration buildup in the chamber.Citation11 Dynamic flux chambers are designed to satisfy requirements of different studies and have many configurations. The EPA dynamic flux chamber has been used to study LFG emission rates of ammonia (NH3), volatile organic compounds, and carbon dioxide (CO2); NH3 from manure associated with the dairy industry; and odors from liquid surfaces of feedlot pads and measure emission rates.Citation21–23 These devices and others used in similar studies have a common design, but their size and flow rate vary depending on the study objectives. Emission rate measurements from dynamic flux chambers lead to low emission rate values if the airflow in the chamber is low or the chamber has poor circulation or dead zones. These limitations are overcome with careful determination of the airflow rate and the use of a circulation fan inside of the chamber. Steady-state conditions must be reached before the sweep air has its effect, otherwise the chamber could produce artificially high emission rate values.Citation11 The flux chamber method has been used to measure emission rates from indoor residential solid surfaces but not for odor emission rates.
Wind tunnels utilize sweep air for emission rate measurement. A wind tunnel consists of a rectangular measurement section, open to the emission surface, with contraction and expansion sections allowing for air to be blown through the measurement section.Citation11 The system is operated with carbon-activated filtered air that is supplied at a controlled rate by a blower.Citation24 Results from a wind tunnel system are repeatable during the sampling process.Citation12 Wind tunnels simulate an ideal condition of uniform horizontal airstream over the measurement section. However, concentration profiles measured by this method depend on wind speeds selected and the size of the tunnel. The design of wind tunnels may be adjusted to satisfy local requirements and conditions, with investigators focusing on air velocities that reflect conditions at the emission source. NH3 emission rates from feedlot pads were measured using “large” and “small” wind tunnels. Under the same wind conditions, the smaller wind tunnel exhibits higher emission rates.Citation25 The University of New South Wales wind tunnel by Jiang et al.Citation24 was used to measure emission rates of volatile organic compounds released from large area sources. Jiang and associates determined the appropriate velocity on the basis of wind speeds associated with the most odor complaints. Using an aerodynamic (flow-through) chamber designed by the authors, Reichman and RolstonCitation26 concluded that the outlet flow rate is critical, and unless it is controlled carefully, overestimation and underestimation of emission fluxes are possible. Experiments with a dynamic flux chamber, a conventional wind tunnel, show NH3 emissions from different facilities of wastewater treatment plants in the range of 97–870 μg/m2·min, whereas the flow rates of air entering and exiting the chamber were set to be only slightly different at 5 and 3 L/min, respectively.Citation27
Emission of odors and odorants is the outcome of mass transfer processes, and factors affecting emission rates (in this case, from biosolids to air) include the porosity of biosolids cake and its moisture content, airflow at the air side, surface roughness, temperature, pH, and others. Temperature is the focus of several investigations pertinent to this study. RoseCitation28 used a flux chamber to measure emission rates and concluded that ambient temperature, chamber temperature, and temperature within the source affect emission rate values from the dairy industry. Aneja et al.Citation29 reported that temperature and lagoon pH are significant predictor variables for lagoon ammonia-nitrogen flux (NH3-N) when NH3-N was measured in six anaerobic swine waste storage and treatment lagoons using the dynamic chamber system. They recommended that measurements should cover the yearly range of temperatures and pH values in the lagoon surface to better estimate NH3 flux. Higgins et al.Citation15 measured odorant emission rates by applying headspace analysis and the relationship between biochemical constituents and odor-ants produced from anaerobically digested biosolids and concluded that the bound cake protein content was correlated with volatile sulfur compound (VSC) production, the detection threshold (DT) measured by the olfactometry panel, and with emission rates. Adams et al.Citation14 conducted a field study involving extensive sampling and analyses of collected biosolids samples from several sampling points and concluded that biosolids odors after digestion and dewatering correlated with the amount of bioavailable protein in the biosolids.
The literature clearly suggests that samples must be kept in their original source conditions during laboratory experiments to secure accurate results.
Emission Rate Values and Air Quality Modeling
Dispersion models are used to estimate odor emission rates from outdoor sources.Citation21,Citation25,Citation30,Citation31 However, none of these studies estimated the accuracy of models used. A comparative study between the CALPUFF model and the ISCST3 Gaussian dispersion models examined downwind odors and source emission rates and concluded that both models are unable to predict peak odor concentrations by using a constant average emission rate, and odor emission rates obtained by back-calculating fluxes using CALPUFF and ISC models with the same field measurements of downwind odor concentrations are significantly different.Citation32 Again, none of these studies deal with odor emission rates of indoor sources.
Emission rates from indoor sources are used with IAQ models to predict indoor pollutant concentrations and estimate indoor exposures and potential risks. Such models are used to simulate long-term steady-state sources, on/off sources, and decaying sources.Citation33 Such models do not associate indoor source emissions with odor perception. The following model is representative of models used indoorsCitation34:
In practice, several assumptions are required for Equationeq 2 to be valid: (1) inlet pollutant concentration C 0 must be known, (2) steady state must be reached in the sampling field, and (3) pollutant emission is uniform above the sample surface and relatively constant during the sampling period.
Under such assumptions, Equationeq 2 reduces to
This model is a one-chamber model that is based on mass balance principles of an indoor environment that exhibits complete mixing, resulting in instantaneous homogeneous indoor contaminant concentrations over the averaging time scale of the experiment. The one-chamber model can be enhanced in complexity to include two or more chambers or zones within an indoor environment; each of such zones is dominated by different factors, displays uniform concentrations, and uses link functions to simulate flows among zones.Citation35
Emission Rate and Inverse Modeling
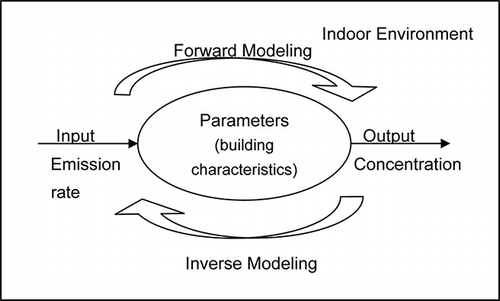
Conventional models use the “forward” approach; that is, one or a set of known input variables are used in conjunction with one or more theoretical relationships to estimate values of output measurable quantities—the “unknowns.” However, if values of the measurable or unknown output variables are used in conjunction with theoretical relationships to estimate the set of input variables, then this problem-solving approach is known as the “inverse” approach of modeling.Citation36 In other words, forward-solving simulation models estimate effects on the basis of the complete description of the model input values; inverse-solving simulation models use measurements to estimate input variable values as a function of model or systematic parameters that characterize the investigated system (see ).
Figure 2. Forward and inverse modeling illustration.
The inverse modeling approach is used extensively in many complex environmental issues, such as global warming, ozone depletion, and others.Citation37,Citation38 Inverse-dispersion calculations have been shown to be effective for estimating emission rates for outdoor sourcesCitation39,Citation40 and for indoor sources.Citation35 Liu and ZhaiCitation35 classified recent simulation models of IAQ and building safety into two categories: multiple zone and computational fluid dynamic models. Important features of such models are (1) the number of assumptions required regarding airflows among zones, (2) the required understanding of building structural characteristics, and (3) the determination of “acceptable accuracy” of such complex simulations. They used both categories of models to develop an “adjoint” probability inverse model to determine the source location of accidental agent releases, the source strength, the duration of pollutant release, and its impact on the IAQ.
The literature assessment substantiates that research on inverse modeling has been used to estimate pollutant emission rates of sources outdoors, rarely indoors, and never of indoor odor sources.
EXPERIMENTAL STUDIES
Sampling
Field measurements of odor and odorant levels were performed in a postdigestion centrifuge building in a Midwestern city. The postdigestion centrifuge building consists of two buildings known as the new and the old building. These buildings are connected, open to each other, and have identical functions with minor differences in building layout and number of centrifuges.
Sampling for this study was performed in two stages. Stage one was carried out as survey sampling to identify potential odor sources and obtain a general overview of the odor concentration (ED50) distribution. The comprehensive sampling, stage two, consisted of two sampling campaigns in different time periods to study whether there is an influence of outdoor weather conditions on indoor odor levels.
The survey sampling measured odor and odorant concentrations at approximately 60 locations of the post-digestion centrifuge building, including the service areas; centrifuge areas; maintenance areas; primary, secondary, and inclined conveyors; electrical and chemical storage; polymers; and odor control rooms and offices. On the basis of survey sampling results, 18 locations were identified as representative sites where comprehensive air sampling was to be carried out: 6 within the near-field area and 12 in the far-field area. During the two sampling campaigns, a total of 102 indoor air samples were collected from these sites. Additionally, 22 samples were taken from outdoors, exhaust fans, and local exhaust system (LES) sites and offices that use separate heating, ventilation, and air conditioning (HVAC) systems. In the performance of the study reported in this paper, these additional sites were used as reference points. A vacuum chamber was used to collect air samples in 10-L Tedlar bags, which were kept in dark bags to prevent exposure to sunlight during the sampling and shipping processes and were analyzed within 24 hr of sampling. Operating conditions such as air supply units, exhaust fans, and number of operating centrifuges and belts were recorded in a checklist for each sampling date.
Samples were taken over several days and on each day sampling was performed within a 4-hr period. Although the operating conditions did not change within each sampling day, they did change among sampling days. This sampling approach sought to establish odor levels under multiple operating conditions.
Odor Threshold Determination and Forced-Choice Olfactometry
The dilution ratios at which 50% of panelists can detect the odor is the odor threshold, which is the metric used to determine the ED50. A properly calibrated and trained panel of eight panelists is used to determine ED50 values in accordance with the standard of ASTM International.Citation13
The forced-choice triangle method was used to determine odor threshold levels. The system consists of an air delivery unit, a sample unit, a mixing/dilution unit, and a detection unit. Detailed description and illustrations are provided in the manual by the olfactometer manufacturer, RK and Associates.Citation41 Briefly, there are six dilution levels supplied by the olfactometer. At each dilution level, three samples (i.e., a triangle) are presented, each from a different sniffing port. Two of the ports provide odor-free air (two blanks) and the third is the odorous air diluted with odor-free air. Each panelist is asked to identify the port that delivers the odorous air sample, which is the port that is different from the other two. This is a forced-choice instrument because if a panelist were unable to identify the sniffing port with the odorous sample, the panelist must simply guess the sniffing port with the odorous air.
Near- and Far-Field Partition
Multiple-chamber IAQ models are based on the mass balance principle and require that each chamber satisfies concentration homogeneity, or a nearly complete mixing condition. For large buildings with strong emission sources this may or may not be applicable. The near/ far-field concept was originally advanced by electromagnetic research to indicate that the near-the-source field is dominated by different processes than those of the far field. The research used in this paper modifies this concept and asserts that the near field is under the influence of the source and is not homogeneous, whereas the far field is homogeneous.Citation42 This is a variation of multiple-zone IAQ simulations that identify each zone as a room or room combination with uniformly distributed pollutant concentrations governed by the same physical processes and linked with neighboring zones by way of experimentally defined airflows or empirically determined link functions that are pollutant-dependent. An additional difference between the conventional and modified approaches is that the boundary of near and far fields may be different for odor and odorant concentrations because odor and odorant concentrations are not linearly related.Citation1,Citation43 The following three criteria have been established to separate near and far fields: (1) proximity to the source, (2) difference of median odor concentrations between the two fields, and (3) difference of variance odor concentrations between the two fields.
As a consequence of the lack of concentration homogeneity in the near field, the relationship between source emission rates and the resulting odor concentrations does not satisfy the assumption of Equationeq 3 and is too complex to simulate. On the other hand, far-field conditions satisfy the homogeneity of odor concentrations and an IAQ model based on mass balance principles is applicable. This study applies the far-field/near-field concept and uses only the far-field database to estimate odor emission rates.
Measurement and Estimation of Odor Emission Rates
Odor emission rates from biosolids on the belt were measured by laboratory experiments. Chute emission rate values were calculated by first measuring H2S emission rates from the chute in situ and then by transforming these rates to odor emission rates using the following model associating H2S concentrations with odor levelsCitation44:
Given the difficulties involved in measuring DMS and DMDS concentrations in the chutes, a modified model is used with only H2S and relative humidity as independent variables.
Emission rates from biosolids transported on the belts in the postdigestion centrifuge building were measured using the EPA-recommended flux chamber. The cake was placed in an aluminum plate and was kept at temperatures corresponding to measured cake temperatures. The chamber was positioned on top of the cake samples and the experiment began as soon as the temperature reached the desired level. After the chamber reached steady state, determined by H2S concentration measurements, exit air samples were collected in Tedlar bags and the odor concentrations were determined within a short period after sample collection using a forced-choice olfactometer. Each experiment lasted 45 min plus the time required for odor concentration measurements. As t increases, E asymptotically reaches a steady state described by the Niu et al. model,Citation34 which uses measured values to estimate the steady-state emission rate, the variable of interest.
The air handling system of the postdigestion centrifuge building was investigated in detail to provide information on airflow rates that were measured and compared with design values. The air handling systems in the postdigestion centrifuge building include air supply systems and the ventilation system, roof intake and exhaust fans, and the LES. The air supply systems for the old and new buildings are operated separately.
The odor emission rate values are estimated using Equationeq 6 and measured odor concentrations and measured flow rates. The measured flow rates are constant for each sampling day but may vary among sampling days. Sampling was carried out each day over a 4-hr period that included measurements of odor concentrations and flow rates. The measured total flow rate was used each day as a building-wide flow rate. Fresh air is brought into the building from the outside and then distributed to various locations through supply ducts. Because the air supply systems are operated separately in the two buildings, the inverse modeled emission rates for the two buildings are also calculated separately. The air infiltration is assumed to be smaller than the mechanical ventilation and is ignored in all subsequent calculations.
RESULTS AND DISCUSSION
The scientific hypothesis of this study explores the notion that inverse modeling can be used to estimate the odor emission rate value of the combined major sources in a postdigestion centrifuge building of a WRP using an odor database that underwent formal quality control/quality assurance processes to secure high scientific data quality.
The section begins by determining the near- and farfield regions, continues by justifying the use of only the far-field database, and concludes by comparing the measured and estimated emission rates using deterministic and probabilistic methods.
Justification of the Modified IAQ Inverse Modeling Approach
All ED50 values were examined as a function of each postdigestion centrifuge building to determine the near/far-field boundary. Each of the criteria established to separate near and far fields are satisfied. The near-field area is close by the source, clearly identifiable by the presence of conveyors and chutes, and accounts for approximately 25% of the entire building area; the rest of the building is considered to be far field. The second criterion is the difference of mean odor concentrations between the two fields. This difference was tested statistically using the nonparametric Wilcoxon sign rank test, which compares sets of data that are subjected to more than one condition. Corresponding daily mean values of near and far fields were used for a paired case study. The difference was found to be statistically significant (P = 0.018) for each building. The third criterion is the difference in variance between the two fields. This difference was examined using Levene's test, which is sufficiently robust for non-normal data. The null hypothesis of equal odor concentration variances in the near and far fields was rejected in each building (P = 0.000). Because the variance of the near field is larger than that of the far field () in either building, it was concluded that the far field is more homogeneous than the near field. Odor concentration levels vary more than chemical concentrations because odor measurements use humans as detectors, leading to large variance in odor perception because they include individuals with a range of odor acuity although they exclude anosmic and supersensitive individuals. box plots graphically depict odor concentrations at each field through their minimum value, lower quartile, median, upper quartile, and maximum value. This figure illustrates the variability of each field and demonstrates that odor concentrations are log-normally distributed. Neither region is totally homogeneous, but the near fields display greater variability than the far-field regions.
Table 1. Mean, SD, percentiles, and sample size of measured odor concentration values (OU/m3) in different regions of each building (based on 7-day measurements)
Figure 3. Box plots of ED50 values for the old building (far and near fields) and new building (far and near fields).
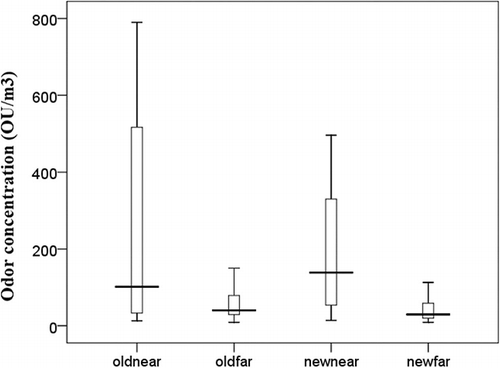
The distribution of odor concentration values in each building demonstrates the existence of two distinct odor fields: the near field and the far field. Unlike the segregation of indoor environments into zones, which are determined as a function of room purpose and distance from sources, the signature parameter of fields is the homogeneity of odor concentrations within each field.
The option of performing simulations with the database that includes all odor concentrations measured in the postdigestion centrifuge building as one homogeneous chamber is not available for determining emission rates of the major sources because this configuration does not satisfy the well-mixed requirement of IAQ mass balance models. The option of using the near- and far-field data in conjunction with link functions that connect the airflows between the two fields is complex and not available for simulations because the near field does not satisfy the homogeneous requirement of IAQ models. Accordingly, the modified inverse modeling approach disregards the near-field zone data and uses the database from the far-field region to estimate odor emission rates because the far-field zone is the only well-mixed zone governed by transport and mixing forces simulated by the IAQ mass balance model.
Measurement and Estimation of Odor Emission Rates
Laboratory conditions for measuring odor emission rates were set to correspond to matched field conditions. The simulated flux chamber conditions correspond to the daily airflow rate and the cake temperature. One daily flow rate value, Q out, was used because conditions did not change during sampling. Each biosolids cake sample was placed in a 0.46- by 0.46-m aluminum baking tray, and the tray was set on four heating plates to ensure that the sample temperature remained within the range of approximately 95–100 °F, which was the biosolids cake temperature range measured (n = 60) inside of the cake at the field as the cake moved on the conveyor belts.
The second major odor source identified in the study was the chutes. The emission rate from the centrifuge chutes on each sampling day depends on the number of working centrifuges, the operating conditions of the centrifuge (e.g., shear and centrifugation), and the physio-chemical condition of the dropped cake. During field measurements, H2S concentrations at a drop chute, airflow velocity right at the chute, and cross-sectional area were measured on each day. Emission rate at the drop was estimated by multiplying the concentration of H2S measured at the chute by the flow rate at the drop chute. The emission rate mean and standard deviation (SD) from each major odor-emitting source and the combined emission rate values are presented in . It is the total emission rate value that will be compared with the emission rate value estimated using inverse IAQ modeling.
Table 2. Total odor emission rates measured in each building
Odor emission rates from biosolids for each building far field are estimated using the equation ER = Q × C, where ER is the odor emission rate (OU/hr), Q is the airflow rate (m3/hr), and C is the odor concentration (OU/m3). A total of 25 measurements of odor concentrations and Q values in the new building lead to 25 deterministic estimations of ER with a mean of 6.0 × 10⁶ OU/hr and a SD of 4.1 × 10⁶ OU/hr. The corresponding values for the old building are 5.6 × 10⁶ and 4.0 × 10⁶ OU/hr using 26 measurements.
Using the near- and far-field approach, it was demonstrated that the one-chamber model or the combined far- and near-field data lead to emission rate values that are (on average) 3 times larger than the far-field measured emission rates. Analysis also reveals that the near-field emission rates are nearly twice as high as the combined rates and 5 times as high as the far-α field emission rate values (). Accordingly, the study focuses on the comparison of measured odor emission rates with emission rates estimated using only far-field data that satisfy the IAQ inverse model requirements and are not affected by the turbulence of the source emissions.
Table 3. Emission rates in three building fields estimated by inverse modeling
Comparison of Estimated and Measured Odor Emission Rates
Emission rate values estimated deterministically by inverse modeling are compared with corresponding measured values by testing the difference of the two populations with unequal variances. This validation of the method applied in this paper tests the null hypothesis (H 0:μme =μes) after a transformation to account for the lognormal distribution of the odor data. The significance level value was set a priori at an α value of 0.01. A t test was performed with the log-transformed data and compares medians of untransformed data. The null hypothesis is rejected with either database of the old or the new building (). Consequently, at a significance level α value of 0.01, the difference between measured and estimated odor emission rates is not statistically significant.
Table 4. Summary of statistical comparisons between measured and modeled values
In addition to the deterministic approach, odor emission rates were estimated using probabilistic methods with inverse modeling. Unlike the deterministic models, input variables of the inverse model are random variables each with a probability distribution. Sampling is done electronically from each input distribution and the model output is also a random variable with its own distribution. To calculate the probabilistic emission rate, the best-fit distribution of ED50 and measured Q values were formulated using Crystal Ball version 11.1.1.00. Five thousand simulations (i.e., runs) were performed, leading to 5000 lognormally distributed emission rate values of odor with mean values of 6.2 × 10⁶ (SD = 5.3 × 10⁶) and 5.7 × 10⁶ (SD = 4.7 × 10⁶) OU/hr for the new and old buildings, respectively. A sensitivity analysis was carried out to rank the emission rate variation effect of the input to the inverse model, variables ED 50 and Q. The sensitivity analysis points out that the ED 50 variable is more critical in determining the ER magnitude. Because Q values were constant within each sampling day and varied among sampling days, the sensitivity analysis verified the expected. Comparisons performed by statistical tests establish that there is no significant difference between emission rates measured in the laboratory and the emission rates estimated using the inverse model approach with only far-field data ().
Although the subject of this paper is the estimation of odor emission rates indoors, comprehensive examination requires implementing the inverse method and the notion of uniformly distributed fields to estimate emission rates of H2S, the most prevalent odorant in the postdigestion building. Over 82% of the concentrations are at or below the 10th percentile of the H2S concentration distribution; the remaining 18% of the values were taken on the top of and very close to the source (the conveyor belts) or inside of the source (the chutes) where employee exposure is not likely and does not satisfy the well-mixed requirement of inverse modeling. The indoor H2S concentrations in far fields are nearly homogeneous. Accordingly, one field covers all ambient building air volume where mass balance principles are applicable and not the air volume in or by the source (i.e., the near field) where agent homogeneity is not satisfied because agent transport is dominated by gravity, turbulent motion, and temperature gradients. This near field is much smaller than the odor near field, which includes the air volume between belts up to breathing level. The difference of field size is attributed to the dilutions, which are less effective in reducing odors than odorantsCitation1,Citation43 because the two physical measures are not linearly related. Finally, statistical tests lead to the conclusion that the difference between the measured H2S emission rates and the emission rates estimated by inverse modeling is not statistically significant (α= 0.01). This conclusion agrees with the conclusion on odor emission rates.
CONCLUSIONS
Employee exposure to odors indoors in industrial environments may cause discomfort and stress, increase worker complaints, reduce productivity, and increase worker turnover. One of the cornerstones of designing engineering control strategies to reduce indoor odors is a comprehensive characterization of indoor odor sources that includes identification of odor sources and estimation of their individual and combined emission rates. This paper demonstrates that the modified inverse modeling method efficiently and effectively characterizes emission rates of combined indoor odor sources using a limited number of measured odor concentrations at strategically selected indoor sites.
Application of inverse IAQ models is site specific, yet once the boundaries between the near field and far field are delineated by sampling at strategically selected sites, the validated inverse model is then applied as needed. This easy-to-perform model estimation of odor emission rates ties work conditions with environmental conditions and provides the foundation for assessing and predicting indoor odor conditions and for formulating indoor odor quality control strategies that reduce the undesirable odor effects of exposed employees.
The inverse modeling approach is a straightforward use of the mass balance principle on the basis of the requirement that each indoor compartment or zone must be well mixed. The modified method was applied using near and far fields, a variation of the two-zone indoor environment, but only used data from the field that satisfies the well-mixed requirement of IAQ mass balance models. The use of the one-field database simplifies the application of multiple-zone IAQ models because it does not require link functions or other corrective statistical means to connect airflows among zones. This application of the inverse model approach was validated by comparing the model outputs with experimentally measured emission rates. The difference between measured and estimated odor emission rates was not statistically significant.
The approach elaborated in this paper is not the typical application of inverse modeling in indoor environments because it focuses on odors, although it can be used with chemical agents. Moreover, the segregation of the indoor environment into the near field and far field from the source regions used in this study differs from the conventional approach, which uses two or more compartments or zones determined by building designs (i.e., rooms) and their functions.
REFERENCES
- Gostelow , P. and Parsons , S.A. 2000 . Sewage Treatment Works Odour Measurements . Water Sci. Technol. , 41 : 33 – 40 .
- Witherspoon , J.R. Biosolids Processing Modifications for Cake Odor Reduction . WERF 03-CTS-9T . 2006 . Water Environment Research Foundation: Alexandria, WV
- Wilkes , C.R. , Small , M.J. , Andelman , J.B. , Giardino , N.J. and Marshall , J. 1992 . Inhalation Exposure Model for Volatile Chemicals from Indoor Uses of Water . Atmos. Environ. , 26 : 2227 – 2236 .
- McKone , T.E. 1987 . Human Exposure to Volatile Organic Compounds in Household Tap Water: the Indoor Inhalation Pathway . Environ. Sci. Technol , 21 : 1194 – 1201 .
- Cook C.D. Case History: Thickened Waste Activated Sludge Pumping Made Easier; Seepex: Enon, OH, 2007 http://ftp://198.166.43.190/E%20-%20P.C.%20Pumps/Seepex/SEEPEXCD/ARTICLES/ETREPR.PDF (http://ftp://198.166.43.190/E%20-%20P.C.%20Pumps/Seepex/SEEPEXCD/ARTICLES/ETREPR.PDF) (Accessed: 2011 ).
- Wright , R.H. 1982 . The Sense of Smell , Boca Raton , FL : CRC .
- McGinley , C.M. , Mahin , T.D. and Pope , R.J. 2000 . Elements of Successful Odor/ Odour Laws . Presented at the WEF Odor/VOC 2000 Specialty Conference . April 2000 , Cincinnati , OH .
- Liu , D.H.F. and Liptak , B.G. 1997 . Environmental Engineers' Handbook , 2nd , Boca Raton , FL : CRC .
- Design Manual: Odor and Corrosion Control in Sanitary Sewerage Systems and Treatment Plants . EPA-625-1-85-018 . 1985 . U.S. Environmental Protection Agency; Office of Research and Development: Washington, DC
- 2002 . Odour Methodology Guideline , Perth , , Western Australia : Department of Environmental Protection .
- Gostelow , P. , Longhurst , P. , Parsons , S.A. and Stuetz , R.M. Sampling for Measurement of Odors . Scientific and Technical Report No. 17 . 2003 . International Water Association: London, United Kingdom
- Cruz, M.L. M.S. Thesis, University of Puerto Rico, Mayaguez, Puerto Rico, 2005.
- Standard Practice for Determination of Odor and Taste Threshold by a Forced-Choice Ascending Concentration Series Method of Limits . E679-04 . 2004 . ASTM International: Philadelphia, PA
- Adams , G.A. , Witherspoon , J. , Card , T. , Erdal , Z. , Frobes , B. , McEwen , D. , Geselbracht , J. , Glindermann , D. , Hargreaves , R. , Hentz , L. , Higgins , M. and Murthy , S. Identifying and Controlling Odor in the Municipal Wastewater Environment. Phase II: Impacts of In-Plant Parameters on Biosolids Odor Quality . Report no. 00-HHE-5T . 2003 . Water Environment Research Foundation: Alexandria, VA
- Higgins , M.J. 2004 . Relationship between Biochemical Constituents and Production of Odor Causing Compounds from Anaerobically Digested Biosolids , Alexandria , VA : Water Environment Federation .
- Novak , J.T. , Adams , G. , Chen , Y.-C. , Erdal , Z. , Forbes , R.H. , Glinde-mann , D. , Hargreaves , J.R. , Hentz , L. , Higgins , M.J. , Murthy , S.N. and Witherspoon , J. 2006 . Odorous Gas Generation Patterns from Anaerobically Digested Biosolids . Water Environ. Res , 78 : 821 – 827 .
- Leyris , C. , Maupetit , F. , Guillot , J.M. , Pourtier , L. and Fanlo , J.L. 2000 . Laboratory Study of Odour Emissions from Areal Sources: Evaluation of Sampling System . Analusis , 28 : 199 – 206 .
- Perera , M.D. , Hettiaratchi , J.P. and Achari , G. 2002 . A Mathematical Modeling Approach to Improve the Point Estimation of Landfill Gas Surface Emissions Using the Flux Chamber Technique . Environ. Eng. Sci. , 1 : 451 – 462 .
- Mosher , B.W. , Czepiel , P.M. , Harriss , R.C. , Shorter , J.H. , Kolb , C.E. , McManus , J.B. , Allwine , E. and Lamb , B.K. 1999 . Methane Emissions at Nine Landfill Sites in the Northeastern United States . Environ. Sci. Technol. , 33 : 2088 – 2094 .
- Tillman , F.D. Design and Testing of a Chamber Device to Measure Organic Vapor Fluxes from the Unsaturated Zone under Natural Conditions . Proceedings of 2002 CSCE/EWRI of ASCE Environmental Engineering Conference . Reston , VA . American Society of Civil Engineers .
- Park , S. 2001 . Surface Emission of Landfill Gas from Solid Waste Landfill . Atmos. Environ. , 35 : 3445 – 3451 .
- Sparks, J. M.S. Thesis, Virginia Polytechnic Institute, Blacksburg, VA, 2008.
- Hudson , N. , Ayoko , G.A. , Dunlop , M. , Duperouzel , D. , Burrell , D. , Bell , K. , Gallagher , E. , Nicholas , P. and Heinrich , N. 2009 . Comparison of Odour Emission Rates Measured from Various Sources Using Two Sampling Devices . Bioresource Technol. , 100 : 118 – 124 .
- Jiang , K. and Ralph , K. 1996 . Comparison Study on Portable Wind Tunnel System and Isolation Chamber for Determination of VOCs from Areal Sources . Water Sci. Technol. , 34 : 583 – 589 .
- Smith , R.J. 1995 . A Gaussian Model for Estimating Odour Emissions from Area Sources . Math. Comput. Model. , 21 : 23 – 29 .
- Reichman , R. and Rolston , D.E. 2002 . Design and Performance of a Dynamic Gas Flux Chamber . Environ. Qual. , 31 : 1774 – 1781 .
- Jeon , E. , Son , H. and Sa , J. 2009 . Emission Characteristics and Factors of Selected Odorous Compounds at a Wastewater Treatment Plant . Sensors , 9 : 311 – 326 .
- Rose, A.J. M.S. Thesis, Texas A&M University, College Station, TX, 2003.
- Aneja , V.P. , Bunton , B. , Walker , J.T. and Malik , B.P. 2001 . Measurement and Analysis of Atmospheric Ammonia Emissions from Anaerobic Lagoons . Atmos. Environ. , 35 : 1949 – 1958 .
- Paing , J. , Picot , B. and Sambuco , J.P. 2003 . Emission of H2S and Mass Balance of Sulfur in Anaerobic Ponds . Water Sci. Technol. , 48 : 227 – 234 .
- Nagaraj , A. and Sattler , M.L. 2005 . Correlating Emissions with Time and Temperature to Predict Worst-Case Emissions from Open Liquid Area Sources . Journal of the Air & Waste Management Association , 55 : 1077 – 1084 .
- Wang , L. , Parker , D.B. , Parnell , C.B. , Lacey , R.E. and Shaw , B.W. 2006 . Comparison of CALPUFF and ISCST3 Models for Predicting Downwind Odor and Source Emission Rates . Atmos. Environ. , 40 : 4663 – 4669 .
- Ott , O. , Steinemann , A. C. and Wallace , L. A. 2007 . “ Mathematical Modeling of Indoor Air Quality ” . In Exposure Analysis , Boca Raton , FL : CRC/Taylor & Francis .
- Niu , J. , Thomas , C.W. and Burnett , T.J. 2001 . Ozone Emission Rate Testing and Ranking Method Using Environmental Chamber . Atmos. Environ. , 35 : 2143 – 2151 .
- Liu , X. and Zhai , Z. 2007 . Inverse Modeling Methods for Indoor Airborne Pollutant Tracking: Literature Review and Fundamentals . Indoor Air , 17 : 419 – 438 .
- Tarantola , A. 2005 . Inverse Problem Theory and Methods for Model Parameter Estimation , Philadelphia , PA : Society for Industrial and Applied Mathematics .
- Fan , S. , Gloor , M. , Mahlman , J. , Pacala , S. , Sarmiento , J. , Takahashi , T. and Tans , P. 1998 . A Large Terrestrial Carbon Sink in North America Implied by Atmospheric and Oceanic Carbon Dioxide Data and Models . Science , 282 : 442 – 446 .
- Villani , M.G. , Bergamaschi , P. , Krol , M. , Meirink , J.F. and Dentener , F. 2009 . Inverse Modeling of European CH4 Emissions: Sensitivity to the Observational Network . Atmos. Chem. Phys. Discuss , 9 : 21073 – 21110 .
- Gilliland , A.B. , Appel , W.K. , Pinder , R.W. and Dennis , R.L. 2006 . Seasonal NH3 Emissions for the Continental United States: Inverse Model Estimation and Evaluation . Atmos. Environ. , 40 : 4986 – 4998 .
- Gao , Z. , Desjardins , R.L. and Van Haarlem , R.P. 2008 . Estimating Gas Emissions from Multiple Sources Using a Backward Lagrangian Stochastic Model . Journal of the Air & Waste Management Association , 58 : 1415 – 1421 . doi: 10.3155/1047-3289.58.11.1415
- 2009 . Olfactometer Instruction Manual , Warrenville , IL : R.K. and Associates .
- Klepeis, N. E. Validation of the Uniform Mixing Assumption: Determining Human Exposure to Environmental Tobacco Smoke; Environ. Health Perspect. 1999, 107(Suppl 2), 357-363 http://www.ncbi.nlm.nih.gov/pmc/articles/PMC1566277/ (http://www.ncbi.nlm.nih.gov/pmc/articles/PMC1566277/)
- Koe , L.C.C. 1985 . Hydrogen Sulphide Odor in Sewage Atmospheres . Water Air Soil Pollut. , 24 : 297 – 306 .
- Wang , T. , Sattayatewa , C. , Venkatesan , D. , Noll , K. , Pagilla , K. and Moschandreas , D. Formulation of an Odor and Odorant Model in a Post-Digestion Dewatering Building Environment . Environ. Model Assess. , submitted for publication