Abstract
In the course of development, the brain undergoes a remarkable process of restructuring as it adapts to the environment and becomes more efficient in processing information. A variety of brain imaging methods can be used to probe how anatomy, connectivity, and function change in the developing brain. Here we review recent discoveries regarding these brain changes in both typically developing individuals and individuals with neurodevelopmental disorders. We begin with typical development, summarizing research on changes in regional brain volume and tissue density, cortical thickness, white matter integrity, and functional connectivity. Space limits preclude the coverage of all neurodevelopmental disorders; instead, we cover a representative selection of studies examining neural correlates of autism, attention deficit/hyperactivity disorder, Fragile X, 22q11.2 deletion syndrome, Williams syndrome, Down syndrome, and Turner syndrome. Where possible, we focus on studies that identify an age by diagnosis interaction, suggesting an altered developmental trajectory. The studies we review generally cover the developmental period from infancy to early adulthood. Great progress has been made over the last 20 years in mapping how the brain matures with MR technology. With ever-improving technology, we expect this progress to accelerate, offering a deeper understanding of brain development, and more effective interventions for neurodevelopmental disorders.
Le cerveau subit au cours du développement une restructuration remarquable par son adaptation à l'environnement et son efficacité croissante dans le traitement de l'information. Plusieurs méthodes de neuro-imagerie peuvent être utilisées pour mettre en évidence les modifications anatomiques, fonctionnelles et de connectivité dans le cerveau en cours de développement. Nous analysons ici les découvertes récentes sur les modifications cérébrales à la fois chez les sujets en cours de développement classique et chez ceux souffrant de troubles neurodéveloppementaux. Débutant par le développement classique, un résumé de la recherche sur les modifications du volume cérébral régional et la densité tissulaire, l'épaisseur corticale, l'intégrité de la substance blanche et la connectivité fonctionnelle, est présenté. Par manque d'espace nous ne pouvons traiter tous les troubles neurodéveloppementaux et nous avons plutôt sélectionné des études représentatives des caractéristiques neurologiques de l'autisme, du trouble déficit de l'attention/hyperactivité, de l'X fragile, du syndrome de délétion 22q11.2, du syndrome de Williams, du syndrome de Down et du syndrome de Turner. Lorsque cela est possible, nous nous intéressons aux études qui identifient une interaction âge/diagnostic, en faveur d'un trouble de la trajectoire du développement. Les études examinées couvrent généralement la période de la petite enfance à l'adulte jeune. La cartographie de la maturation cérébrale par résonance magnétique a considérablement progressé ces 20 dernières années et, la technologie s'améliorant sans cesse, nous espérons aller plus vite afin de mieux comprendre le développement cérébral et d'être plus efficaces dans les troubles neurodéveloppementaux.
Durante el curso del desarrollo el cerebro experimenta un notable proceso de reestructuración para adaptarse al ambiente y llegar a ser más eficiente en el procesamiento de la información. Se puede emplear una variedad de métodos de imágenes cerebrales para evaluar cómo cambia la anatomía, la conectividad y el funcionamiento durante el desarrollo. Se revisan los descubrimientos recientes en relación con estos cambios cerebrales en sujetos que tienen un desarrollo típico y en quienes tienen trastornos del neurodesarrollo. El artículo comienza con el desarrollo clásico, resumiendo la investigación acerca de los cambios en el volumen regional y la densidad del tejido cerebral, el espesor cortical, la integridad de la sustancia blanca y la conectividad funcional. La limitación de espacio impide cubrir todos los trastornos del desarrollo y se aborda una selección representativa de estudios que examinan los correlatos neurales en autismo, trastorno por déficit de atención/hiperactividad, Síndrome X frágil, Síndrome de deleción 22q11.2, Síndrome de Williams, Síndrome de Down y Síndrome de Turner. Cuando es posible se destacan los estudios que identifican una interacción entre la edad yel diagnóstico, lo que sugiere una alteración en el curso del desarrollo. Los estudios revisados en general cubren el período de desarrollo entre la infancia y la adultez inicial. En los últimos 20 años, con tecnología de resonancia magnética, se han realizado grandes progresos en el mapeo de cómo madura el cerebro. Se espera que con tecnologías cada vez mejores se acelere este progreso, se posibilite una comprensión más profunda del desarrollo cerebral y se puedan realizar intervenciones más efectivas para los trastornos del neurodesarrollo.
Introduction
Brain development is a dramatic process that unfolds throughout the first decades of life, gradually transforming the brain, and involving both microscopic and macroscopic changes. By far the greatest developmental changes occur by the early twenties, and frontal brain regions are among the last to fully matureCitation1; even so, many developmental processes, such as myelination, continue throughout life, only to be overtaken by degenerative changes in old age.
Using postmortem examinations of tissue, the age at which synaptic density peaked for a range of cortical areas was investigated by tracking changes in synaptic density at different ages.Citation2 Among the last regions to mature are those responsible for higher-level cognition, which is still developing in adolescents (reviewed in ref 3)Citation3. Some neuropsychiatric disorders emerge in childhood or adolescence and distinctly alter the developmental trajectory for both brain structure and function. By studying characteristic patterns of abnormalities in these disorders, many clues emerge about biological mechanisms contributing to a range of psychiatric illnesses and neurodevelopmental disorders. A more mechanistic understanding of each disorder is crucial—for more effective diagnosis, to better design interventions, and better understand treatment effects. With constantly improving technology, we can now visualize neural structures, axonal pathways, and functional connections with ever-increasing precision.
Here we review recent neuroimaging research in the fields of typical and atypical development, focusing primarily on studies from age 4 to early adulthood. There are now many studies of infancy and even fetal development with magnetic resonance imaging (MRI),Citation4 but the vast majority of pediatric MRI studies evaluate children old enough to keep still for the duration of a scan, making later ages somewhat easier to study. We cover structural imaging methods, such as voxel-based and tensor-based morphometry (VBM and TBM), structural connectivity analyses, using diffusion tensor imaging and high angular resolution diffusion imaging (DTI and HARDI), and functional connectivity analyses, using graph theory, independent components analysis (ICA), and seed-based methods. We describe these approaches in the Typical Development section. We will not cover functional development, as many studies are task-specific and would require much more space to review. In addition to covering development of healthy individuals (Table I), we review the neuroimaging literature on a number of neurodevelopmental disorders (Table II), including autism, attention deficit-hyperactivity disorder (ADHD), Fragile X, 22q11.2 deletion syndrome, Williams syndrome, Down syndrome, and Turner syndrome. Where possible, we selected studies that examined the interaction of age and diagnosis, but in some cases we discuss studies simply addressing the effects of a disorder on the brain, as fewer studies have mapped disease effects on the entire developmental trajectory. A few other recent reviews focus on the development of brain structure,Citation5 functional connectivity,Citation6,Citation7 or structural connectivityCitation8-Citation11 either in typically developing or atypically developing individuals.Citation7,Citation12 In this review, we address each of these topics, but readers are encouraged to refer to these reviews, in addition to the articles we cite here.
Table I Studies investigating typical development that are reviewed in this paper. Bold indicates study that examined age* diagnosis effect. *, no gender information; AD, autism; ADHD, attention deficit/hyperactivity disorder; PBD, pediatric bipolar disorder; FX, fragile X; DD, developmental delay; 22q, 22q11.2 deletion syndrome; WS, Williams syndrome; DS, Down syndrome; TS, Turner syndrome; TD, typically developing; (# F), number of female participants; yo, years old; mo, months old; MRI, magnetic resonance imaging; GMD, gray matter density; DTI, diffusion tensor imaging; ROI, region of interest; HARDI, high angular resolution diffusion imaging; ICA, independent components analysis; ‡ indicates study for which we have included a figure
Table II Studies investigating neurodevelopmental disorders that are reviewed in this paper. Bold indicates study that examined age* diagnosis effect. AD, autism disorder; TD, typically developing; DTI, diffusion tensor imaging; FX, Fragile X; DD, developmental delay; ADHD, attention deficit-hyperactivity disorder; WS, Williams syndrome; ICA, independent components analysis; * = no gender information; (# F), number of female participants. ‡ indicates study for which we have included a figure; # indicates study listed in multiple places
Typical development
An exhaustive review of all studies of typical development with various neuroimaging methods is beyond the scope of this paper, so we will highlight illustrative examples that reflect some general trends in the field (Table I).
Structural MRI
A vast number of methods have been used to investigate changes in brain structure. The most traditional way to measure anatomical changes in the brain is to identify the substructures of brain—often by manual tracing, or more recently by using automated computer programs to measure their volumes. By parcellating the brain into regions with different functions, such as the major lobes, the subcortical nuclei, and cortical regions, several early landmark studies generated “growth curves,” or norms, to show how the size of different brain regions increases—or decreases—with age. Around the year 2000, the first studies were published describing data from large cohorts of children scanned with MRI. Distinct and characteristic growth trajectories were found for each brain region,Citation13 with some notable sex differences.Citation14-Citation16
A more detailed picture of the developmental trajectory emerged with the advent of voxel-based brain mapping methods.Citation17,Citation18 Voxel-based statistical approaches can create a color-coded 3D map of growth rates at each location in the brain, or changes in cortical thickness. Alternatively, they can simply test if the density or thickness of a tissue in a brain region is affected by age, or if it relates to a clinical variable of interest. One such statistical mapping method, VBM, begins by spatially normalizing all MRI scans from a group of subjects into the same space. The scans are then segmented into gray matter, white matter, and cerebrospinal fluid (CSF), maps of each tissue are smoothed, and statistical tests are performed at each voxel—or 3D location—in the brain, to determine where age related changes occur, and what other factors affect the brain measures. The values in VBM analyses then represent the average proportion of gray matter in a small region around any given voxel. To be clear, “density” here is not intended to measure axonal or cellular packing density,Citation19 but it offers a gross anatomical measure of regional tissue volumes, offering spatial detail on the pattern of tissue in the brain.
TBM is a more computationally intensive method, in which a deformation field is obtained for each subject, warping their brain to match a common brain template, and encoding the relative positions of various brain landmarks. Tensor fields, or Jacobian matrices, are then calculated from the gradient of the deformation field, at each point, representing the volume of the unit-cube after the deformation.Citation20 From these, it is possible to determine the degree of regional volume expansion or shrinkage across scans taken at different times,Citation21 or to determine anatomical differences in a set of scans. These can then be analyzed statistically, to identify characteristic diagnostic group differences, age effects, or links with clinical or cognitive measures.
Cortical thickness assessments use semiautomated methods to reconstruct 3D representations of the gray matter–white matter boundary and the pial surface, and they calculate the distance between the two for every point across the cortex.Citation22,Citation23 Using cortical thickness maps, timelapse movies have been created to show the shifting pattern of cortical thinning in typically developing children between ages 4 and 21,Citation1 and in disorders such as childhood-onset schizophrenia,Citation24,Citation25 or before and after the onset of bipolar disorder.Citation26
Between age 5 and adulthood, important changes occur in higher cognitive functions that in part reflect changes in brain structure. Total brain volume increases with age, and many studies have found that the growth rate varies across the brain, and over time. Gray matter volume increases into adolescence, when it plateaus and begins to decline, but white matter volume usually increases into adulthood.Citation13,Citation27
Myelination continues throughout life—even well into old age—and white matter volume reductions only begin to be observed when the balance between myelin production and degeneration tilts in favor of white matter loss.Citation28 If this is recognized, it avoids the misconception that some of the developmental processes “stop,” when in fact they continue but are often dominated by other more dramatic changes.
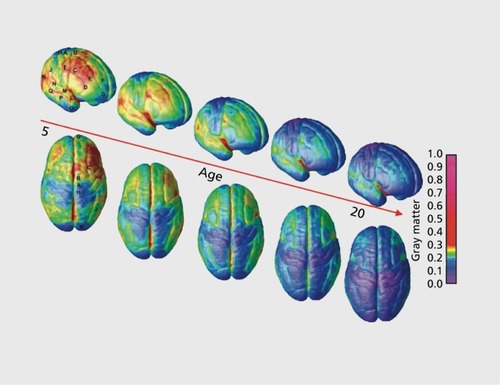
The age at which gray matter volume plateaus varies across the lobes, and temporal gray matter volume tends to reach a maximum last.Citation13 Within the lobes too, there is a great deal of variation in time to mature. In a whole-brain study, it was found that the prefrontal cortex and the posterior part of the superior temporal gyrus were shown to be the last to mature ().Citation1 In general, phylogenetically earlier structures—those supporting vision, hearing, and sensorimotor function—develop the most rapidly in infancy. To some extent, ‘ontogeny recapitulates phylogeny.’ Brain areas that support speech, language comprehension, and finally executive function, tend to develop in roughly the same sequence as they emerged during human evolution. Sowell et al similarly found that the posterior temporal cortex had a more protracted development.Citation29 For subcortical structures, they showed that as the brain grows in size, the proportion taken up by subcortical structures decreases, but at a different rate for males and females.Citation15 Additionally, they proposed that the decrease in gray matter, while due in part to cortical pruning (ie, synapse elimination and dendritic pruning), was also due in large part to the ongoing increase in white matter. They also examined cortical thickness between ages 5 and 11.Citation30 While large areas of cortex became thinner with age, cortical gray-matter in Broca's and Wernicke's areas thickened.
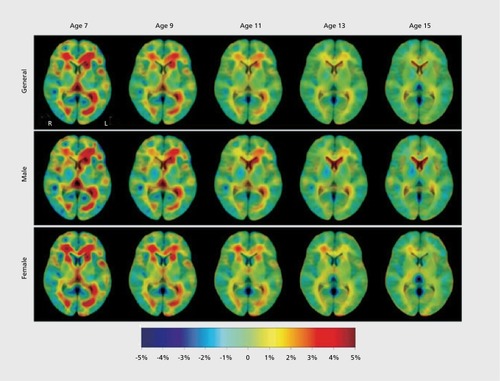
Hua et al used TBM to show regional brain changes in a longitudinal dataset from children, finding expansion of cerebral white matter and shrinkage of parietal, temporal, and occipital gray matter ().Citation31 Using TBM, one can create a picture of the mean growth rate, for each brain region, at any age. Tamnes et al examined age-related changes in a large cohort of subjects between ages 8 and 30 with both structural MRI (sMRI) and diffusion tensor imaging (DTI—described below)Citation32 They found prominent cortical thinning across the parietal lobe, superior medial frontal lobe, cingulate gyrus, prefrontal cortex, and occipital cortex. The rate of thinning was greatest in the youngest subjects, after which the rate slowed down.
Diffusion-weighted imaging
Diffusion-weighted imaging (DWI) is a variant of MRI scanning, which allows us to visualize, at a gross level, the rate of diffusion of water along axons. It can therefore be used to visualize axonal pathways. The MR signal is reduced when water is diffusing,Citation33 and it is possible to design an MRI protocol whose signals are depleted by water diffusing in a particular direction (a diffusion gradient image). By measuring diffusion in a large set of different directions (at least 6, but often as many as 30 to 256 directions), we can identify the primary directions of water diffusion in each voxel in the brain.
Diffusion tensor imaging (DTI) models water diffusion at each voxel as an ellipsoid or “tensor,” after which tractography may be used to follow and reconstruct the major white matter fiber bundles. HARD I is similar to DTI, but can map crossing fibers better, as it does not rely on the assumption that there is only one dominant fiber present in each voxel.Citation34 HARDI collects diffusion information from more angles and uses orientation distribution functions (ODFs), or other spherical functions—instead of tensors—to map the probability of water diffusion in every direction, leading to more accurate tractography.Citation35-Citation40 Fractional anisotropy (FA), the degree to which water diffuses in one direction (along the axon), is one of the most widely used measures of axonal integrity. As a rule of thumb—which has many exceptions—higher FA and lower mean diffusivity (MD) tend to reflect more highly developed, more strongly myelinated tracts, with a higher axonal conduction speed. These measures are reproducible in children, providing reliable developmental biomarkers.Citation41
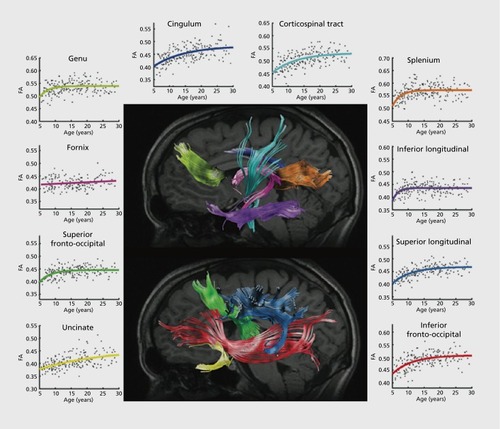
Specifically examining the frontal lobe white matter, Klingberg et al found significantly greater white matter fractional anisotropy in adults than in children.Citation42 They attributed this to a lesser degree of myelination in children; this is also consistent with visual inspection of brain MRI scans from infants, which often show limited white-matter contrast in poorly myelinated regions. Schmithorst et al expanded on earlier work, examining a range of specific tracts in subjects between 5 and 18 years old.Citation43 FA increased with age in the internal capsule, corticospinal tract, left arcuate fasciculus, and right inferior longitudinal fasciculus. Similar trajectories have been reported in DTI studies of the entire lifespan.Citation44 In one study, FA increased with age in the internal capsule, the white matter of the prefrontal cortex, corpus callosum, basal ganglia and thalamic pathways, and visual pathways.Citation45 Several of these regions underlie cognitive functions such as memory and attention, as well as motor skills. Eluvathingal et al examined 6 specific tracts and found three patterns in the results.Citation46 Various parts of the arcuate fasciculus, inferior longitudinal fasciculus, inferior fronto-occipital fasciculus, uncinate fasciculus, and corticospinal tract showed either increased in FA with decreases in other measures of diffusivity, or no detectable effect on FA and decreases in diffusivity. Only the somatosensory pathway showed no detectable age effect at all, probably because it matures very early in infancy, prior to the age range examined in that study. In a voxel-wise analysis, Qiu et al found widespread age effects on FA across the cerebellum, temporal, frontal, and parietal lobes.Citation47 Additionally, they found that reading scores (in Chinese and English) were associated with higher FA in a number of regions. Lebel et al found that the developmental trajectory of measures of anisotropy and diffusivity across most tracts were best fit with an exponential curve (). Citation48 Echoing structural studies above, they found the last tracts to mature were frontotemporal connections. In one of the largest brain imaging studies to date, Kochunov et al detailed how 11 major tracts change over the lifespan (age 11 to 90) in 831 subjects.Citation49 By charting the FA of these tracts across their subject pool, they reported the “age-at-peak” for each tract, as well as the rate of increase/decrease, along with sex differences, in some cases.
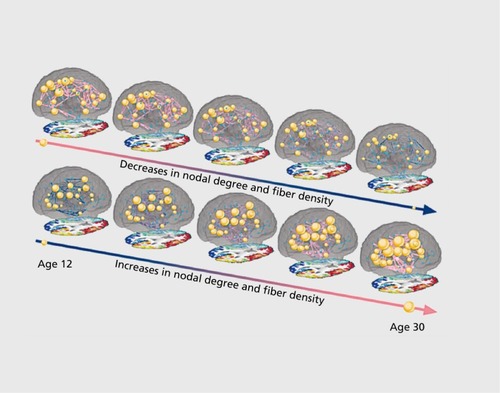
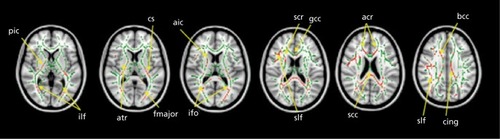
Using DTI-based connectivity analysis, Hagmann et al used graph theory to show that the efficiency of the brain's anatomical network increased with age—as did the number of detectable connections for each brain region.Citation50 Graph theory represents the brain as a set of nodes (brain regions) and edges (the connections between them). A number of standard parameters such as path length and modularity, to name a few, are used to describe network topology.Citation51 Characteristic path length measures the average path length in a network. It does not refer to the physical length of the tracts, but the number of edges, or individual “jumps,” between nodes in the network. Modularity is the degree to which a system may be subdivided into smaller networks. Graph theory can quantify more global features in brain connectivity patterns. These include network efficiency, or the degree to which the network is differentiated into modules. Using cortical connectivity matrices calculated from HARDI data, Dennis et al examined the developmental trajectory of graph theoretical measures of structural connectivity ().Citation52 Path length and modularity, among other measures, decreased with age, suggesting an increase in network integration. Interestingly, the left and right intrahemispheric networks, when analyzed separately, showed opposing age trends; some parameters increased with age in the left hemisphere, but decreased in the right. If this is corroborated in the future, it could point to different developmental processes in each hemisphere, perhaps due to the known structural asymmetry of the brain, which also increases with age.Citation15,Citation53 The level of structural brain asymmetry is also known to relates to the morphometry of corpus callosum, the major interhemispheric commissure,Citation54 so it may also relate to detectable differences in connectivity.
Dennis et al also found differences in the structural core of the brain, as the “rich club” is restructured and strengthened.Citation55 The “rich club” of the brain is the core of the network, made up of high-degree nodes that are highly interconnected and play an important role in network efficiency.Citation56
Functional connectivity
Resting-state fMRI (rsfMRI) is a branch of research based on the theory that distributed brain regions are functionally coupled, even if they are not directly structurally connected. In fact, the coherence (temporal correlations) in brain activity across disparate brain regions may be used to identify systems or networks in the brain that interact. Resting-state functional connectivity can be assessed through blood oxygenation level dependent (BOLD) time-courses of these distant regions, resulting in a number of intrinsic connectivity networks (ICNs) that are reliably found across individuals, and across studies. The main methods to assess functional connectivity are independent components analysis (ICA), seed-based analysis, and graph theory. ICA is a model-free approach, in which the four-dimensional resting-state data (the time-series) is decomposed into time courses and associated spatial maps, describing the temporal and spatial characteristics of the components making up the data.Citation57 Seed-based analysis is a model-based approach in which the researcher selects a seed region of interest, and extracts the time course of that seed. They then correlate that time course with the time-course of activations in the rest of the brain, searching for those that are most similar.Citation58 Regions whose time course is highly correlated with the seed are considered to be functionally coupled. Lastly, graph the ory can also be applied to functional images, exactly as discussed in the previous section. Graph theory is applicable to functional, anatomical, or diffusionweighted MRI—any scans that measure the relationship between brain regions in terms of correlation, coherence, mutual information, or physical measures of connectivity such as fiber density.
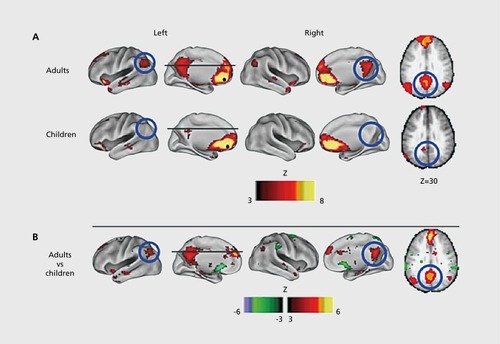
Focusing on regions involved in task control, Fair et al found that the period of development between 7 and 31 was marked by increases in segregation and integration, as distinct networks mature.Citation59 In the same dataset, they examined the maturation of the default mode network, and it was found to be only sparsely connected in children ().Citation60 The default mode network (DMN) is a network usually including the precuneus/posterior cingulate (PCC), medial prefrontal cortex (mPFC), hippocampus, inferior parietal lobule, and lateral temporal cortex.Citation61 These regions are more active during rest than during a task, hence the name “default mode” or “task negative” network.Citation62
Using five seeds in distinct regions of the anterior cingulate cortex it was found that over development, local patterns of connectivity evolved from diffuse to focused, and networks changed from exhibiting mostly local connectivity to include more distant brain regions.Citation63 Subjects' resting state data were able to be used to predict their age—their maturational curve accounted for more than half of the variation in their data.Citation64 Examining both structural and functional connectivity of DMN regions, it was found that the connectivity of the PCC-mPFC along the cingulum was the least mature in children.Citation65 Some regions that were poorly connected structurally in children still had strong functional connectivity. This suggests that the saying “what fires together, wires together”Citation66 may hold on a larger scale—the functional coupling of some brain regions may strengthen their structural connectivity over time.
In a cohort of subjects scanned multiple times—both within scan session and between sessions separated by a few years—it was demonstrated that rsfMRI can reliably map brain networks in children and adolescents.Citation67 A study that focused less on the specific regions connected and more on the quality of the connections found that children's functional networks tended to include more voxels and than did those of adults.Citation68 This supports earlier hypotheses that maturation is marked by a process of refining and “focusing” of brain networks.
Neurodevelopmental disorders
While we cannot cover all neurodevelopmental disorders, here we review some of the more common or more commonly studied neurodevelopmental disorders (Table II).
Autism
Autism is a neurodevelopmental disorder characterized by deficits in social interaction and communication, and by repetitive behaviors. The prevalence of autism is estimated to be around 2.5 %Citation69 and is usually diagnosed by age 3.Citation70 Autism has a partially genetic basis, although the specific mechanisms that contribute to the disorder are complex and are not expected to be the same in all children with autism.Citation71
Structural MRI
A number of studies have compared individuals of a specific age group with autism with typically developing individuals; fewer have examined changes in the developmental trajectory associated with autism. In an impressively large study (N=188), Langen et al examined the development of the striatum in autistic and typicallydeveloping individuals.Citation72 They found opposite developmental trends in individuals with autism in the caudate and the nucleus accumbens, and an altered trajectory, albeit in the same direction, in the putamen. Ilardan et al examined longitudinal changes in cortical thickness in autistic boys, finding a greater decrease with age in cortical thickness in the autistic individuals than the typically developing boys.Citation73 Brun et al found that autistic boys had enlarged lobes compared with typically developing boys, but voxel-wise analyses also showed gray matter deficits in parietal, temporal, and occipital lobes.Citation74 Mengotti et al examined changes in the developmental trajectory of both regional brain volume and structural connectivity in individuals with autism and found that the volume of the inferior temporal cortex, superior and inferior parietal lobule, and superior occipital lobe were larger in individuals with autism, while the volumes of the inferior frontal cortex and supplementary motor cortex were smaller.Citation75 Hua et al examined longitudinal data, and the trajectory of white matter growth was slowed in autistic boys, especially in the parietal lobe.Citation76 In gray matter, they found accelerated growth in the anterior cingulate cortex and putamen.
Diffusion-weighted imaging
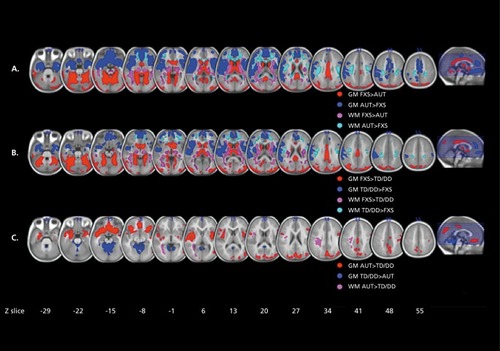
Diffusion imaging studies of autism show widespread disruption of white matter tracts, especially between regions implicated in social behavior ().Citation77-Citation79
According to one theory of autism, at least a subset of children with autism experience an initial brain “overgrowth,” after which typically developing children catch up and surpass autistic children. This is a debated hypothesis in the field, however,Citation80,Citation81 and it may apply to some autistic children but not others. Various findings support this. Significantly accelerated maturation of the white matter has been found in autistic children.Citation82 Following this overgrowth, the autistic brain may fail to effectively prune connections, leading to disorganization. One region has been found to show an interaction of age with diagnostic group: the right posterior limb of the internal capsule decreased in FA with age in typically developing individuals, but it increased with age in individuals with autism.Citation83 It has also been found that the apparent diffusion coefficient (ADC) was negatively associated with age across most of the cortex and the splenium of the corpus callosum in autistic individuals, but no detectable associations with age in typically developing individuals were found.Citation75
Functional connectivity
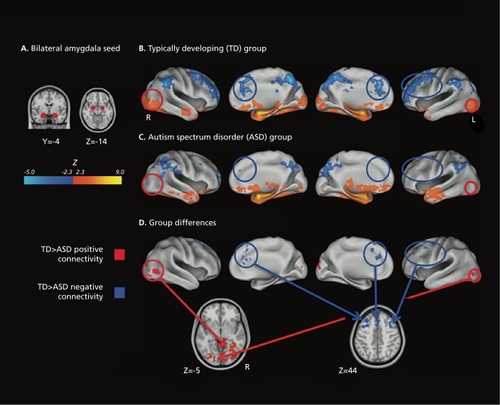
We were unable to find any reports of an age by diagnosis interaction effect on functional connectivity in autism. A number of studies have reported effects of autism diagnosis on intrinsic connectivity networks (ICNs). One set of studies supports the theory that autism results from widespread underconnectivity in the brain.Citation84-Citation88 Monk et al found a correlation between social functioning and the degree of connectivity between the posterior cingulate and the superior frontal gyrus; those with poorer skills exhibited weaker connectivity.Citation89 They also found stronger functional connectivity in autistic subjects between the posterior cingulate and the temporal lobe and parahippocampal gyrus. One study reported generally more extensive functional connectivity in autistic individuals, challenging the underconnectivity hypothesis, but this study had fewer subjects than any of the others.Citation90 Addressing the question in a different way, some have found both reduced integration within network and reduced segregation between networks in individuals with autism ().Citation91,Citation92
Attention deficit/hyperactivity disorder
Attention deficit/hyperactivity disorder (ADHD) is a common neurodevelopmental disorder, disproportion-ately diagnosed in boys.Citation93 It is a heterogeneous disorder with a strong familial factor.Citation94
Structural MRI
There are many studies reporting brain structural differences in individuals with ADHD, but they do not appear to have arrived at a consensus. Widespread differences in gray matter volume are reported, while other reports discuss more specific regions of differences in volume, focusing on the parietal and temporal areas of the brain, respectively.Citation95-Citation98 Some studies have found a thinner corpus callosum,Citation99 and widespread differences in cortical thickness.Citation100 In a longitudinal study, Shaw et al reported thinner cortex in children with ADHD, across a number of areas important for attentional control.Citation101 Additionally, while mean cortical thickness showed consistent differences across development, there was an age by diagnosis effect in the right parietal cortex. A similar longitudinal study by these authors found that the “age at peak” for cortical thickness was significantly delayed in children with ADHD, especially in the prefrontal cortex.Citation102
Diffusion-weighted imaging
A number of studies have found disruption in white matter tracts implicated in the pathophysiology of ADHD.Citation103-Citation106 Silk et al examined subjects with ADHD between ages 8 and 18.Citation107 The mean FA of the whole brain for both groups increased with age, with localized increases in FA in the ADHD subjects. Further analysis suggested that these increases were in fact due to decreased neural branching in subjects with ADHD. Looking specifically at the FA of the basal ganglia in the same subject pool, they also found differences in the developmental trajectory of the caudate.Citation108 Similarly, Tamm et al also found greater FA and axial diffusivity in ADHD subjects specifically in frontostriatal pathways, perhaps due to decreased branching ().Citation109 Lawrence et al found that white matter disruptions in individuals with ADHD were also found to some degree in their siblings, suggesting a strong familial factor.Citation110
Functional connectivity
A few studies have found that the functional connectivity within the DMN (default mode network) is disrupted or decreased in ADHD.Citation106,Citation111 Along with increases in the regional homogeneity in the occipital cortex, decreases in the regional homogeneity of the frontostriatal-cerebellar circuits were found in boys with ADHD.Citation112 This fits with some current hypotheses regarding the pathophysiology of ADHD. Using graph theory, decreased global efficiency and increased local efficiency in ADHD were found, pointing to a shift from the typical “small-world” networks towards less biological “regular” networks.Citation113 Small-world networks have a balance of network integration and segregation and are most efficient, while a regular or lattice network is highly segregated, a topology that is rarely found in functioning biological networks.
Neurogenetic disorders
Fragile X syndrome
Fragile X (FX) is caused by an expansion of the CGG repeat in the 5’ untranslated region of the fragile X mental retardation 1 (FMR1) gene, leading to a loss or decrease in functionality of fragile X mental retardation protein (FMRP). It is a common genetic cause of intellectual disability,Citation114 especially in boys.
Structural MRI
In a longitudinal study, Hoeft et al found altered developmental trajectories in the gray matter volume of the orbital gyri, basal forebrain, and thalamus in young boys with FX, along with a number of differences that persisted across development.Citation115 Differences in the white matter volume of the frontostriatal regions became more pronounced with age. Also using a longitudinal design, Hazlett et al found generalized brain overgrowth in boys with FX, especially in the temporal lobe, cerebellum, and caudate.Citation116 Looking at a main effect of diagnosis, Lee et al found volumetric increases in the caudate and ventricles—abnormalities that correlated with the degree of reduction in the FMRP protein in females.Citation117 Comparing boys with FX with those with AD, idiopathic developmental delay, and typically developing boys, Hoeft et al found widespread reductions in frontal and temporal gray and white matter in young boys with FX ().Citation118
Diffusion-weighted imaging
Studies of white matter integrity in fragile X report abnormalities mainly in the frontostriatal pathways. Decreased FA in females with FX, and increased fiber density in males with FX, have both been found in frontostriatal regions.Citation119,Citation120
Functional connectivity
We were unable to find any studies of functional connectivity in Fragile X.
22q11.2 Deletion syndrome
22q11.2 Deletion syndrome (22q DS), also called velocardiofacial syndrome and DiGeorge syndrome (among other names), is caused by a deletion on chromosome 22 and results in a heterogeneous spectrum of physiological, neurological, and psychological symptoms.Citation121 Several of the 30 genes encoded in the deleted segment are highly expressed in the developing brain and known to affect early neuronal migration. Several neuroimaging studies have pointed to abnormal patterns of cortical thinning and white matter impairments.
Structural MRI
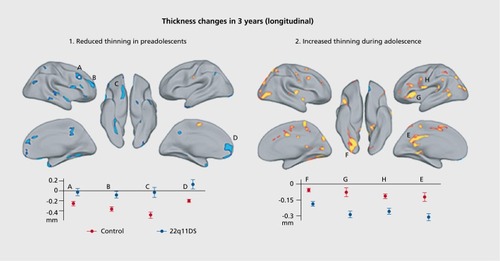
In a cross-sectional study, Schaer et al found altered developmental trajectories of cortical thickness in 22q DS, with a decreased rate of thinning in childhood followed by an increased rate of cortical thinning in late adolescence ().Citation122
This study built on earlier work by Bearden et al suggesting regionally specific cortical thinning in 22q DS, in superior parietal cortices and right parie to-occipital cortex, regions critical for visuospatial processing, and bilaterally in the most inferior portion of the inferior frontal gyrus (pars orbitalis), a key area for language development.Citation123 A later study of the same cohort also used fractal dimension analysis to reveal altered complexity and gyrification in 22q DS,Citation124 a further index of disturbed cortical development. Studies of volumetric changes in the gray matter in 22q DS have found reductions in the cerebellum and posterior areas of the posterior and occipital areas and expansions in the frontal lobes,Citation125,Citation126 although one group found reductions in the frontal lobe as well.Citation127 Looking specifically at which individuals with 22q DS developed psychosis, Gothelf et al found that greater reduction of the left DLPFC predicted greater psychotic symptoms. 22q DS is a heterogeneous disorder, which predisposes individuals to a range of other psychiatric and neurological issues.Citation128 This heterogeneity might explain some of the lack of agreement across studies. In the white matter, volume is reduced in individuals with 22q DS, across the cerebellum, internal capsule, and frontal cortex.Citation125,Citation126 Srivastava et al found abnormalities in the development of the cortical gyri in children with 22q DS, specifically in areas important for visuospatial, attentional, and numerical cognition tasks.Citation129
Diffusion-weighted imaging
Widespread changes in FA in 22q DS, including decreased FA in the corpus callosum, and increased FA in the cingulate and parietal lobe,Citation125 and widespread effects, with individuals with 22q DS (velocardiofacial syndrome in the paper) having decreased FA across the frontal, parietal, and temporal white matterCitation130 have also been found. In a more recent study, Villalon et al found that girls with 22q11.2DS showed lower fractional anisotropy (FA) than controls in the association fibers of the superior and inferior longitudinal fasciculi, the splenium of the corpus callosum, and the corticospinal tract.Citation131
Functional connectivity
Only one study, to our knowledge, has examined howindividuals with 22q DS differ in functional connectivity. Debbane et al found widespread changes in functional connectivity using ICA to compare networks between groups.Citation132 Individuals with 22q DS had altered connectivity in the default mode network, with both increased connectivity between lateral frontal regions and the inferior parietal lobule and decreased connectivity between medial frontal regions and the precuneus. They also found altered connectivity in visual, sensorimotor, and visuospatial networks.
Williams syndrome
Williams syndrome (WS) is a disorder caused by a hemizygous deletion of chromosome 7qll.23 resulting in physiological, intellectual, and behavioral abnormalities.Citation133
Structural MRI
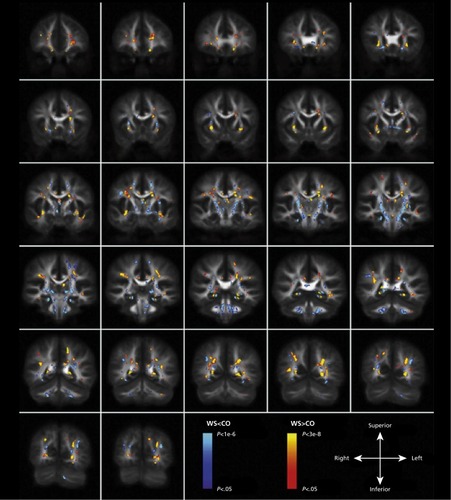
Thompson et al found a pattern of excesses and deficits in cortical thickness in WS, along with alterations in the complexity of the gyral pattern.Citation134 Using a fractal dimension analysis of the cortical surface, abnormalities of gyral folding were found, consistent with reports of altered sulcal patterns, especially in perisylvian regions, in people with WS.Citation135 The analysis of cortical patterns using surface-based analyses of local curvature has also revealed gyral-sulcal anomalies in WS.Citation136,Citation137 The shape anomalies are also found subcortically at midline,Citation138 and have been characterized using mesh-based shape analysis methods. Boddaert et al found reductions in the gray matter volume of the left parieto-occipital region in children with WS, which overlapped with prior findings in adults with WS.Citation139 Chiang et al similarly found reductions in the parietal and occipital regions, along with subcortical structures including the basal ganglia and thalamus, and the volumes of these structures were positively correlated with IQ.Citation140 Meda et al also found the basal ganglia to be significantly reduced in WS.Citation141 Additionally, individuals with WS had increased cortical thickness and/or decreased surface area in a number of ROIs across parietal, occipital, and frontal regions. Even the smaller subcortical gray matter nuclei, such as the amygdalaCitation142 and caudate nucleus,Citation143 show shape anomalies in WS, and their implications for cognition and behavior are only just beginning to be understood.
Diffusion-weighted imaging
DWI studies of Williams syndrome have shown increases in FA in the superior longitudinal fasciculus and inferior longitudinal fasciculus, association pathways important for language, memory, visuospatial processing, and object processing, to name a few ().Citation144-Citation146 Reduced FA in the uncinate fasciculus—one of the fiber tracts connecting the limbic system—has also been found.Citation145-Citation147 Looking specifically at tracts related to the fusiform gyrus, Haas et al found both an increased volume of fibers and increased FA in individuals with WS. Face processing is altered in WS, and these results may explain these abnormalities.Citation148
Functional connectivity
We were unable to find any studies examining functional connectivity in WS.
Chromosomal disorders
Down syndrome
Down syndrome (DS), or trisomy 21, is a common chromosomal disorder and the most common cause of intellectual disability.Citation149 There are surprisingly few brain imaging studies of DS in children. DS increases the risk of developing Alzheimer's-like dementia with age, so many more studies focus on adults with DS.Citation150
Structural MRI
Total brain volume is decreased in DS,Citation151,Citation152 and certain structures are disproportionately affected. Consistent with adult imaging studies, the hippocampus is reduced in DS, but there is conflicting information as to whether the amygdala is as well.Citation151,Citation152 Children with DS were found to have reduced frontal and temporal lobe volumes.Citation152 The differences in the hippocampus are particularly intriguing given the increased risk for dementia in DS individuals.
Diffusion-weighted imaging
We were unable to find any studies of white matter integrity in DS in children.
Functional connectivity
To our knowledge, no studies have examined functional connectivity in DS.
Turner syndrome
Another chromosomal disorder, Turner syndrome (TS) results from the absence of one X chromosome in girls, resulting in a number of changes physically, hormonally, and neurologically.Citation153
Structural MRI
A number of studies have examined brain volume in TS, generally finding decreased brain volume in the parietal and occipital regions.Citation154-Citation156 The hippocampus and subcortical structures such as the thalamus and basal ganglia are also reduced in TS,Citation154,Citation157 but the amygdala is larger.Citation157
Diffusion-weighted imaging
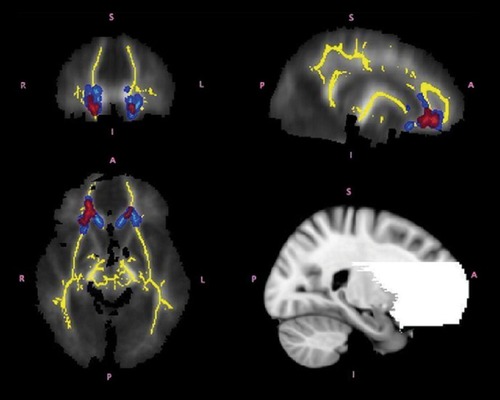
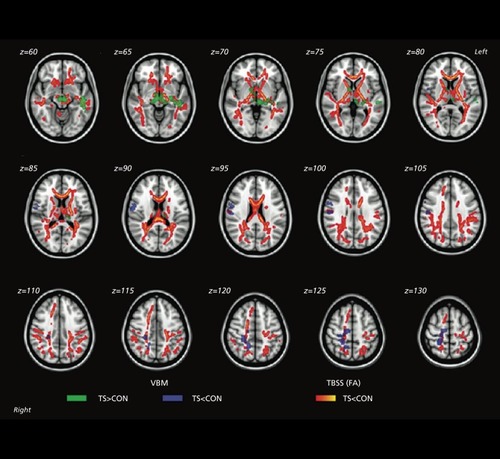
DWI studies in TS reveal abnormalities across a large area of the white matter. Molko et al found microstructural differences in the temporal lobe, especially tracts running anterior-posterior in the temporal lobe.Citation158 Holzapfel et al found lower FA in the pallidum, internal capsule, and prefrontal cortex, as well as in the parieto-occipital region, extending into the superior longitudinal fasciculus.Citation159 Yamagata et al found lower FA in a wide array of regions implicated in visuopatial processing, face processing, and sensorimotor and social abilities, including a number of association, commissural, and projection fibers ().Citation160 In one DTI study comparing TS with Fragile X syndrome and 22q DS, Villalon et al, found that girls with TS had lower FA in the inferior longitudinal fasciculus, right internal capsule and left cerebellar peduncle.Citation131 Even so, partially overlapping white matter anomalies were detected in all three neurogenetic disorders. They suggested that altered white matter integrity in the superior and inferior longitudinal fasciculi and thalamic to frontal tracts may contribute to the behavioral characteristics of all of these disorders.
Functional connectivity
Based on the known deficits girls with TS experience in working memory tasks, one study examined functional connectivity during a working memory task.Citation161 Reduced connectivity was found between parietal and dorsal frontal regions, which correlated with task performance. A second study examined the specific connectivity of the posterior parietal cortex, finding differential clustering in TS, which may underlie the visuospatial processing deficits in TS.Citation162
Conclusion
In this paper, we have reviewed representative research over the last 20 years investigating brain development using neuroimaging techniques. We discussed both healthy development and neurodevelopmental disorders, including autism, ADHD, fragile X, 22q DS, Williams syndrome, Down syndrome, and Turner syndrome. Hie brain undergoes remarkable changes in structure and connectivity as it matures into adulthood. The developmental trajectory of these brain measures is important to identify for our fundamental understanding of the brain and of neurodevelopmental disorders. Disrupted brain structure or connectivity can lead to neurodevelopmental or neuropsychiatric disorders. Understanding these disorders and their developmental trajectory in greater detail should expedite the discovery and more efficient evaluation of effective interventions.
Selected abbreviations and acronyms
| DMN | = | default mode network |
| DTI | = | diffusion tensor imaging |
| FA | = | fractional anisotropy |
| FX | = | fragile X |
| HARDI | = | high angular resolution diffusion imaging |
| ICA | = | independent components analysis |
| TBM | = | tensor-based morphometry |
| VBM | = | voxel-based morphometry |
REFERENCES
- GogtayN.GieddJN.LuskL.et alDynamic mapping of human cortical development during childhood through early adulthood.Proc Natl Acad Sci U S A.20041018174817915148381
- HuttenlocherPR.DabholkarAS.Regional differences in synaptogenesis in human cerebral cortex.J Comp Neurol.19973871671789336221
- BlakemoreS-J.ChoudhuryS.Development of the adolescent brain: implications for executive function and social cognition.J Child Psychol Psychiatry.20064729631216492261
- ThomasonME.DassanayakeMT.ShenS.et alCross-hemispheric functional connectivity in the human fetal brain.Sci Transl Med.20135173ra24
- HedmanAM.Van HarenNEM.SchnackHG.KahnRS.Hulshoff PolHE.Human brain changes across the life span: a review of 56 longitudinal magnetic resonance imaging studies.Hum Brain Mapp.2012331987200221915942
- PowerJD.FairDA.SchlaggarBL.PetersenSE.The development of human functional brain networks.Neuron.20106773574820826306
- UddinLQ.SupekarK.MenonV.Typical and atypical development of functional human brain networks: insights from resting-state FMRI.Front Syst Neurosci.2010411220204156
- PausT.CollinsDL.EvansAC.LeonardG.PikeB.ZijdenbosA.Maturation of white matter in the human brain: a review of magnetic resonance studies.Brain Res Bull.20015425526611287130
- CascioCJ.GerigG.PivenJ.Diffusion tensor imaging: application to the study of the developing brain.J Am Acad Child Psychiatry.200746213223
- AssafY.PasternakO.Diffusion tensor imaging (DTI)-based white matter mapping in brain research: a review.J Mol Neurosci.200834516118157658
- SchmithorstVJ.WilkeM.DardzinskiBJ.HollandSK.Correlation of white matter diffusivity and anisotropy with age during childhood and adolescence: a cross-sectional diffusion-tensor MR imaging study.Radiology.200222221221811756728
- WalterE.MazaikaPK.ReissAL.Insights into brain development from neurogenetic syndromes: evidence from fragile X syndrome, Williams syndrome. Turner syndrome and velocardiofacial syndrome.Neuroscience.200916425727119376197
- GieddJN.BlumenthalJ.JeffriesNO.et alBrain development during childhood and adolescence: a longitudinal MRI study.Nat Neurosci.1999286186310491603
- LenrootRK.GogtayN.GreensteinDK.et alSexual dimorphism of brain developmental trajectories during childhood and adolescence.Neurolmage.20073610651073
- SowellER.TraunerDA.GamstA.JerniganTL.Development of cortical and subcortical brain structures in childhood and adolescence: a structural MRI study.Dev Med Child Neurol.20024441611811649
- SowellE.PetersonBS.KanE.et alSex differences in cortical thickness mapped in 176 healthy individuals between 7 and 87 years of age.Cereb Cortex.2007171550156016945978
- AndreasenNC.ArndtS.SwayzeV.et alThalamic abnormalities in schizophrenia visualized through magnetic resonance image averaging.Science.19942662942987939669
- PausT.ZijdenbosA.WorsleyK.et alStructural maturation of neural pathways in children and adolescents: in vivo study.Science.19992831908191110082463
- AshburnerJ.FristonKJ.Voxel-based morphometry - the methods.Neurolmage.200011805821
- AshburnerJ.FristonKJ.Morphometry. In: Ashburner J, Friston KJ, Penny W, eds.Human Brain Function. 2nd ed. San Diego, CA: Academic;2003
- ThompsonPM.GieddJN.WoodsRP.MacDonaldD.EvansA.TogaA.Growth patterns in the developing brain detected by using continuum mechanical tensor maps.Nat Lett.200040414
- DaleAM.FischlB.SerenoMl.Cortical surface-based analysis.Neurolmage.19999179194
- ThompsonPM.HayashiKM.SowellER.et alMapping cortical change in Alzheimer's disease, brain development, and schizophrenia.Neurolmage.200423S2S18
- ThompsonPM.VidalC.GieddJN.et alMapping adolescent brain change reveals dynamic wave of accelerated gray matter loss in very earlyonset schizophrenia.Proc Natl Acad Sci U S A.200198116501165511573002
- VidalCN.RapoportJL.HayashiKM.et alDynamically spreading frontal and cingulate deficits mapped in adolescents with schizophrenia.Arch Gen Psychiatry.200663253416389194
- GogtayN.OrdonezA.HermanDH.et alDynamic mapping of cortical development before and after the onset of pediatric bipolar illness.J Child Psychol Psychiatry.20074885286217714370
- ThompsonPM.SowellER.GogtayN.et alStructural MRI and brain development.Int Rev Neurobiol.20056728532316291026
- BartzokisG.LuPH.TingusK.et alLifespan trajectory of myelin integrity and maximum motor speed.Neurobiol Aging.2010311554156218926601
- SowellER.PetersonBS.ThompsonPM.WelcomeSE.HenkeniusAL.TogaAW.Mapping cortical change across the human life span.Nat Neurosci.2003630931512548289
- SowellER.ThompsonPM.LeonardCM.WelcomeSE.KanE.TogaAW.Longitudinal mapping of cortical thickness and brain growth in normal children.J Neurosci.2004248223823115385605
- HuaX.LeowAD.LevittJG.CaplanR.ThompsonPM.TogaAW.Detecting brain growth patterns in normal children using tensor-based morphometry.Hum Brain Mapp.20093020921918064588
- TamnesCK.OstbyY.FjellAM.WestlyeLT.Due-TonnessenP.WalhovdKB.Brain maturation in adolescence and young adulthood: regional agerelated changes in cortical thickness and white matter volume and microstructure.Cereb Cortex.20102053454819520764
- StejskalEO.TannerJE.Spin Diffusion measurements: spin echoes in the presence of a time-dependent field gradient.J Chem Phys.196542288292
- JahanshadN.AganjI.LengletC.et alSex differences in the human connectome: 4-Tesla high angular resolution diffusion imaging (HARDI) tractography in 234 young adult twins. In:Proc. 8th IEEE ISBI, Chicago.2011939943
- TuchDS.ReeseTG.WiegellMR.MakrisN.BelliveauJW.WedeenVJ.High angular resolution diffusion imaging reveals intravoxel white matter fiber heterogeneity.Magn Reson Med.20024857758212353272
- TournierJD.CalamanteF.GadianDG.ConnellyA.Direct estimation of the fiber orientation density function from diffusion-weighted MRI data using spherical deconvolution.Neurolmage.20042311761185
- ZhanL.LeowAD.BaryshevaM.et alInvestigating the uncertainty in multi-fiber estimation in High Angular Resolution Diffusion Imaging. In: Pohl K, Joshi S, Wells S.Workshop on Probabilistic Modeling in Medical Image Analysis (PMMIA), Medical Image Computing and Computer Assisted Intervention (MiCCAl). London, UK;2009
- CetingulHE.AfsariB.WrightMJ.ThompsonPM.VidalR.Group action induced averaging for HARDI processing. In:Proc 9th IEEE ISBI, Barcelona.201213891392
- CetingulHE.NadarM.ThompsonP.SapiroG.LengletC.Simultaneous ODF Estimation and Tractography in HARDI. In:Proc. 24th IEEE EMBS. San Diego;20128689
- JinY.ShiY.ZhanL.et alAutomatic population hardi white matter tract clustering by label fusion of multiple tract atlases. Paper presented at: Workshop on Multimodal Brain Imaging Analysis, Medical Image Computing and Computer Assisted Intervention (MICCAI). 2012. Nice
- BonekampD.NagaeLM.DegaonkarM.et alDiffusion tensor imaging in children and adolescents: Reproducibility, hemispheric, and agerelated differences.Neurolmage.200734733742
- KlingbergT.VaidyaCJ.GabrieliJD.MoseleyME.HedehusM.Myelination and organization of the frontal white matter in children: a diffusion tensor MRI study.NeuroReport.1999102817282110511446
- SchmithorstVJ.YuanW.White matter development during adolescence as shown by diffusion MRI.Brain Cogn.201072162519628324
- KochunovP.ThompsonPM.LancasterJL.et alRelationship between white matter fractional anisotropy and other indices of cerebral health in normal aging: tract-based spatial statistics study of aging.Neurolmage.200735478187
- Barnea-GoralyN.MenonV.EckertM.et alWhite matter development during childhood and adolescence: a cross-sectional diffusion tensor imaging study.Cereb Cortex.2005151848185415758200
- EluvathingalTJ.HasanKM.KramerL.FletcherJM.Ewing-CobbsL.Quantitative diffusion tensor tractography of association and projection fibers in normally developing children and adolescents.Cereb Cortex.2007172760276817307759
- QiuD.TanL-H.ZhouK.KhongP-L.Diffusion tensor imaging of normal white matter maturation from late childhood to young adulthood: Voxel-wise evaluation of mean diffusivity, fractional anisotropy, radial and axial diffusivities, and correlation with reading development.Neurolmage.200841223232
- LebelC.WalkerL.LeemansA.PhillipsL.BeaulieuC.Microstructural maturation of the human brain from childhood to adulthood.Neurolmage.20084010441055
- KochunovP.WilliamsonDE.LancasterJ.et alFractional anisotropy of water diffusion in cerebral white matter across the lifespan.Neurobiol Aging.2010112
- HagmannP.SpornsO.MadanN.et alWhite matter maturation reshapes structural connectivity in the late developing human brain.Proc Natl Acad Sci U S A.2010107190671907220956328
- SpornsO.ChialvoDR.KaiserM.HilgetagCC.Organization, development and function of complex brain networks.Trends Cogn Sci.200484182515350243
- DennisEL.JahanshadN.McMahonKL.et alDevelopment of brain structural connectivity between ages 12 and 30: a 4-Tesla diffusion imaging study in 439 adolescents and adults.Neurolmage.201364671684
- TogaAW.ThompsonPM.Mapping brain asymmetry.Nat Rev Neurosci.20034374812511860
- LudersE.RexDE.NarrKL.et alRelationships between sulcal asymmetries and corpus callosum size: gender and handedness effects.Cereb Cortex.2003131084109312967925
- DennisEL.JahanshadN.TogaAW.et alDevelopment of the “rich club” in brain connectivity networks from 438 adolescents & adults aged 12 to 30. In:Proc. 10th IEEE ISBI, San Francisco.2013620623
- van den HeuvelMP.SpornsO.Rich-Club Organization of the Human Connectome.J Neurosci.201131157751578622049421
- BeckmannCF.DeLucaM.DevlinJT.SmithSM.Investigations into resting-state connectivity using independent component analysis.Philos T Roy Soc B.200536010011013
- FoxMD.RaichleME.Spontaneous fluctuations in brain activity observed with functional magnetic resonance imaging.Nat Rev Neurosci.2007870071117704812
- FairDA.DosenbachNUF.ChurchJA.et alDevelopment of distinct control networks through segregation and integration.Proc Natl Acad Sci U S A.2007104135071351217679691
- FairDA.CohenAL.DosenbachNUF.et alThe maturing architecture of the brain's default network.Proc Natl Acad Sci U S A.20081054028403218322013
- RaichleME.MacLeodAM.SnyderAZ.PowersWJ.GusnardDA.ShulmanGL.A default mode of brain function.Proc Natl Acad Sci U S A.20019867668211209064
- FoxMD.SnyderAZ.VincentJL.CorbettaM.EssenDCV.RaichleME.The human brain is intrinsically organized into dynamic, anticorrelated functional networks.Proc Natl Acad Sci U S A.20051029673967815976020
- KellyAMC.Di MartinoA.UddinLQ.et alDevelopment of anterior cingulate functional connectivity from late childhood to early adulthood.Cereb Cortex.20091964065718653667
- DosenbachNUF.NardosB.CohenAL.et alPrediction of individual brain maturity using fMRI.Science.20103291358136120829489
- SupekarK.UddinLQ.PraterK.AminH.GreiciusMD.MenonV.Development of functional and structural connectivity within the default mode network in young children.Neurolmage.201052290301
- HebbDO.The Organization of Behavior. New York, NY: Wiley & Sons;1949
- ThomasonME.DennisEL.JoshiAA.et alResting-state fMRI can reliably map neural networks in children.Neurolmage.201155165175
- JollesDD.van BuchemMA.CroneEA.RomboutsSARB.A comprehensive study of whole-brain functional connectivity in children and young adults.Cereb Cortex.2011213859120542991
- KimYS.LeventhalBL.KohY-J.et alPrevalence of autism spectrum disorders in a total population sample.Am J Psychiatry.201116890491221558103
- LordC.RisiS.LambrechtL.CookEH Jr.et alThe Autism Diagnostic Observation Schedule-Generic: a standard measure of social and communication deficits associated with the spectrum of autism.J Autism Dev Dis.200030205223
- SzatmariP.PatersonAD.ZwaigenbaumL.et alMapping autism risk loci using genetic linkage and chromosomal rearrangements.Nat Genet.20073931932817322880
- LangenM.SchnackHG.NederveenH.et alChanges in the developmental trajectories of striatum in autism.Biol Psychiat.20096632733319423078
- HardanAY.LiboveRA.KeshavanMS.MelhemNM.MinshewNJ.A preliminary longitudinal magnetic resonance imaging study of brain volume and cortical thickness in autism.Biol Psychiatry.20096632032619520362
- BrunCC.NicolsonR.LeporeN.et alMapping brain abnormalities in boys with autism.Hum Brain Mapp.200930388790019554561
- MengottiP.D'AgostiniS.TerlevicR.et alAltered white matter integrity and development in children with autism: a combined voxel-based morphometry and diffusion imaging study.Brain Res Bull.20118418919521146593
- HuaX.ThompsonPM.LeowAD.et alBrain growth rate abnormalities visualized in adolescents with autism.Hum Brain Mapp.20133442543622021093
- Barnea-GoralyN.KwonH.MenonV.EliezS.LotspeichL.ReissAL.White matter structure in autism: preliminary evidence from diffusion tensor imaging.Biol Psychiatry.20045532332614744477
- Barnea-GoralyN.LotspeichL.ReissA.Similar white matter aberrations in children with autism and their unaffected siblings: a diffusion tensor imaging study using tract-based spatial statistics.Arch Gen Psych.20106710521060
- ShuklaDK.KeehnB.LincolnAJ.MtillerRA.White matter compromise of callosal and subcortical fiber tracts in children with autism spectrum disorder: a diffusion tensor imaging study.J Am Acad Child Adolesc Psychiatry.20104912691278.e221093776
- CourchesneE.CarperR.AkshoomoffN.Evidence of brain overgrowth in the first year of life in autism.JAMA.200329033734412865374
- HerbertMR.ZieglerDA.MakrisN.et alLarger brain and white matter volumes in children with developmental language disorder.Dev Sci.20036F11F22
- BashatDB.Kronfeld-DueniasV.ZachorDA.et alAccelerated maturation of white matter in young children with autism: a high b value DWI study.Neurolmage.2007374047
- KellerTA.KanaRK.JustMA.A developmental study of the structural integrity of white matter in autism.NeuroReport.200718232717259855
- CherkasskyVL.KanaRK.KellerTA.JustMA.Functional connectivity in a baseline resting-state network in autism.NeuroReport.20061716871689017047454
- JustMA.CherkasskyVL.KellerTA.KanaRK.MinshewNJ.Functional and anatomical cortical underconnectivity in autism: evidence from an fMRI study of an executive function task and corpus callosum morphometry.Cereb Cortex.20071795196116772313
- KennedyDP.CourchesneE.The intrinsic functional organization of the brain is altered in autism.Neurolmage.20083918771885
- WengS-J.WigginsJL.PeltierSJ.et alAlterations of resting state functional connectivity in the default network in adolescents with autism spectrum disorders.Brain Res.2010131320221420004180
- AssafM.JagannathanK.CalhounVD.et alAbnormal functional connectivity of default mode sub-networks in autism spectrum disorder patients.Neurolmage.201053247256
- MonkCS.PeltierSJ.WigginsJL.et alAbnormalities of intrinsic functional connectivity in autism spectrum disorders.Neurolmage.200947764772
- NoonanSK.HaistF.MullerR-A.Aberrant functional connectivity in autism: Evidence from low-frequency BOLD signal fluctuations.Brain Res.20091262486319401185
- RudieJD.ShehzadZ.HernandezLM.et alReduced functional integration and segregation of distributed neural systems underlying social and emotional information processing in autism spectrum disorders.Cereb Cortex.2012221025103721784971
- RudieJD.BrownJA.Beck-PancerD.et alAltered functional and structural brain network organization in autism.Neurolmage.201327994
- AndersonJC.WilliamsS.McGeeR.SilvaPA.DSM-III disorders in preadolescent children. Prevalence in a large sample from the general population.Arch Gen Psych.1987446976
- BiedermanJ.Attention-deficit/hyperactivity disorder: a selective overview.Biol Psychiatry.2005571215122015949990
- CarmonaS.VilarroyaO.BielsaA.et alGlobal and regional gray matter reductions in ADHD: a voxel-based morphometry study.Neurosci Lett.2005389889316129560
- CastellanosFX.LeePP.SharpW.et alDevelopmental trajectories of brain volume abnormalities in children and adolescents with attentiondeficit/hyperactivity disorder.JAMA.20022881740174812365958
- BrieberS.NeufangS.BruningN.et alStructural brain abnormalities in adolescents with autism spectrum disorder and patients with attention deficit/hyperactivity disorder.J Child Psychol Psyc.20074812511258
- KobelM.BechtelN.SpechtK.et alStructural and functional imaging approaches in attention deficit/hyperactivity disorder: does the temporal lobe play a key role?Psychiat Res: Neurolmage.2010183230236
- LudersE.NarrKL.HamiltonLS.et alDecreased callosal thickness in attention-deficit/hyperactivity disorder.Biol Psychiatry .200965848818842255
- SowellER.ThompsonPM.WelcomeSE.HenkeniusAL.TogaAW.PetersonBS.Cortical abnormalities in children and adolescents with attention deficit hyperactivity disorder.Lancet.20033621699170714643117
- ShawP.LerchJ.GreensteinD.et alLongitudinal mapping of cortical thickness and clinical outcome in children and adolescents with attentiondeficit/hyperactivity disorder.Arch Gen Psychiatry.20066354054916651511
- ShawP.EckstrandK.SharpW.et alAttention-deficit/hyperactivity disorder is characterized by a delay in cortical maturation.Proc Natl Acad Sci U S A.2007104196491965418024590
- AshtariM.KumraS.BhaskarSL.et alAttention-deficit/hyperactivity disorder: a preliminary diffusion tensor imaging study.Biol Psychiatry.20055744845515737658
- HamiltonLS.LevittJG.O NeillJ.et alReduced white matter integrity in attention-deficit hyperactivity disorder.NeuroReport.2008191705170818841089
- PavuluriMN.YangS.KamineniK.et alDiffusion tensor imaging study of white matter fiber tracts in pediatric bipolar disorder and attentiondeficit/hyperactivity disorder.Biol Psychiatry .20096558659319027102
- QiuM-G.YeZ.LiQ-Y.LiuG-J.XieB.WangJ.Changes of brain structure and function in ADHD children.Brain Topogr.20112424325221191807
- SilkTJ.VanceA.RinehartN.BradshawJL.CunningtonR.Structural development of the basal ganglia in attention deficit hyperactivity disorder: a diffusion tensor imaging study.Psychiatry Res: Neuroimage.2009172220225
- SilkTJ.VanceA.RinehartN.BradshawJL.CunningtonR.White-matter abnormalities in attention deficit hyperactivity disorder: a diffusion tensor imaging study.Hum Brain Mapp.2009302757276519107752
- TammL.Barnea-GoralyN.ReissAL.Diffusion tensor imaging reveals white matter abnormalities in attention-deficit/hyperactivity disorder.Psychiatry Res: Neurolmage.2012202150154
- LawrenceKE.LevittJG.LooSK.et alwhite matter microstructure in attention-def icit/hyperactivity disorder subjects and their siblings.J Am Acad Child Psychiatry.2013115
- FairDA.PosnerJ.NagelBJ.et alAtypical default network connectivity in youth with attention-deficit/hyperactivity disorder.Biol Psychiatry.2010681084109120728873
- CaoQ.ZangY.SunL.et alAbnormal neural activity in children with attention deficit hyperactivity disorder: a resting- state functional magnetic resonance imaging study.NeuroReport.2006171033103616791098
- WangL.ZhuC.HeY.et alAltered small-world brain functional networks in children with attention-deficit/hyperactivity disorder.Hum Brain Mapp.20093063864918219621
- VerkerkAJ.PierettiM.SutcliffeJS.et alIdentification of a gene (FMR1) containing a CGG repeat coincident with a breakpoint cluster region exhibiting length variation in fragile X syndrome.Cell.1991659059141710175
- HoeftF.CarterJC.LightbodyAA.HazlettHC.PivenJ.ReissAL.Regionspecific alterations in brain development in one- to three-year-old boys with fragile X syndrome.Proc Natl Acad Sci U S A.20101079335933920439717
- HazlettHC.PoeMD.LightbodyAA.et alTrajectories of early brain volume development in fragile X syndrome and autism.J Am Acad Child Adolesc Psychiatry.20125192193322917205
- LeeAD.LeowAD.LuA.et al3D Pattern of brain abnormalities in fragile X syndrome visualized using tensor-based morphometry.Neurolmage.200734924938
- HoeftF.WalterE.LightbodyA.et alNeuroanatomical differences in toddler boys with fragile X syndrome and idiopathic autism.Arch Gen Psychiatry.20116829530521041609
- Barnea-GoralyN.EliezS.HedeusM.et alWhite matter tract alterations in fragile X syndrome: Preliminary evidence from diffusion tensor imaging.Am J Med Genet.20031186818812627472
- HaasBW.Barnea-GoralyN.LightbodyA.et alEarly white-matter abnormalities of the ventral frontostriatal pathway in fragile X syndrome.Dev Med Child Neurol.20095159359919416325
- ShprintzenRJ.Velo-cardio-facial syndrome: a distinctive behavioral phenotype.Ment Retard Dev D R.20006142147
- SchaerM.DebbaneM.CuadraMB.et alDeviant trajectories of cortical maturation in 22q11.2 deletion syndrome (22q11DS): Across-sectional and longitudinal study.Schizophr Res.20091151829019836927
- BeardenCE.Van ErpTGM.DuttonRA.et alAlterations in midline cortical thickness and gyrif ication patterns mapped in children with 22q11.2 deletions.Cereb Cortex.20091911512618483006
- BeardenCE.Van ErpTGM.DuttonRA.et alMapping cortical thickness in children with 22q11.2 deletions.Cereb Cortex.2007171889189817056649
- SimonTJ.DingL.BishJP.McDonald-McGinnDM.ZackaiEH.GeeJ.Volumetric, connective, and morphologic changes in the brains of children with chromosome 22q11.2 deletion syndrome: an integrative study.Neurolmage.200525169180
- CampbellLE.CampbellLE.DalyE.et alBrain and behaviour in children with 22q11.2 deletion syndrome: a volumetric and voxel-based morphometry MRI study.Brain.20061291218122816569671
- ShashiV.KwapilTR.KaczorowskiJ.et alEvidence of gray matter reduction and dysfunction in chromosome 22q11.2 deletion syndrome.Psychiatry Res: Neuroim.201018118
- GothelfD.HoeftF.UenoT.et alDevelopmental changes in multivariate neuroanatomical patterns that predict risk for psychosis in 22q11.2 deletion syndrome.J Psychiatry Res.201145322331
- SrivastavaS.BuonocoreMH.SimonTJ.Atypical developmental trajectory of functionally significant cortical areas in children with chromosome 22q11.2 deletion syndrome.Hum Brain Mapp.20123321322321416559
- Barnea-GoralyN.MenonV.KrasnowB.KoA.ReissA.EliezS.Investigation of white matter structure in velocardiofacial syndrome: a diffusion tensor imaging study.Am J Psychiatry.20031601863186914514502
- VillalonJ.JahanshadN.BeatonE.TogaAW.ThompsonPM.SimonTJ.White matter microstructural abnormalities in children with chromosome 22q11.2 deletion syndrome. Fragile X or Turner syndrome as evidenced by diffusion tensor imaging.Neurolmage. In press.
- DebbaneM.LazouretM.LagioiaA.SchneiderM.Van De VilleD.EliezS.Resting-state networks in adolescents with 22q11.2 deletion syndrome: Associations with prodromal symptoms and executive functions.Schizophr Res.2012139333922704643
- BellugiU.LichtenbergerL.JonesW.LaiZ.GeorgeMS.I. The neurocognitive profile of Williams syndrome: a complex pattern of strengths and weaknesses.J Cogn Neurosci.20011272910953231
- ThompsonPM.LeeAD.DuttonRA.et alAbnormal cortical complexity and thickness profiles mapped in Williams syndrome.J Neurosci.2005254146415815843618
- EckertMA.GalaburdaAM.KarchemskiyA.et alAnomalous sylvian fissure morphology in Williams syndrome.Neurolmage.2006333945
- GaserC.LudersE.ThompsonPM.et alIncreased local gyrification mapped in Williams syndrome.Neurolmage.2006334654
- TosunD.ReissAL.LeeAD.et alUse of 3-D cortical morphometry for mapping increased cortical gyrification and complexity in Williams syndrome. In:Proc. 3rd IEEE ISBI, Arlington.200611721175
- LudersE.Di PaolaM.TomaiuoloF.et alCallosal morphology in Williams syndrome: a new evaluation of shape and thickness.NeuroReport.20071820320717314657
- BoddaertN.MochelF.Meressel.et alParieto-occipital grey matter abnormalities in children with Williams syndrome.Neurolmage.200630721725
- ChiangM-C.ReissAL.LeeAD.et al3D pattern of brain abnormalities in Williams syndrome visualized using tensor-based morphometry.Neurolmage.20073610961109
- MedaSA.PrywellerJR.Thornton-WellsTA.Regional brain differences in cortical thickness, surface area and subcortical volume in individuals with Williams syndrome.PLoS ONE.20127e3191322355403
- HaasBW.SheauK.KelleyRG.ThompsonPM.ReissAL.Regionally specific increased volume of the amygdala in Williams syndrome: evidence from surface-based modeling.Hum Brain Mapp. In press.
- PengD.KelleyR.QuintinE-M.RamanM.ThompsonP.ReissAL.Cognitive and behavioral correlates of caudate subregion shape variation in Fragile X syndrome.Hum Brain Mapp. In press.
- HoeftF.Barnea-GoralyN.HaasBW.et alMore is not always better: increased fractional anisotropy of superior longitudinal fasciculus associated with poor visuospatial abilities in Williams syndrome.J Neurosci.200727119601196517978036
- ArlinghausLR.Thornton-WellsTA.DykensEM.AndersonAW.Alterations in diffusion properties of white matter in Williams syndrome.Magn Res Imaging.20112911651174
- CataniM.de SchottenMT.Atlas of Human Brain Connections. Oxford, UK: Oxford University Press;2012
- JabbiM.KippenhanJS.KohnP.et alThe Williams syndrome chromosome 7q11.23 hemideletion confers hypersocial, anxious personality coupled with altered insula structure and function.Proc Natl Acad Sci U S A.2012E860E86622411788
- HaasBW.HoeftF.Barnea-GoralyN.GolaraiG.BellugiU.ReissAL.Preliminary evidence of abnormal white matter related to the fusiform gyrus in Williams syndrome: a diffusion tensor imaging tractography study.Genes Brain Behav.201211626821939500
- NadelL.Down syndrome in cognitive neuroscience perspective. In: Tager-Flusberg, H, ed.Neurodevelopmental Disorders. Boston, MA: The MIT Press;1999
- StantonLR.CoetzeeRH.Down's syndrome and dementia.Advances Psych Treatment.2004105058
- PinterJD.BrownWE.EliezS.SchmittJE.CaponeGT.ReissAL.Amygdala and hippocampal volumes in children with Down syndrome: a high- resolution MRI study.Neurology.20015697297411294940
- Smigielska-KuziaJ.Bo kowskiL.SobaniecW.et alA volumetric magnetic resonance imaging study of brain structures in children with Down syndrome.Neurology.201145363369
- LippeB.Turner syndrome.Endocrin Metab Clin.199120121152
- MurphyDGM.DeCarliC.DalyE.et alX-chromosome effects on female brain: a magnetic resonance imaging study of Turner's syndrome.Lancet.1993342119712007901528
- ReissAL.MazzoccoMMM.GreenlawR.FreundLS.RossJL.Neurodevelopmental effects of X monosomy: a volumetric imaging study.Ann Neurol.1995387317387486864
- BrownWE.KeslerSR.EliezS.et alBrain development in Turner syndrome: a magnetic resonance imaging study.Psychiat Res: Neuroim.2002116187196
- KeslerSR.GarrettA.BenderB.YankowitzJ.ZengSM.ReissAL.Amygdala and hippocampal volumes in Turner syndrome: a high-resolution MRI study of X-monosomy.Neuropsychologic.20044219711978
- MolkoN.CachiaA.RiviereD.et alBrain anatomy in Turner syndrome: evidence for impaired social and spatial-numerical networks.Cereb Cortex.20041484085015054057
- HolzapfelM.Barnea-GoralyN.EckertMA.KeslerSR.ReissAL.Selective alterations of white matter associated with visuospatial and sensorimotor dysfunction in Turner syndrome.J Neurosci.2006267007701316807330
- YamagataB.Barnea-GoralyN.MarzelliMJ.et alWhite matter aberrations in prepubertal estrogen-naive girls with monosomic Turner syndrome.Cereb Cortex.2012222761276822172580
- BrayS.DunkinB.HongDS.ReissAL.Reduced functional connectivity during working memory in Turner syndrome.Cereb Cortex.2011212471248121441396
- BrayS.HoeftF.HongDS.ReissAL.Aberrant functional network recruitment of posterior parietal cortex in turner syndrome.Hum Brain Mapp. In press.