
Abstract
Major depressive disorder (MDD) is a pleomorphic illness originating from gene x environment interactions. Patients with differing symptom phenotypes receive the same diagnosis and similar treatment recommendations without regard to genomics, brain structure or function, or other physiologic or psychosocial factors. Using this present approach, only one third of patients enter remission with the first medication prescribed, and patients may take longer than 1 year to enter remission with repeated trials. Research to improve treatment effectiveness recently has focused on identification of intermediate phenotypes (IPs) that could parse the heterogeneous population of patients with MDD into subgroups with more homogeneous responses to treatment. Such IPs could be used to develop biomarkers that could be applied clinically to match patients with the treatment that would be most likely to lead to remission. Putative biomarkers include genetic polymorphisms, RNA and protein expression (transcriptome and proteome), neurotransmitter levels (metabolome), additional measures of signaling cascades, oscillatory synchrony, neuronal circuits and neural pathways (connectome), along with other possible physiologic measures. All of these measures represent components of a continuum that extends from proximity to the genome to proximity to the clinical phenotype of depression, and there are many levels along this continuum at which useful IPs may be defined. Because of the highly integrative nature of brain systems and the complex neurobiology of depression, the most useful biomarkers are likely to be those with intermediate proximity both to the genome and the clinical phenotype of MDD. Translation of findings across the spectrum from genotype to phenotype promises to better characterize the complex disruptions in signaling and neuroplasticity that accompany MDD, and ultimately to lead to greater understanding of the causes of depressive illness.
El trastorno depresivo mayor (TDM) es una enfermedad de variadas formas que surge a partir de las interacciones entre genes y ambiente (GxA). Los pacientes con fenotipos de diferentes síntomas reciben el mismo diagnóstico y similares recomendaciones terapéuticas sin tener en consideración la genómica, la estructura o función cerebral, u otros factores fisiológicos o psicosociales. De acuerdo con esta aproximación solo un tercio de los pacientes alcanza la remisión con la primera medicación prescrita, y los pacientes pueden tardar más de un año en alcanzar la remisión con diversos ensayos. Recientemente la investigación para mejorar la eficacia terapéutica se ha enfocado en la identificación de fenotipos intermedios (FIs) que podrían ser útiles para analizar la heterogénea población de pacientes con TDM en subgrupos con respuestas más homogéneas al tratamiento. Estos FIs podrían emplearse para desarrollar biomarcadores con aplicación en la clínica para indicar el tratamiento que tenga más probabilidades de alcanzar la remisión. Estos llamados marcadores incluyen polimorfismos genéticos, expresión de ARN y proteínas (transcriptoma y proteoma), niveles de neurotransmisores (metaboloma), mediciones adicionales de cascadas de señales, sincronía oscilatoria, circuitos neuronales y vías neurales (conectoma) junto con otras posibles mediciones fisiológicas. Todas estas mediciones representan componentes de un continuo que va desde la proximidad al genoma hasta la proximidad al fenotipo clínico de la depresión y hay muchos niveles a lo largo de este continuo en los cuales se pueden definir FIs útiles. Dada la naturaleza altamente integradora de los sistemas cerebrales y la compleja neurobiología de la depresión, los biomarcadores mas útiles son probablemente aquellos que tienen una proximidad intermedia tanto con el genoma como con el fenotipo clínico del TDM. La traslación de los hallazgos a través del espectro desde el genotipo al fenotipo promete caracterizar mejor las complejas disrupciones en las señales y en la neuroplasticidad que acompañan al TDM y finalmente conducir a una mayor comprensión de las causas de la enfermedad depresiva.
Le Trouble Dépressif Majeur (TDM) est une maladie pléomorphe dues à des interactions entre les gènes et l'environnement (G x E). Les patients ayant des symptômes phénotypiques différents sont diagnostiqués et traités de la même façon, sans tenir compte de la génomique, de la fonction ou de la structure cérébrales ou d'autres facteurs physiologiques ou psychosociaux. Suivant cette stratégie, seulement un tiers des patients entrent en rémission avec le premier médicament prescrit et, après des traitements multiples, cette rémission met plus d'1 an à survenir. Afin d'améliorer l'efficacité thérapeutique, les chercheurs se sont récemment intéressés à l'identification des phénotypes intermédiaires (PI) permettant d'analyser la population hétérogène des patients atteints de TDM en sous-groupes plus homogènes en termes de réponse au traitement. De tels PI pourraient être utilisés dans le développement de biomarqueurs afin d'apparier les patients au traitement le plus à même d'induire une rémission. Les polymorphismes génétiques, l'expression des protéines et de l'ARN (transcriptome et protéome), les taux de neurotransmetteurs (métabolome), les mesures supplémentaires des cascades de signalisation, la synchronie oscillatoire, les circuits neuronaux et les voies neurales (connectome) font partie des biomarqueurs potentiels tout comme d'autres mesures physiologiques potentielles. Ces mesures appartiennent à un continuum qui s'étend du génome au phénotype clinique du TDM et des PI utiles peuvent être identifiés à de nombreux niveaux tout au long de ce continuum. En raison de la nature hautement interactive des systèmes cérébraux et en raison de la neurobiologie complexe de la dépression, les biomarqueurs les plus utiles sont probablement ceux dont la position est intermédiaire entre le génome et le phénotype clinique du TDM. L'application de découvertes allant du génotype au phénotype permettra de mieux caractériser les anomalies complexes de la signalisation et de la neuroplasticité observées dans le TDM et de mieux comprendre les causes de la dépression.
Introduction
Major depressive disorder (MDD) is a pleomorphic illness that arises from gene x environment (GxE) interactions, with numerous neurobiological and psychosocial factors interacting to produce symptoms in the population of those suffering from this illness. Patients may have similar symptoms that are precipitated by different combinations of genetic vulnerabilities and environmental stresses; conversely, patients also may exhibit non-overlapping clusters of symptoms with a shared neurobiological substrate. The challenge for the field is that patients with differing phenotypes currently receive the same clinical diagnosis and treatment recommendation without regard to genomics, brain structure or function, or other physiologic or psychological factors.Citation1
Using this approach to treatment, only one third of patients with MDD recover from the illness after treatment with an initial antidepressant medication.Citation2 While some cases of MDD are resistant to existing treatments, the largest clinical problem is the flaw in the current paradigm for treatment selection. When the first treatment does not get the patient well, there is little scientific basis for choosing the next; not surprisingly, it may take 1 year or longer for patients to recover from a depressive episode. Progress in improving antidepressant treatment outcome has been challenging because of the large heterogeneity of MDD, limited neurobiologic methods to characterize this variability, lack of clarity on the mechanism of action (MOA) of antidepressant treatments, and ultimately, the lack of methods to match patients with the treatments most likely to lead to remission.Citation3 Research has aimed to establish biomarkers that could be used to characterize the neurobiologic basis for depression in any one individual and guide selection of the treatment that is most likely to lead to remission with a minimum of side effects. A number of putative biomarkers have been proposed, examined, and reviewed systematically elsewhere.Citation1,Citation4 Evidence for the usefulness of these biomarkers varies considerably, along with their varied intended applications: these include confirming the diagnosis of MDD; identifying subgroups of patients with similar prognoses; predicting the most effective therapeutic intervention prior to the initiation of treatment; and, predicting the likely effectiveness of an intervention early in the course of treatment. This review proposes a framework that can be used to guide biomarker development, and consider the usefulness and applications of biomarkers in the management of MDD.
The use of intermediate phenotypes
Research to improve treatment effectiveness recently has focused on identification of novel intermediate phenotypes (IPs) of response or remission with treatment.Citation5 Like endophenotypes, IPs are quantifiable physiological traits or processes that are interposed between gene and clinical phenotype, but they do not necessarily fulfill all the criteria that define endophenotypes. For example, IPs need not explicitly be state-independent or demonstrate a stronger association with the illness of interest than with other psychiatric conditions. IPs can be used to parse the heterogeneous population of patients with MDD into more homogeneous subgroups; measurements of the characteristics of the subgroups can serve as the basis for a biomarker for diagnosis or treatment response.Citation6 The National Institute of Mental Health (NIMH) initiative on Research Domain Criteria (RDoC) is an attempt to identify IPs that may be useful for better achieving diagnostic homogeneity and directing treatment selection.Citation7 In the absence of a mechanism-based hypothesis for MDD, RDoC conceptualizes the illness as a disorder of brain circuits and reifies a framework in which cognitive and motivational domains (such as fear/extinction, reward, and executive function) are examined through circuitry-behavior relationships. RDoC classifications assume that the dysfunctions in these domains map to neural circuits, and that these circuits will yield “biosignatures” that will include fundamental neurophysiologic, neurochemical, and genetic elements of disease.Citation8 In this schema, cognitive and motivational domains exist on a continuum of candidate IPs that is anchored at one end by the phenotypic clinical symptoms of MDD and at the other by genetic risk factors for depression (). The RDoC domains systematize the pleomorphic nature of the depressive phenotype with anchors closer to the clinical phenotypic end of the continuum. An IP developed for one illness, however, may not be specific for a single clinical condition. RDoC domains eschew the traditional DSM diagnostic categories, such as MDD and Bipolar Disorder, in favor of elements that span the boundaries of individual clinical syndromes. While the research reviewed here pertains primarily to the traditional syndrome of MDD, the concepts presented may be relevant to Bipolar Disorder, other mood or anxiety disorders, or other neuropsychiatric illnesses.
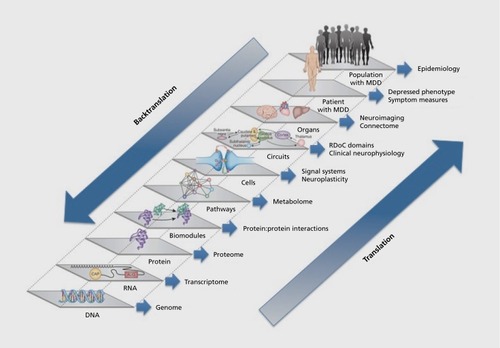
RDoC is a useful alternative to IPs that deal with heterogeneity through categorization of differences in aminergic or glutamatergic signaling, which have largely failed to explain either differences in symptomatology or responses to treatment.Citation9-Citation11 IPs rooted in neurotransmitter theories of depression remain persistently attractive, however, because they appear to constitute a translational pathway linking clinical symptoms, medication MOA, and genetic risk for depression: neurotransmitter depletion studies indicate associations between neurotransmitter levels and clinical symptoms; antidepressant treatment affects extracellular levels of these neurotransmitters; biochemical pathways of transmitter synthesis and metabolism are well defined; and, a number of genetic polymorphisms associated with rates of synthesis and metabolism of neurotransmitters have been identified. Such polymorphisms would constitute biomarkers that would be stable over time and easily ascertained. While genetic biomarkers are believed to yield greater specificity in personalization of treatment, and are assumed to be readily translatable to levels closer to clinical phenotype (Figure 1), at present the predictive validity of most if not all genetic markers for MDD remains relatively low.
The spectrum from genome to clinical phenotype
The lack of success in moving along the pathway from the genome to the clinical phenotype of depression reflects two complicating factors inherent to the study of neuropsychiatric illness. First, there are strong and heterogeneous environmental influences that mediate development of illness and vary considerably across individuals. Despite convincing evidence for a genetic contribution to MDD, adoptive twin studies show a heritability of only 37% for the disorder,Citation12 and genomewide association studies have failed to identify loci that exceed genome -wide significance levels.Citation13 Polymorphisms regulating neurotransmitter synthesis and metabolism have been examined in a number of studies and have been shown to have small and inconsistent effects on treatment response.Citation2 The best evidence suggests that genetic vulnerability conferred by multiple loci of small effect interact with stressful past and/or current environmental influences to precipitate depressive illness, with the severity and frequency of episodes dependent both on the degree of the genetic vulnerability and the severity and persistence of stressors.Citation14-Citation16
Second, the multifunctional purpose of neural networks, along with the integrative function of the brain in synthesizing multiple internal and external sources of information, mitigate against specificity in translating biomarkers from genotype to phenotype. In moving along the continuum from the most basic level (genetic polymorphism) to the most complex (clinical phenotype), the effects of an increasing number of genetic, epigenetic, environmental, and other disease-modifying influences are brought to bear upon the sensitivity and specificity of a putative biomarker for its intended use (Figure 1). The complexity of this translation is demonstrated by the field of imaging genetics, which aims to map brain structural and functional characteristics to genotype and has successfully constructed IPs that link genetic variation to observable brain states. For example, common polymorphisms in catechol-O-methyltransferase (eg, COMT Val66Met), serotonin transporter length (eg, 5-HTTLPR/SLC6A4), and monoamine oxidase A variable number of tandem repeats (eg, MAOA VNTR) have been linked to individual differences in emotional processing (such as differences in working memory or trait anxiety) and patterns of brain regional activation during tasks (such as in dorsolateral prefrontal cortex, DLPFC).Citation5 These results are encouraging for biomarker development, indicating that it is possible to move from discrete categorical biomarkers (polymorphisms) to continuous measures of brain activation, essentially translating across multiple levels of the continuum from gene to brain state. Neuroimaging findings associated with specific genotypes are yielding IPs that provide a better understanding of links between genes that contribute to brain abnormalities and the risk for MDD.Citation14,Citation17 At the same time, these findings are nonspecific: dysfunction in any one region such as DLPFC mediates the risk not only for MDD, but also schizophrenia and other major mental disorders.Citation5 Imaging genetics demonstrate the unique challenges created by the network nature of the brain: each polymorphism has pleiotropic effects on function in multiple brain regions; the effects of a polymorphism in each region are dependent upon the epistatic effects of other polymorphisms; and, each region interacts with other regions through multiple brain circuits, yielding increased risk for multiple clinical phenotypes of illness.
Even when a genetic mutation can be identified as a clear biomarker for disease risk, the overarching complexity of brain systems may block attempts to build therapeutic interventions based upon the biomarker. An instructive case in point is Huntington's disease (HD), one of the rare illnesses of the central nervous system that has been linked to an autosomal dominant mutation in a single gene identified more than 20 years ago.Citation18 Because HD is a monogenic disease with complete penetrance, and with a direct correlation between the size of the trinucleotide (CAG) repeat expansion and age of onset, genotyping yields essentially 100% accuracy in diagnosis along with an estimated age of onset. With the elucidation of the nature of the genetic defect (expansion of a CAG trinucleotide repeat) and the gene product (mutant Huntingtin protein, or mlltt), many researchers believed that effective treatment would not be far off. However, despite the scientific advantages of a clear therapeutic target, and the fact that lowering mlltt expression in adult mice ameliorates pathology, effective treatment in humans has remained elusive.Citation19 A number of complications have frustrated attempts to develop therapeutics based upon the biomarker of genetic cause, including how to suppress expression or block the toxicity of mlltt without suppressing or blocking the normal wild-type protein, which plays vital roles in synaptic transmission and axonal transport, among other cellular processes. Identification of therapeutic targets further removed from the level of the genome has been challenging because mlltt toxicity is remarkably pleiotropic.Citation20 It disrupts cellular processes as diverse as energetics (ie, mitochondrial morphologic changes), transcriptional regulation (ie, changes in expression of trophic factors such as brainderived neurotrophic factor [BDNF] and targets such as the N-methyl-D-aspartate receptor [NMDAR]), synaptic transmission (ie, disturbed vesicular trafficking), and synaptic plasticity.Citation19,Citation21
Optimal strategies for identification of IPs of treatment outcome
The ultimate goal for the identification of IPs of treatment outcome in MDD would be the development of biomarkers that, prior to treatment, could identify groups of patients that share a common neurobiological substrate and are likely to achieve remission with a particular treatment. This has been possible for a limited number of illnesses in which the molecular biology is well understood (eg, HER2-positive breast cancer). This is not likely to be the case with neuropsychiatric illnesses, in which multiple phenotypes may result from either loss or gain in function of the same gene, transcriptional product, and associated changes in function of brain networks.Citation22 Neuronal networks must constantly respond with adaptive plasticity to changes that reflect developmental stage, environmental stress, and functional demands. While this plasticity is likely to be reflected in a variety of molecular, as well as brain functional and structural processes, these putative biomarkers are nonspecific, and the current limits in our understanding of the pathogenesis of MDD preclude identification of greater specificity in the pretreatment substrate. Indeed, pretreatment biomarkers derived from neuroimaging, gene expression, proteomic, metabolomic, and other techniques all have been explored as means to characterize IPs in MDD; while each of these technologies has experimental advantages and disadvantages, all are subject to the same constraints and lack of specificity in providing useful IP biomarkers of clinical outcome prior to treatment.
Not all candidate IPs are “created equal” in terms of their potential to serve as the basis for clinically useful biomarkers.Citation23 We propose that the likelihood that a particular IP will yield a biomarker that has strong power to predict outcome for MDD has less to do with the experimental technique involved than with three general guiding principles for biomarker development, detailed below.
Measurement of dynamic rather than static IPs
Our current limited understanding of the pathophysiology of depression, along with the complex nature of GxE interactions, suggests that the most useful biomarkers to predict treatment outcome are likely to be state-dependent, and in particular those that reflect a change in brain state upon exposure to a treatment intervention. The MOA of antidepressant medications, repetitive transcranial magnetic stimulation (rTMS), and deep brain stimulation (DBS) are hypothesized to reset brain networks and increase neuroplasticity.Citation3,Citation24-Citation28 The fundamental mechanisms through which neuroplasticity can be induced are not well understood.Citation29 This lack of knowledge, combined with the variable state and trait factors that may contribute to treatment effects in any one individual,Citation30-Citation32 make it highly unlikely at the present time to predict from a single, pretreatment trait-dependent biomarker how plasticity will be induced by any antidepressant treatment. Those IPs that are derived not from a static, pretreatment measure, but instead from a dynamic measurement that changes over time are much more likely to capture information about how the brain will respond to a treatment intervention.Citation33 Dynamic IPs that are derived from the early responses of the brain to a treatment intervention will inherently better predict whether neuroplasticity is likely to be induced by that intervention. Such treatment-emergent changes in trophic factors, gene expression, functional connectivity, or brain oscillatory synchrony have been termed “response endophenotypes.”Citation34 Such measures appear to have greater predictive power for therapeutic benefit than do pretreatment measures alone, and have predictive power that is additive to early treatment-emergent mood changes.Citation1,Citation35
Intermediate timing of dynamic IP measurements in the treatment process
In measuring dynamic changes in the brain to predict treatment outcome, it is important to avoid tautology: biomarker measurements made late in treatment may be more strongly correlated with response, but as they get closer to the treatment end point, they no longer are useful as predictors. Dynamic biomarker measurements made within 10 days of treatment initiation generally will be sufficiently early to be considered clinically useful as predictors of treatment response for most current treatments. The time at which biomarkers may be considered useful depends in part on the clinical end point with which they are associated. For example, a biomarker for medication treatment response might have to be measureable within the first week of treatment to be useful because many patients will show clinical response within 4 to 6 weeks of treatment initiation; a biomarker for remission, however, might still be useful if it were measureable several weeks later, because remission may take 12 to 14 weeks to achieve. By contrast, a biomarker for adverse effects would be desirable as early as possible after treatment initiation, whereas one for symptom relapse might be useful if it could be obtained at any time in the course of treatment, so long as it precedes relapse by days to weeks (a sufficient length of time to initiate a prophylactic treatment intervention).
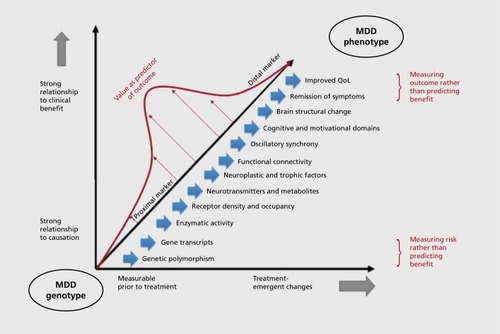
Intermediate location of the IP on the translational spectrum
The biomarkers that are most likely to prove useful for predicting treatment response are those with intermediate proximity to both clinical symptom improvement and genetic risk for MDD (). The more proximal the biomarker to the actual measureable improvement, the stronger its association with outcome and the greater is its sensitivity and specificity for the prediction of improvement. However, biomarkers that are highlyproximal to positive outcome become tautological—they measure symptom improvement or enhanced quality of life rather than being predictive of it. Transcriptional or neurochemical biomarkers that are proximal to the genome and are far removed from actual measurement of improvement are much less likely to be redundant with measurement of improvement. However, epistatis, pleiotropy, and intervening environmental influences along the spectrum from genome to clinical phenotype introduce considerable unpredictable variability into the association between the biomarker and eventual clinical outcome. Depression is a pleomorphic condition in which multiple streams of information—both biological traits and environmental states—converge to shape the neurobiology and symptomatic manifestations of the illness in any one individual. It is possible that further research on IPs will identify multiple “pathways” from genotype to phenotype that will map to more homogeneous subgroups of illness. Given the current limits to our understanding of the mechanism, however, the inherent heterogeneity along these pathways makes it significantly less likely that biomarkers of close proximity to the genome will be both sensitive and specific predictors of treatment outcome. These caveats apply to markers in the genome itself, including polymorphisms in both coding and noncoding elements. Although perhaps more specific to each patient, they are nonetheless subject to the same GxE and epistatic interactions that currently cloud our interpretation of transcriptional and neurochemical markers.
The development of IPs based on oscillatory synchrony
The relevance of these principles to biomarker development is demonstrated in the study of change in oscillatory synchrony, which has shown particular promise as an IP for treatment outcome in MDD.Citation36,Citation37 Oscillatory synchrony is defined as the energy contained in rhythmic oscillations, primarily in the delta (0.5-4 Hz), theta (4-8 Hz), and alpha (8-12 Hz) frequency bands (Leuchter et al, unpublished data, article under review),Citation34 as measured with quantitative electroencephalography (cjEEG). Regulation of oscillatory activity in subjects with MDD constitutes a promising IP because it is highly heritable,Citation38 and individual differences in theta and alpha activity have been linked to heritable differences in emotional processing and the risk for depressive illness.Citation36 In addition, a series of studies of subjects with MDD undergoing antidepressant treatment have examined changes in synchrony using qEEG power or cordance (a measure derived from power normalized across frequency bands and electrode sites). These studies have consistently shown that changes in theta and alpha powerCitation35,Citation39,Citation40 or cordance with a range of antidepressant medications,Citation41-Citation47 rTMS,Citation48-Citation50 or DBSCitation51 are strongly predictive of clinical response or remission with active treatment. Regional changes in brain oscillatory synchrony appear to be relatively specific for response to medication and not placebo,Citation31,Citation52 and to distinguish between the effects of medication and placebo on brain function in healthy control subjects.Citation53
Changes in oscillatory synchrony could represent an IP for treatment response in MDD on the basis of the thalamocortical dysrhythmia (TCD) hypothesis of MDD.Citation54-Citation58 TCD encompasses a family of illnesses including MDD, obsessive-compulsive disorder (OCD), Parkinson's disease (PD), absence seizures, tinnitus, and central pain syndromes, which are characterized by persistent, highly resonant oscillatory activity in thalamocortical loops primarily within the high delta (2.5-4 Hz) and theta (4-8 Hz) frequency band (Leuchter et al, unpublished data, article under review).Citation54,Citation56,Citation58 TCD stems from a state of persistent hyperpolarization in thalamic nuclei, which may arise in some patients with MDD because of aberrant serotonergic input to the thalamus.Citation60-Citation62 This hyperpolarization inhibits T-type calcium channels, which slows the firing rate of thalamic pacemaker cells and produces excess of slow-wave activity in thalamocortical oscillatory “loops.” Citation56-Citation58,Citation62-Citation64 Remission during antidepressant treatment has been hypothesized to resolve TCD by shifting the firing of thalamic pacemaker cells from tonic to phasic mode, thus resetting thalamocortical oscillators and shifting oscillations relatively more towards the alpha band. This has been hypothesized as an MOA of rTMS for MDD and tinnitus,Citation26,Citation65,Citation66 of DBS for OCD, MDD, and PD,Citation54,Citation67 as well as for some antidepressant, anticonvulsant, and pain medications (Leuchter et al, unpublished data, article under review).Citation57,Citation64,Citation68-Citation70
Optimizing methods for measurement of oscillatory synchrony
There has been variability in reports of shifts in oscillatory synchrony with effective treatment: some investigators have reported no change in power measures after 12 weeks of treatment in responders to fluoxetine,Citation71 while others have reported changes in alpha and theta band power within hours after a single dose,Citation72 and still others have reported changes that are seen within the first 2 weeks of treatment but dissipate at later time points.Citation73,Citation74 Despite the prominent effects of rTMS on oscillatory synchrony, one group of investigators has reported that changes in cerebral oscillations are not associated with response to rTMS.Citation75 In evaluating these results, it is important to bear in mind that oscillatory synchrony is a dynamic biomarker; as with other nonstationary signals, there is a critical need to standardize the parameters for signal acquisition to ensure that results are reliable and comparable across studies.
Standard qEEG systems that have the capacity to measure oscillatory synchrony already are available in clinical and research laboratories, and new-generation systems (such as dry electrode qEEG headsets) promise to make this biomarker even more widely available. At least three different aspects of measurement parameters must be appropriately optimized, however, in order to obtain reliable biomarker measurements of oscillatory synchrony. First, qEEG signals must be acquired in the time window in which the dynamic changes that are predictive of clinical outcome occur. For medication treatment, this window exists from a few hours to 2 to 3 weeks after the start of treatment and specific time points within this window may depend on the outcome of interest. In the prediction of adverse effects, for example, a large transient decrease in regional theta cordance occurring 48 hours after initial dosing has been associated with antidepressant treatment-emergent worsening of suicidal ideationCitation76 and with treatment-emergent symptom volatilityCitation77 over the course of acute treatment. Whereas this biomarker of adverse events is no longer evident one week after start of drug, the 1-week time frame is reported as an optimal time point for detection of qEEG measurements associated with positive clinical outcome.Citation42 Beyond several weeks, brain function appears to adapt to the effects of medication and changes may no longer be predictive.Citation78
Second, recording electrodes should be placed over specific brain regions for optimal detection of the biomarker of interest. There is considerable variability across brain regions in the dominant oscillatory rhythms produced that reflect variations in local tissue geometry, differences in the laminar structure of the cerebral cortex, as well as which thalamic nucleus is modulating the local corticothalamic module.Citation79,Citation80 Location of recording electrodes appears to be particularly important for the measurement of changes in oscillatory synchrony that are predictive of outcome in MDD. While pretreatment differences can be detected in the alpha band in posterior electrode locations,Citation71 the frontopolar midline electrode location (Fpz) provides unique information that cannot be detected at other recording sites,Citation81,Citation82 and appears to be particularly important for the detection of treatment-emergent changes in oscillatory synchrony.Citation35,Citation39,Citation42 Electrodes placed in this region are well positioned to detect signals from the corticothalamic circuits modulated by the dorsomedial nucleus of the thalamus, which selectively innervates prefrontal cortex,Citation83 has rich interconnections throughout the limbic system,Citation84 and shows abnormal functional (of rTMS, for example)Citation85 and structural connectivity in MDD.Citation86 The limited referential electrode montages used in some studiesCitation75 are likely not to detect biomarkers associated with treatment outcome and may produce false-negative results.Citation87 qEEG electrode montages that do not record from the frontopolar region may not be sufficiently sensitive for the characterization of treatmentemergent changes in oscillatory synchrony, particularly with the goal of predicting treatment outcome.
Third, qEEG measurements must examine the frequency band in which the specific treatment employed is most likely to elicit changes in oscillatory synchrony. In the treatment of MDD, the TCD hypothesis suggests that shifts in frequency between high delta-theta (2.5-8 Hz) and alpha (8-12 Hz) frequency bands are most likely to show changes associated with treatment response (Leuchter et al, unpublished data, article under review).Citation54,Citation64 For pharmacologic treatments, however, the frequency band of interest may vary depending upon which neurotransmitter system is affected by the agent being used. Medications that increase serotonergic tone through serotonin reuptake blockade modulate synchronous oscillations in the 2.5-12 Hz frequency range and, if they are effective in resolving TCD, would be expected to shift synchronous oscillations towards the higher frequency (8-12 Hz) range (Leuchter et al, unpublished data, article under review). Effects of other medications are likely to differ from selective serotonin reuptake inhibitors (SSRIs), as well as from one another: those that concomitantly affect dopaminergic tone also may cause shifts from beta (12-20 Hz) towards gamma (20-40 Hz) activityCitation88; those affecting primarily glutamatergic circuits through blockade of metabotropic glutamate receptors (mGluR5) may cause shifts from the theta to delta (0-4 Hz) bandCitation89; and NMDAR antagonists may increase power in the gamma frequency.Citation90 Even antidepressant medications such as SSRIs that ostensibly have specific reuptake blockade properties affect a broad range of neurotransmitter systems through pre- and post-synaptic blockade and modulation of different ligand-gated ion channels.Citation91 These findings highlight the need to verify that the frequency band(s) under study are appropriately “tuned” as putative biomarkers to detect the outcome of interest.
IPs based upon oscillatory synchrony may prove useful in other neuropsychiatric diseases as well. Shifts in oscillatory synchrony have been observed in individuals with mild-to-severe FID, as well as in gene-positive premanifest individuals.Citation92 mlltt interacts with calcium binding proteins, voltage-gated calcium channels, and NMDAR, causing calcium dyshomeostasisCitation21,Citation93 and possibly inducing excessive low-frequency resonance in thalamocortical loops. Disturbances in oscillatory synchrony in gene-positive individuals have moderately strong associations with the length of CAG repeats in the gene coding for mHtt,Citation92 suggesting a relationship between oscillatory synchrony and the severity of the genetic defect. Disturbances in oscillatory synchrony similar to those seen in humans harboring a CAG expansion have been demonstrated in animal models of HD,Citation94,Citation95 indicating the translational potential of these neurophysiology measures.
Conclusions
The IP approach to studying treatment outcome in MDD is likely to yield a number of biomarkers that will need to be examined for their clinical usefulness with standard statistical methods including sensitivity, specificity, and receiver operating characteristic (ROC) analyses. The ideal biomarkers for outcome would predict remission with high sensitivity and specificity. Application of biomarkers to clinical care in a prescriptive manner is not totally without risk: a false-negative biomarker result could erroneously direct a patient away from a treatment with which he or she might otherwise have remitted. These risks of prematurely abandoning treatment with a potentially efficacious treatment, however, are inherent to physician decision making with or without the use of a biomarker. Furthermore, the frequency with which remission occurs with a single antidepressant medication is so low (approximately 30%) that application of biomarkers of even moderate accuracy could have a favorable risk:benefit ratio and would lead to improved treatment outcomes. In addition to enhancing patient care by predicting remission, use of biomarkers in clinical practice offers the potential advantage of increasing patient treatment adherence. Premature discontinuation of antidepressant treatment is a major problem: 26% of those who fail to improve with the first treatment simply stop taking medication, frequently within the first 2 weeks,Citation96 and up to 42% of patients discontinue medication within the first 30 days.Citation1,Citation97 Biomarkers could be powerful tools for patient education and engagement, demonstrating to individual patients that antidepressant treatment is having positive effects on their brain function and encouraging them to be adherent to treatment.
The IP approach constitutes a framework for identifying subgroups of patients with MDD with similar physiologic characteristics, and who are likely to have similar responses to treatment. This approach supports the development of biomarkers that may utilize neuroimaging, receptor binding, gene and protein expression, endocrine, and neurophysiologic findings across a continuum that extends from proximity to the genome to proximity to the clinical syndrome of depression. There are several intermediate levels along this continuum at which useful IPs may be defined, and the most predictive IP for remission may incorporate biomarkers from several different “omics” domains.Citation98 Translation of findings across the spectrum from genotype to phenotype promises to better characterize the complex disruptions in the biological transfer of information and neuroplasticity that accompany MDD, and ultimately to lead to greater understanding of the causes of depressive illness.
The authors wish to thank William Kaemmerer, PhD of Medtronics, Inc, and Robert Pacifici, PhD and Robert Rogers, PhD, MBA, of CHDI Foundation, for their helpful input and assistance in developing the concepts of this manuscript. We also are grateful to Ms Nikita VinceCruz for her expert assistance in preparation of the manuscript, as well as Ms Jennifer Villalobos for her help in preparation of the figures.
REFERENCES
- LeuchterAF.CookIA.HamiltonSP.et alBiomarkers to predict antidepressant response.Curr Psychiatry Rep.20101255356220963521
- KrishnanV.NestlerEJ.Linking molecules to mood: new insight into the biology of depression.Am J Psychiatry.20101671305132020843874
- TantiA.BelzungC.Open questions in current models of antidepressant action.Br J Pharmacol.20101591187120020132212
- NiciuMJ.MathewsDC.NugentAC.et alDeveloping biomarkers in mood disorders research through the use of rapid-acting antidepressants.Depress Anxiety.20143129730724353110
- Meyer-LindenbergA.WeinbergerDR.Intermediate phenotypes and genetic mechanisms of psychiatric disorders.Nat Rev Neurosci.2006781882716988657
- FornitoA.BullmoreET.Connectomic intermediate phenotypes for psychiatric disorders.Front Psychiatry.201233222529823
- InselTR.The NIMH Research Domain Criteria (RDoC) project: precision medicine for psychiatry.Am J Psychiatry.201417139539724687194
- InselT.CuthbertB.GarveyM.et alResearch domain criteria (RDoC): toward a new classification framework for research on mental disorders.Am J Psychiatry.201016774875120595427
- ShynSI.HamiltonSP.The genetics of major depression: moving beyond the monoamine hypothesis.Psychiatr Clin North Am.20103312514020159343
- SanacoraG.TreccaniG.PopoliM.Towards a glutamate hypothesis of depression an emerging frontier of neuropsychopharmacology for mood disorders.Neuropharmacology.201262637721827775
- SharpT.Molecular and cellular mechanisms of antidepressant action.Curr Top Behav Neurosci.20131430932522865463
- SullivanPF.NealeMC.KendlerKS.Genetic epidemiology of major depression: reviewand metaanalysis.Am J Psychiatry.20001571552156211007705
- RipkeS.WrayNR.LewisCM.et alA mega-analysis of genomewide association studies for major depressive disorder.Mol Psychiatry.20131849751122472876
- FlintJ.KendlerKS.The genetics of major depression.Neuron.20148148450324507187
- KendlerKS.KuhnJ.PrescottCA.The interrelationship of neuroticism, sex, and stressful life events in the prediction of episodes of major depression.Am J Psychiatry.200416163163615056508
- SilbergJ.RutterM.NealeM.EavesL.Genetic moderation of environmental risk for depression and anxiety in adolescent girls.Br J Psychiatry.200117911612111483472
- RietschelM.MattheisenM.FrankJ.et alGenome-wide association-, replication-, and neuroimaging study implicates HOMER1 in the etiology of major depression.Biol Psychiatry.20106857858520673876
- WalkerFO.Huntington's disease.Lancet.200736921822817240289
- Munoz-SanjuanI.BatesGP.The importance of integrating basic and clinical research toward the development of new therapies for Huntington disease.J Clin Invest.201112147648321285520
- CisbaniG.CicchettiF.An in vitro perspective on the molecular mechanisms underlying mutant huntingtin protein toxicity.Cell Death Dis.20123e38222932724
- TrippierPC.Jansen LabbyK.HawkerDD.MatakaJJ.SilvermanRB.Target- and mechanism-based therapeutics for neurodegenerative diseases: strength in numbers.J Med Chem.2013563121314723458846
- RamockiMB.ZoghbiHY.Failure of neuronal homeostasis results in common neuropsychiatric phenotypes.Nature.200845591291818923513
- Meyer-LindenbergA.Intermediate or brainless phenotypes for psychiatric research?Psychol Med.2010401057106220540175
- VillanuevaR.Neurobiology of major depressive disorder.Neural Plast.2013201387327824222865
- DumanRS.Pathophysiology of depression and innovative treatments: remodeling glutamatergic synaptic connections.Dialogues Clin Neurosci.201416112724733968
- LeuchterAF.CookIA.JinY.PhillipsB.The relationship between brain oscillatory activity and therapeutic effectiveness of transcranial magnetic stimulation in the treatment of major depressive disorder.Front Hum Neurosci.20137 37
- PriceJL.DrevetsWC.Neurocircuitry of mood disorders.Neuropsychopharmacology.20103519235216
- LujanJL.ChaturvediA.MclntyreCC.Tracking the mechanisms of deep brain stimulation for neuropsychiatric disorders.Front Biosci.2008135892590418508630
- DayerA.Serotonin-related pathways and developmental plasticity: relevance for psychiatric disorders.Dialogues Clin Neurosci.201416294124733969
- HunterAM.LeuchterAF.MorganML.et alNeurophysiologic correlates of side effects in normal subjects randomized to venlafaxine or placebo.Neuropsychopharmacology.20053079279915637637
- HunterAM.LeuchterAF.MorganML.CookIA.Changes in brain function (quantitative EEG cordance) during placebo lead-in and treatment outcomes in clinical trials for major depression.Am J Psychiatry.20061631426143216877657
- HunterAM.KorbAS.CookIA.LeuchterAF.Rostral anterior cingulate activity in major depressive disorder state or trait marker of responsiveness to medication?J Neuropsychiatry Clin Neurosci.20132512613323686030
- El-HageW.LemanS.CamusV.BelzungC.Mechanisms of antidepressant resistance.Front Pharmacol.20134 146
- LeuchterAF.CookIA.HunterAM.KorbAS.A new paradigm for the prediction of antidepressant treatment response.Dialogues Clin Neurosci.20091143544620135901
- LeuchterAF.CookIA.MarangellLB.et alComparative effectiveness of biomarkers and clinical indicators for predicting outcomes of SSRI treatment in Major Depressive Disorder: results of the BRITE-MD study.Psychiatry Res.200916912413119712979
- de GeusEJ.From genotype to EEG endophenotype: a route for postgenomic understanding of complex psychiatric disease?Genome Med.201026320828426
- LeistedtSJ.LinkowskiP.Brain, networks, depression, and more.Eur Neuropsychopharmacol.201323552362
- SmitDJ.StamCJ.PosthumaD.BoomsmaDl.de GeusEJ.Heritability of “small-world” networks in the brain: a graph theoretical analysis of resting-state EEG functional connectivity.Hum Brain Mapp.2008291368137818064590
- LeuchterAF.CookIA.GilmerWS.et alEffectiveness of a quantitative electroencephalographic biomarker for predicting differential response or remission with escitalopram and bupropion in major depressive disorder.Psychiatry Res.200916913213819709754
- losifescuDV.GreenwaldS.DevlinP.et alFrontal EEG predictors of treatment outcome in major depressive disorder.Eur Neuropsychopharmacol.20091977277719574030
- BaresM.NovakT.KopecekM.BrunovskyM.StopkovaP.HöschlC.The effectiveness of prefrontal theta cordance and early reduction of depressive symptoms in the prediction of antidepressant treatment outcome in patients with resistant depression: analysis of naturalistic data.Eur Arch Psychiatry Clin Neurosci.2014. [Epub ahead of print]
- CookIA.LeuchterAF.MorganM.et alEarly changes in prefrontal activity characterize clinical responders to antidepressants.Neuropsychopharmacol.200227120131
- CookIA.HunterAM.AbramsM.SiegmanB.LeuchterAF.Midline and right frontal brain function as a physiologic biomarker of remission in major depression.Psychiatry Res.200917415215719853417
- BaresM.BrunovskyM.KopecekM.et alChanges in QEEG prefrontal cordance as a predictor of response to antidepressants in patients with treatment resistant depressive disorder: a pilot study.J Psychiatr Res.2007131932516889798
- BaresM.BrunovskyM.KopecekM.et alEarly reduction in prefrontal theta QEEG cordance value predicts response to venlafaxine treatment in patients with resistant depressive disorder.Eur Psychiatry.20082335035518450430
- BaresM.BrunovskyM.NovakT.et alThe change of prefrontal QEEG theta cordance as a predictor of response to bupropion treatment in patients who had failed to respond to previous antidepressant treatments.Eur Neuropsychopharmacol.20102045946620421161
- BaskaranA.MilevR.McintyreRS.The neurobiology of the EEG biomarker as a predictor of treatment response in depression.Neuropharmacology.20126350751322569197
- BaresM.BrunovskyM.NovakT.et alQEEG theta cordance in the prediction of treatment outcome to prefrontal repetitive transcranial magnetic stimulation or venlafaxine ER in patients with Major Depressive Disorder.Clin EEG Neurosci.2014. [Epub ahead of print]
- OzekesS.ErguzelT.SayarGH.TarhanN.Analysis of brain functional changes in high-frequency repetitive Transcranial Magnetic Stimulation in treatment-resistant depression.Clin EEG Neurosci.2014. [Epub ahead of print]
- ArnsM.DrinkenburgWH.FitzgeraldPB.KenemansJL.Neurophysiological predictors of non-response to rTMS in depression.Brain Stimul.2012556957622410477
- BroadwayJM.HoltzheimerPE.HilimireMR.et alFrontal theta cordance predicts 6-month antidepressant response to subcallosal cingulate deep brain stimulation for treatment-resistant depression: a pilot study.Neuropsychopharmacology.2012371764177222414813
- HunterAM.CookIA.GreenwaldSD.et alThe antidepressant treatment response index and treatment outcomes in a placebo-controlled trial of fluoxetine.J Clin Neurophysiol.20112847848221946361
- LeuchterAF.CookIA.DeBrotaDJ.et alChanges in brain function during administration of venlafaxine or placebo to normal subjects.Clin EEG Neurosci.20083917518119044214
- LlinásRR.RibaryU.JeanmonodD.KronbergE.MitraPP.Thalamocortical dysrhythmia: a neurological and neuropsychiatric syndrome characterized by magnetoencephalography.Proc Natl Acad Sci USA.199996152221522710611366
- LlinásR.RibaryU.JeanmonodD.CancroetR.alThalamocortical dysrhythmia I. Functional and imaging aspects.Thal Rel Sys.20011237244
- LlinásR.UrbanoFJ.LeznikE.RamirezRR.van MarieHJF.Rhythmic and dysrhythmic thalamocortical dynamics: GABA systems and the edge effect.Trends Neurosci.20052832533315927689
- Perez-ReyesE.LoryMolecular biology of T-type calcium channels.CNS Neurol Disord Drug Targets.2006560560917168745
- SchulmanJJ.CancroR.LoweS.LuF.WaltonKD.LlinásRR.Imaging of thalamocortical dysrhythmia in neuropsychiatry.Front Hum Neurosci.2011511121283556
- MoncktonJE.McCormickDA.Neuromodulatory role of serotonin in the ferret thalamus.J Neurophysiol.2002872124213611929930
- CeladaP.PuigMV.ArtigasF.Serotonin modulation of cortical neurons and networks.Front Integr Neurosci.201372523626526
- MaejimaT.MasseckOA.MarkMD.HerlitzeS.Modulation of firing and synaptic transmission of serotonergic neurons by intrinsic G proteincoupled receptors and ion channels.Front Integr Neurosci.201374023734105
- HughesSW.LörinczM.CopeDW.et alSynchronized oscillations at alpha and theta frequencies in the lateral geniculate nucleus.Neuron.20044225326815091341
- CrunelliV.CopeDW.HughesSW.Thalamic T-type Ca2* channels and NREM sleep.Cell Calcium.20064017519016777223
- HughesSW.CrunelliV.Thalamic mechanisms of EEG alpha rhythms and their pathological implications.Neuroscientist.20051135716061522
- FugettaG.NohA.A neurophysiological insight into the potential link between transcranial magnetic stimulation, thalamocortical dysrhythmia and neuropsychiatric disorders.Exp Neurol.20124886393397
- De RidderD.Should rTMS for tinnitus be performed left-sided, ipsilaterally or contralaterally, and is it a treatment or merely investigational?Eur J Neurol.20101789189220236176
- KopellB.GreenbergB.Anatomy and physiology of the basal ganglia: implications for DBS in psychiatry.Neurosci Behav Rev.200832408422
- BianchiMT.Non-serotonin antidepressant actions: Direction channel modulation by SSRIs and the concept of single agent poly-pharmacy. MedHypoth.200870951956
- ContrerasD.The role of T-channels in the generation of thalamocortical rhythms.CNS Neurol Disord Drug Targets.2006557158517168743
- ShinHS.CheongEJ.ChoiS.LeeJ.NaHS.T-type Ca2+ channels as therapeutic targets in the nervous system.Curr Opin Pharmacol.20088334118203662
- BruderGE.SedorukJP.StewartJW.McGrathPJ.QuitkinFM.TenkeCE.Electroencephalographs alpha measures predict therapeutic response to a selective serotonin reuptake inhibitor antidepressant pre- and post -treatment findings.Biol Psychiatry.2008631171117718061147
- GalderisiS.MucciA.BucciP.MignoneML.MajM.Influence of moclobemide on cognitive functions of nine depressed patients: pilot trial with neurophysiological and neuropsychological indices.Neuropsychobiology.19963348548821375
- KnottVJ.TelnerJI.LapierreYD.BrowneM.HornER.Quantitative EEG in the prediction of antidepressant response to imipramine.J Affect Disord.1996391751848856421
- UlrichG.HaugHJ.StieglitzRD.FähndrichE.Are there distinct biochemical subtypes of depression? EEG characteristics of clinically defined on-drug responders and non-responders.J Affect Disord.1988151811852975689
- WidgeAS.AveryDH.ZarkowskiP.Baseline and treatment-emergent EEG biomarkers of antidepressant medication response do not predict response to repetitive transcranial magnetic stimulation.Brain Stimul.2013692993123763894
- HunterAM.LeuchterAF.CookIA.AbramsM.Brain functional changes (QEEG cordance) and worsening suicidal ideation and mood symptoms during antidepressant treatment.Acta Psychiatr Scand.201012246146920384600
- HunterAM.MuthénBO.CookIA.LeuchterAF.Antidepressant response trajectories and quantitative electroencephalography (QEEG) biomarkers in major depressive disorder.J Psychiatr Res.201044909819631948
- Wi'sniewskiGS.McAllister-WilliamsRH.JakitowiczJ.NowickiZ.MajkowiczM.TrzebiatowskaIA.Effects of antidepressant drugs on electroencephalography alpha power: importance of study duration.Biol Psychiatry.200864e5e618801473
- BuzsákiG.AnastassiouCA.KochC.The origin of extracellular fields and currents-EEG, ECoG, LFP and spikes.Nat Rev Neurosci.20121340742022595786
- RosanovaM.CasaliA.BellinaV.RestaF.MariottiM.MassiminiM.Natural frequencies of human corticothalamic circuits.J Neurosci.2009297679768519535579
- CookIA.HunterAM.KorbAS.LeuchterAF.Do prefrontal midline electrodes provide unique neurophysiologic information in Major Depressive Disorder?J Psychiatr Res.201453697524630467
- KorbAS.CookIA.HunterAM.LeuchterAF.Brain electrical source differences between depressed subjects and healthy controls.Brain Topogr.20082113814618958615
- HagmannP.ThiranJP.JonassonL.et alDTI mapping of human brain connectivity: statistical fibre tracking and virtual dissection.Neurolmage.200319545554
- EckertU.MetzgerCD.BuchmannJE.et alPreferential networks of the mediodorsal nucleus and centromedian-parafascicular complex of the thalamus--a DTI tractography study.Hum Brain Mapp.2012332627263721932264
- AnandA.LiY.WangY.LoweMJ.DzemidzicM.Resting state corticolimbic connectivity abnormalities in unmedicated bipolar disorder and unipolar depression.Psychiat Res Neuroim.2009171189198
- OsobaA.HänggiJ.LiM.et alDisease severity is correlated to tract specific changes of fractional anisotropy in MD and CM thalamus-A DTI study in major depressive disorder.J Affect Disord.201314911612823489404
- ArnsM.OlbrichS.Two EEG channels do not make a'quantitative EEG (QEEG)': a response to Widge, Avery and Zarkowski (2013).Brain Stimul.2014714614824269203
- WangDH.Wong-LinK.Comodulation of dopamine and serotonin on prefrontal cortical rhythms: a theoretical study.Front Integr Neurosci.201375423935568
- HarveyBD.SiokCJ.KissT.et alNeurophysiological signals as potential translatable biomarkers for modulation of metabotropic glutamate 5 receptors.Neuropharmacology.201375193023831682
- HiyoshiT.KambeD.KarasawaJ.ChakiS.Differential effects of NMDA receptor antagonists at lower and higher doses on basal gamma band oscillation power in rat cortical electroencephalograms.Neuropharmacology.20148538439624907590
- BianchiMT.BotzolakisEJ.Targeting ligand-gated ion channels in neurology and psychiatry: is pharmacological promiscuity an obstacle or an opportunity?BMC Pharmacol.201010320196850
- HunterA.BordelonY.CookI.LeuchterA.QEEG measures in Huntington's Disease: a pilot study.PLoS Curr.2010 Oct 252RRN119221037796
- GiacomelloM.OliverosJC.NaranjoJR.CarafoliE.Neuronal Ca(2+) dyshomeostasis in Huntington disease.Prion.20137768423324594
- KantorS.SzaboL.VargaJ.CuestaM.MortonAJ.Progressive sleep and electroencephalogram changes in mice carrying the Huntington's disease mutation.Brain.20131362147215823801737
- FisherSP.BlackSW.SchwartzMD.et alLongitudinal analysis of the electroencephalogram and sleep phenotype in the R6/2 mouse model of Huntington's disease.Brain.20131362159217223801738
- WardenD.TrivediMH.WisniewskiSR.et alPredictors of attrition during initial (citalopram) treatment for depression: a STAR*D report.Am J Psychiatry.20071641189119717671281
- OlfsonM.MarcusS.Tedeschi M: Continuity of antidepressant treatment for adults with depression in the United StatesAm J Psychiatry.200616310110816390896
- Martins-de-SouzaD.Proteomics, metabolomics, and protein interactomics in the characterization of the molecular features of major depressive disorder.Dialogues Clin Neurosci.201416637324733971