
Abstract
The development of novel high-throughput technologies has opened up the opportunity to deeply characterize patient tissues at various molecular levels and has given rise to a paradigm shift in medicine towards personalized therapies. Computational analysis plays a pivotal role in integrating the various genome data and understanding the cellular response to a drug. Based on that data, molecular models can be constructed that incorporate the known downstream effects of drug-targeted receptor molecules and that predict optimal therapy decisions. In this article, we describe the different steps in the conceptual framework of computational modeling. We review resources that hold information on molecular pathways that build the basis for constructing the model interaction maps, highlight network analysis concepts that have been helpful in identifying predictive disease patterns, and introduce the basic concepts of kinetic modeling. Finally, we illustrate this framework with selected studies related to the modeling of important target pathways affected by drugs.
El desarrollo de nuevas tecnologías de alto rendimiento ha abierto la posibilidad de caracterizar en profundidad tejidos de los pacientes en varios niveles moleculares y ha dado lugar a un cambio de paradigma en la medicina hacia terapias personalizadas. El análisis computacional juega un papel central para integrar diversos datos del genoma y comprender la respuesta celular a un fármaco. En base a estos datos se pueden construir modelos moleculares que incorporen los efectos posteriores conocidos de los receptores moleculares blanco de los fármacos y así predecir las decisiones terapéuticas óptimas. En este artículo se describen las diferentes etapas del marco conceptual del diseño computacional. Se revisan las fuentes que contienen información sobre las vías moleculares que construyen las bases para diseñar los mapas de interacción del modelo, se destacan los conceptos de análisis de redes que han sido útiles en la identificación de patrones patológicos predictivos y se introducen los conceptos básicos de diseño cinético. Por último, se ilustra este marco con estudios seleccionados que se relacionan con el diseño de importantes vías blanco que son afectadas por los fármacos.
Le développement des nouvelles technologies à haut débit a permis de décrire en détail les tissus des patients à différents niveaux moléculaires et a provoqué un changement de praradigme en médecine, vers les traitements personnalisés. L'analyse informatique joue un rôle central dans l'intégration des différentes données du génome et dans la compréhension de la réponse cellulaire à un médicament. Selon ces données, il est possible de construire des modèles moléculaires qui comprennent les effets connus des molécules en aval du récepteur cible par le médicament ; cela permet un choix optimal lors des décisions thérapeutiques. Nous décrivons dans cet article les différentes étapes du cadre conceptuel de la modélisation informatique. Nous passons en revue les sources des informations sur les voies moléculaires, bases de construction des cartes d'interaction des modèles ; nous soulignons les concepts d'analyse de réseaux utiles pour identifier quelles configurations des maladies ont une valeur prédictive ; nous expliquons les idées de base de la modélisation cinétique. Enfin, nous illustrons ces concepts à l'aide d'études de la modélisation des cibles importantes influencées par les médicaments.
Introduction
The relatively poor efficacy of current drug treatments (illustrated, for example, with overall short survival times of cancer patients) along with the tremendous efforts in time and cost in drug development has given rise to a change in paradigm from blockbuster medicine to more personalized approaches.Citation1,Citation2 While some neuropsychiatric diseases may remain barely treatable, individualized approaches have the potential to improve therapy in many other domains. Predicting individual molecular responses to a drug, for example, those caused by a certain mutation that foils the beneficial effects of the drug, is already addressed with gene tests prior to medical treatment, known as “precision medicine.”Citation3
This paradigm shift has been enabled by new developments in biotechnology, in particular novel high-throughput sequencing technologies, along with quantitative proteomics. These have tremendously changed our abilities to implement personalized medicine.Citation4 On the other hand, these new developments impose huge challenges on the interpretation of these data in the clinical context. Large worldwide consortia, for example the 1000 Genomes ProjectCitation5 and International Cancer Genome Consortia,Citation6 generate huge amounts of sequencing information on human genetic variation that allow deep characterization of a patient's genome and contrasting of this information against the entire, “normal,” population. In contrast to the cancer field, neuroscience has been fairly reluctant to adopt genomics concepts, presumably because of the heterogeneity of neural material, the complexity of neural pathways, and, in the human situation, the lack of direct access to brain tissue, necessitating work with postmortem tissue.Citation7,Citation8 However, recent technology developments allow working with an ever-decreasing amount of material in more and more pure cell types, which makes genomics technology attractive for neuroscience. This has opened up the new research field of neurogenomics, which includes the genome-wide study of the nervous system and gene expression atlases of the brain, as well as network science.Citation9 Applications comprise DNA (re-)sequencing, the analysis of the transcriptome (RNA sequencing), the methylome (methyl sequencing) or the targeted enrichment of specific transcription factors using appropriate antibodies (chromatin immunoprecipitation [ChIP] sequencing) so that, in principle, dysfunctional molecular mechanisms in human diseases can be studied at a high level of detail (see Box for definitions of technical terms).Citation10 Additionally, proteomics technologies, such as the quantitative analysis of complex protein mixtures either with stable isotope labeling by amino acids in cell culture (SILAC)Citation11 or with isotope-coded affinity tags (ICAT),Citation12 or the measurement of protein expression with antibodies through reverse phase protein arrays (RPPA)Citation13 deliver quantitative measurements of proteins and thus information on functional changes in signaling pathways due to the disease under study.
While the measurement of the molecular landscape of a genome has quickly evolved during recent years, the bottleneck of molecular personalized medicine is clearly the computational analysis of the data along with its integration and interpretation in the disease context. Here, the sheer amount of data, comprising millions of data points, along with the complexity of the underlying data types that are often poorly correlated, is a challenge. Thus, new computational research fields such as “systems biology” or “systems medicine” have emerged that essentially aim to interpret genomic data at the molecular network level.Citation14
Molecular networks are the key drivers of biological function. For example, a targeted drug exerts its effects by the inhibition or activation of drug targets that then activate or deactivate signaling cascades inside the cell, which in turn activate transcription factors that alter the gene expression response and, ultimately, lead to transient and rarely definite physiological or metabolic changes in the phenotype. Thus, the description of these networks is a key component in understanding the mode of action of a drug.
Knowledge about molecular interactions is spread through more than 500 dedicated data resources.Citation15 These databases are mostly curated, ie, their content is supervised by experts and annotators, and present detailed knowledge about specific organisms, specific interaction types (eg, protein-protein interactions, metabolic or signaling reactions) or specific disease domains (eg, cancer). On the other hand, there are ongoing attempts to try to integrate as much of these resources into meta-databases in order to derive more complete interaction networks.Citation16
Molecular interaction networks have been used to infer function from high-throughput data and to draw hypotheses on the effects of drugs. There are essentially two strategies to explore drug action in the light of experimental data. The first approach maps experimental data onto large interaction networks and utilizes emerging properties of these networks through the computation of substructures or topological features. Results of this analysis are heavy-weighted subnetworks that can be used for qualitatively judging consequences of drug effects. The second approach uses kinetic modeling by describing the interaction network in mathematical terms, eg, with ordinary differential equation (ODE) systems, and by “translating” experimental data to kinetic model parameters (see ). Then, the dynamics of the system is simulated over time and results of key model parameters are used to judge the effect of the drug response.
In this article, we discuss the different steps in the course of modeling drug responses from experimental data, network building, as well as parameter fitting and model analysis. We review key aspects of the bioinformatics analyses and illustrate the conceptual framework with published examples from the neuroscience domain.
Resources for molecular pathway information
A mathematical model starts with the description of its species such as genes, proteins, protein complexes, or metabolites found to be dysregulated upon drug delivery. It is beyond the scope of this article to de scribe the different experimental omics and targeted approaches as well as primary data analysis methods that are used to quantify and identify the relevant molecules and, thus, we refer the reader to recent reviews on sequencing technology,Citation17 and proteomics applications,Citation18,Citation19 as well as analysis methods, for example for transcriptomeCitation20 and mass spectrometry-based proteome data (see Box).Citation21
The next step in modeling is the definition of the interactions between the molecular components of interest. Interaction specification involves identifying the molecular drug targets along with their cellular signaling network and establishing relevant links to the metabolism and the gene regulatory system. A helpful concept in this direction is the molecular pathway concept. Pathway information, depicting the cellular information and mass flow from nuclear receptors to transcriptional regulators, is widely available. According to the recent pathway resource list, there are more than 500 databases that hold information on molecular interactions.Citation15 These databases comprise experimental results from large-scale studies on protein-protein interactions such as yeast-2-hybrid, experiments on protein-DNA interactions such as ChlP-sequencing, drug-target interactions or cellular signaling pathways annotated from functional experiments, literature, or expert knowledge. It should be noted, though, that the databases are manually curated so that variations in pathway annotation might occur. For example, for recent annotations of the well-studied “apoptosis” signaling pathway in three widely accessed databases, 76% of the annotated proteins are specific for a single database compared with only 24% of annotated proteins that are shared by at least two databases (). The reason for this is that pathway boundaries are not clearly defined, and that expert opinion on the extent of crosstalk with other pathways is highly variable. Additionally, pathway annotations are commonly focused on specific substructures or specific cellular context (eg, tissues, diseases, organisms), which may result in variations of the assembled protein lists.
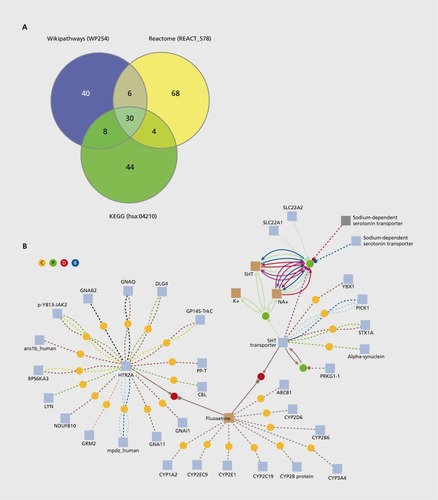
This high variation in pathway annotation has given rise to the development of meta-databases, for example ConsensusPathDBCitation22 or STRING,Citation23 that integrate many different resources along with many different types of interactions, such as protein-protein, drug-target, signaling, and metabolic interactions, and, thus, allow a more complete view on pathways. Figure 1B exemplifies such an integrated view of drug action with fluoxetine (Prozac®). Fluoxetine is used as an antidepressant and belongs to the class of selective serotonin reuptake inhibitors (SSRIs). These compounds increase the extracellular level of the neurotransmitter serotonin in the brain. The compound has multiple interactions with metabolizing enzymes from the cytochrome P450 family as well as with the family of serotonin receptors and transporters.Citation24 By combining information on different interaction types, an integrated view can be generated in which drugs are linked to molecular targets and the molecular consequences of drug action can be monitored, building the basis for the generation of molecular models.
Pathway concepts can be directly used for the analysis of drug response with high-throughput data. For example, Yildirimman et alCitation25 investigated the carcinogenic hazard of different classes of chemicals in hepatocyte-like cells derived from human embryonic stem cells and found that transcriptome analysis based on pathways yields more robust classifiers as compared with singlegene expression analysis. Here, the expression changes for entire pathways were computed with a numerical score derived from all genes assigned to the pathway. Similar methodology has been carried out, eg, with T-profilerCitation26 or gene set enrichment analysis.Citation27
Analyzing interaction networks
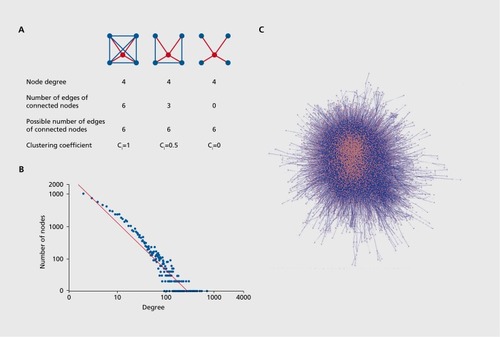
Besides the analysis of data in the light of preannotated pathways, researchers try to extract functional information from large interaction networks in an unsupervised way, ie, without prior knowledge on specific gene sets or pathways. In these approaches, molecular interactions are modeled with mathematical networks, ie, proteins correspond to network nodes and an interaction between two proteins is represented by an edge connecting the corresponding nodes. The human protein-protein interaction network is fairly large, comprising hundreds of thousands of interactions. Network theory aims at the computation of local and global properties of interaction networks and the deduction of emerging properties that might explain cellular function.Citation28,Citation29 Network theory has a long tradition, and started in the 1950s with the seminal work of Erdösz and Rényi,Citation30 who invented the framework of random networks, ie, networks where nodes are connected by edges in a random way. Random networks are not what we observe in biological systems; however, local and global topological measures can be used to distinguish them from real-world networks. One such local measure is, eg, the clustering coefficient, Ci , of a node i, which measures its local connectedness. The measure evaluates the nodes that are connected with node i (the neighbors) by dividing the number of existing edges between the neighbors of node i by the number of all possible edges between the neighbors (). Another important local feature is the node degree, D., of node i, ie, the total number of edges of this node with other nodes. A global feature important for real-world graphs is the characteristic path length, L. This feature measures the average shortest path length between all possible pairs of nodes in the network. These characteristics were used in the seminal papers of Watts and StrogatzCitation31 and Barabasi and AlbertCitation32 to distinguish biological networks from random ones. Watts and Strogatz found that socalled real-world networks, in contrast to random ones, have a high clustering coefficient, ie, a relatively high local connectivity while the average path length stays small. In addition, Barabasi and Albert introduced the notion of scale-free networks that show a small number of highly connected hubs and many nodes with only few connections. Typically, the node distribution of such networks follows a power law in contrast to the node distribution of random graphs that follow a Gaussian law. These characteristics explain the relative robustness of biological systems. Such scale-free networks are robust against random failures (eg, mutations) since it is very likely that the mutation occurs in a node with a low number of connections. On the other hand, the networks are very sensitive against failures of hub proteins since they are heavily connected with other proteins. As an example, we illustrate this with the human protein-protein interaction network composed of high quality interactions derived from the ConsensusPathDB. This network comprises 9 533 proteins with 80 422 interactions. It has an average cluster coefficient of 0.23 and characteristic path length of 3. The node degree follows the postulated power law (Figures 2B and 2C; see Box for explanation of terms used).
Large interaction networks have been applied in the analysis of high-throughput data. Ilofree et al,Citation33 for example, showed that protein-protein interaction networks can be used for classifying subtypes of diseases. Additionally, weighted gene coexpression network analysis (WGCNA)Citation34 has been introduced (see Box). This approach judges pairwise correlation of genes measured on their expression profiles from a set of experiments and organizes the gene pairs in a network structure. Next, multidimensional clustering is applied to generate clusters of local coexpression, which then can be associated with experimental phenotypes. Using this approach, several studies on human and animal brain generated stable network patterns with functional implications for neuroscience.Citation35,Citation36,Citation37 For example, in the latter work, Winden et alCitation37 used the WGCNA approach to investigate transcriptional profiles derived from microarray analysis of twelve populations of neurons in the adult mouse forebrain (cingulate cortex, pyramidal neurons, GABAergic interneurons, hippocampus, and thalamus, among others). They generated clusters of genes that could be associated with neuronal function and exert an underlying network structure of the neuronal transcriptome (see Box). They identified 13 modules with characteristic gene expression patterns that could be related to biological function, for example a module that corresponded to the subset of interneurons derived from the subpallium. As a highly connected gene in these samples they identified galectin-1, a previously unknown marker for this class of cells.
Basic concepts of dynamic modeling
While the approaches described so far generate static pictures of the cells under study in form of interaction networks or modules (subnetworks) thereof, dynamic computer modeling requires: (i) the construction of a directed network of model components (ie, proteins, complexes, metabolites), and (ii) the kinetic description of the interactions (see Box). Such models, when fitted to experimental data, can be used for predictive purposes, eg, predicting whether a perturbation introduced by a certain drug has specific effects on the model components, identifying model components that are highly sensitive with respect to the treatment, or predicting more general model features such as robustness and stability.Citation38,Citation39
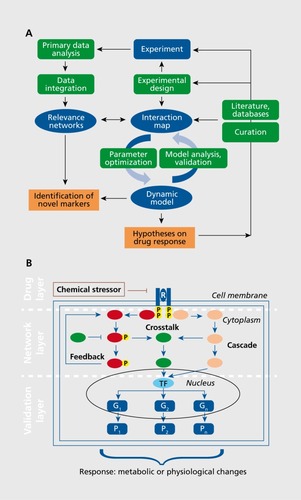
The generic framework of such dynamic modeling is illustrated in . Model design takes into account the experiments that interrogate the model along with a specification of the model components. Next, the interaction map has to be specified containing all interactions that interconnect the different species. The interaction map is typically retrieved from literature, interaction databases, or from the network approaches described in the previous section.Citation40 Prominent tools that assist in the automated construction of such interactions maps are, for example, CellDesigner,Citation41 Cytoscape,Citation42 and PathVisio.Citation43 Using these tools, large interaction maps of biochemical pathways have been designed such as the EGFR (epidermal growth factor receptor)Citation44 and the mTOR (mammalian target of rapamycin)Citation45 signaling pathways. Additionally, interaction maps for specific neurodegenerative diseases have been constructed, eg, for Alzheimer's disease (AD).Citation46 In the neuroscience field, there is specific interest in the modeling of neurons. Several software packages exist that allow construction and modeling of neurons such as NEURONCitation47 or neuroConstruct.Citation48
In the deterministic kinetic modeling approach, the mathematical model is generated from the interaction map by defining reactions and the according reaction kinetics. Kinetic laws are mathematical terms that involve the vector of model components,, and kinetic parameters,. For example, the law of mass action for a unimolecular reaction has the kinetic law:
v = k S
Here, S indicates the total number of molecules of a species per cell, v denotes the rate and k the rate constant. Kinetic laws can be of any specificity and complexity, and are defined in order to reflect the dynamics and properties of reactions in networks. Additionally, positive and negative feedback loops can be introduced to realize specific influences on single reactions or oscillatory behavior.Citation49,Citation50
Figure 3B illustrates the general schema of a molecular model for drug response. Basically, three layers have to be implemented. The first layer describes the drug-target interactions and determines the effect of the drug on the target proteins; target proteins can be nuclear receptors, enzymes, ion channels, transporter proteins, among others, and are predominantly inhibited by the drug, however, there are several drugs that activate their targets. It should be noted that the space of cellular drug targets is rather limited; for example, early estimations by Drews and RyserCitation51 suggested 487 potential targets, while after completion of the human genome sequence and the development of small-molecule drugs the estimated number of targets was increased to several thousands.Citation52 Current estimations range again in the order of hundreds of targets for a wide range of diseases.Citation53 The second layer describes the relevant cellular downstream effects such as signaling cascades, feedback loops, and crosstalk between different pathways. It has been discovered that signaling pathways are composed of a couple of typical building blocks such as Ras proteins, G protein cylces, phosphorelay systems, or MAPK (mitogen-activated protein kinase) cascades. The latter have been implicated in the pathogenesis of a variety of human disorders including cancer and neurodegenerative diseases such as AD, Parkinson's disease (PD), and amyotrophic lateral sclerosis (ALS). The third layer describes the essential readouts of the model that constitute the metabolic or physiological changes implied by the drug action. Responses of these readouts, eg, simulated changes in specific protein concentrations upon perturbation of the model by the drug, are used to predict drug effects as well as to judge and adapt the model parameters.
Generic kinetic models of basic molecular pathways are stored in model databases, for example BioModels,Citation54 and are represented with specific file formats that track information on all components, interactions, and mathematical descriptions of the model in order to ensure exchange, retrieval, and import to model analysis tools. Accepted community standards for model storage and representation are SBMLCitation55 and BioPAX,Citation56 among others.
The critical bottleneck of molecular modeling is the uncertainty about the kinetic parameters, for example the rate constant in the above formula. These parameters have to be determined either by literature search or by computational analysis. Literature search involves databases that store already measured parameters from similar experiments and/or cellular models. BRENDA,Citation57 for example, is a database that includes comprehensive enzyme kinetic information. Parameters for metabolic models can be retrieved for many enzymes and, for example, Michaelis-Menten reaction rates. Similarly, SABIO-RKCitation58 holds information on reaction kinetics from various experimental conditions. Computational analysis uses selected model readouts and calibrates the model parameters to fit experimental data on these components, for example, derived from protein quantification (RPPA, Western blots), by minimizing a risk function. The set (or sets) of parameters that minimizes the predefined risk function is chosen as model parameters. Several mathematical approaches can be used, such as global optimization methods, either deterministicCitation59 or stochastic.Citation60 In particular, evolutionary approaches were shown to perform well in parameter optimization.Citation61 This class of algorithms uses evolutionary concepts such as mutations, selection, and recombination, in an iterative way in order to find the best set of parameters. Further stochastic approaches encompass, for example, Monte-Carlo samplingCitation62 or simulated annealing.Citation63
Once the model is fitted to experimental data, simulation experiments can be carried out that assist in the identification of biomarkers (for example using sensitivity analysisCitation64), in the testing of new hypotheses and the prediction of time and dosage effects of drugs and other external stressors.
Drug response modeling: selected examples
Here, we will describe recently published work that demonstrates the potentials and guide to possible further applications of drug response modeling.
Chang et alCitation65 investigated the cell signaling mechanisms induced by hallucinogens in human kidney cells. Using computational and experimental data they modeled the downstream effects of the activation of serotonin (5-hydroxytryptamine/5-HT) receptors 5-HT1AR and 5-HT2AR, both alone and in combination, and the resulting effects on the extracellular signal-regulated kinase (ERK) pathway that is a known target of hallucinogens. Dysfunction of serotonin receptors is a common observation in schizophrenia and depression, among others. Both receptors are coupled to different G proteins and induce different downstream signaling that results in a huge variability of drug response patterns dependent on which receptor is activated by the drug.Citation66 The authors build a computational model containing two branches of signaling cascades that result in MAPK activation by the different subtypes of serotonin receptors: while 5-HT1AR is coupled to Gi/G0 proteins and stimulates the MAPK cascade by phosphatidylinositol 3'-kinase (PI3K), 5-HT2AR is Gq/11 coupled and activates the MAPK cascade via protein kinase C (PKC)/Raf-1. Authors gave kinetic descriptions for transformation, translocation, and complex building of proteins and used mass action law as well as Michaelis-Menten kinetics to describe the dynamics. As the central model readout they used the amount of phosphorylated ERK1/2 at different time points. Simulation experiments were carried out with MATLAB. Kinetic parameters were partly taken from the literature and partly determined by parameter optimization using experimental data from Western blots measured on the pERK1/2 time courses as calibration. Using the model, the authors showed both experimentally and with model simulations that there are distinct responses dependent on the activation of the different receptors, in particular that 5-HT1AR agonists induced rather transient ERK activation by phosphorylation while 5-HT2AR agonists induced more sustained responses.
Wierling et alCitation67 examined the response of the epidermial growth factor receptor (EGFR)-mediated signaling network on targeted cancer therapies such as cetuximab (erbituxTM) and erlotinib (tarcevaTM) with a mere in silico approach. They generated an interaction map from literatureCitation68 and described the kinetic interactions with a small set of different reaction types such as synthesis reactions, product formation, and degradation, which followed mass action law equations. In order to cope with the uncertainty in kinetic parameters, they used a massively parallel Monte-Carlo sampling strategy: kinetic parameters were sampled according to a log-normal probability distribution and simulations were carried out in the perturbed (drug action) and the nonperturbed state (no drug action) of the model. Resulting differences in model components were tracked. Next, this procedure was repeated multiple times with different parameter sets. Finally, an overall statistic was computed combining all repeated simulation runs. Simulation experiments were carried out with the custom modeling software PyBioS developed by the authors. Interestingly, they were able to show that the resulting variance in response of the model components was fairly low and, secondly, they were able to predict changes in drug response with respect to common knowledge on the effect of somatic mutations that are typically found in cancer patients, eg, a gain of function mutation in the B-Raf protein which leads to continuous proliferation even in the presence of an EGFR drug inhibitor. This paper exemplifies how computational modeling can be used to mimic different, and patient-specific, responses to targeted cancer therapy.
Chen et alCitation69 built and investigated a large computational model for the ErbB signaling pathway. The model contained different receptors (EGFR, HER2/neu2, ErbB3, and ErbB4) and immediate-early downstream responses involving MAPK and PI3K/AKT cascades. These receptors and activated signaling cascades control important cellular functions such as proliferation, survival, and motility, and dysregulation of the pathway is key in various cancer typesCitation70 as well as neurodegenerative diseases.Citation71 The model contained kinetic descriptions for dimerization/phosphorylation reactions, complex binding, and receptor binding, and follows mass action kinetics. Parameter values were determined with simulated annealing starting with a literature-defined parameter set. Model readouts were phosphorylated ERK and AKT and simulated time courses were fitted to experimental data measured in different cancer cell lines. The computational analysis was done with MATLAB. In addition, the authors used the model to predict dose response curves from targeted inhibitors gefitinib and lapatinib.
The above selective examples demonstrate how the model-building and model-fitting process is used to predict effects of therapies and to answer complex questions such as the different response in activation of subtypes of receptors through different agonists. However, it should be noted that besides these potentials there are major pitfalls of such modeling approaches, in particular the lack of quantitative data, the low number of time points measured for the individual model components and their restriction to particular cells (or subcellular fractions), to specific time points, and to a relatively small number of model components compared with the full genome active in a “real-world” patient. Nonetheless, computational models are helpful complements to experimental medicine and once a model is constructed and fitted to experimental data, quantitative behavior of readouts can aid in the generation of new hypotheses and the testing of new therapies. Furthermore, in silico experiments can be conducted in cases that are hardly, or even not, measurable with experiments, eg, multitherapy approaches. In cases where clinical testing is possible, for example with tumor-carrying xenograft mice, such in silico experiments could be used to prioritize therapy combinations, which in turn can be validated experimentally.
Conclusion and outlook
In this article we present the basic concepts and steps in the workflow of molecular modeling. We focused on time-dependent modeling inside the cell, in particular receptor-mediated signaling. It should be noted though that computational modeling is by no means restricted to this situation and comprises, for example, concepts for modeling spatial processes,Citation72 pharmacokinetic modeling,Citation73 as well as whole -bodyCitation74 and multiscale approachesCitation75 that have not been discussed in this work.
Systems biology-driven modeling of drug response will gain more importance with the ever-increasing amounts of genome data becoming available for individual patients. The further decrease in sequencing costs along with the generation of purer materials, such as single-cell omics analysesCitation76,Citation77 and material adapted closer to the individual patient, such as induced pluripotent stem (iPS) cells,Citation78,Citation79 enable completely new chances for personalized therapies. Here, in particular the incorporation of mutations and larger human variations, eg, in neuro-oncology,Citation80,Citation81 and allele-specific protein expressionCitation82,Citation83 will gain further importance. Additionally, the development of new imaging technology and the combination of different approaches will drive further insights.Citation84 Previously intractable to the approaches of human genetics, disorders of the brain are seeing accelerated gene discovery that was, until now, restricted to other branches of medicine. Genome analysis and genetic determinants in the research of neurodegenerative diseases will further give rise to linkage of molecular data with therapy decisions, for example with AD.Citation85 Neurogenomics as an emerging focus of neuroscience will further evolve with the results of genome-wide association studies and the knowledge of how these might be translated to the understanding of neurodegenerative diseasesCitation86 and psychiatric disorders.Citation87 As brain research has attracted immense funding opportunities in recent years, and large initiatives are on the way such as the European Union's Human Brain Project or the US Brain Activity Map Project,Citation88 it can be anticipated that further data and modeling methodology will be generated and will increase the demand for in silico tools in neuroscience as a useful and efficient complement to the experiments.
REFERENCES
- SikoraK.Personalized medicine for cancer: from molecular signature to therapeutic choice.Adv Cancer Res.20079634536917161685
- WoodcockJ.The prospects for ”personalized medicine“ in drug development and drug therapy.Clin Pharmacol Ther.2007816416917259943
- GarrawayLA.VerweijJ.BallmanKV.Precision oncology: an overview.J Clinic Oncol.20133118031805
- HerwigR.LehrachH.Expression profiling of drug response - from genes to pathways.Dialogues Clin Neurosci.2006828329317117610
- 1000 Genome Project Consortium. An integrated map of genetic variation from 1,092 human genomes.Nature.2012491566523128226
- International Cancer GenomeConsortiumInternational network of cancer genome projects.Nature.201046499399820393554
- GeschwindDH.KonopkaG.Neuroscience in the era of functional genomics and systems biology.Nature.200946190891519829370
- MimicsK.PevsnerJ.Progress in the use of microarray technology to study the neurobiology of disease.Nat Neurosci.2004743443915114354
- BoguskiMS.JonesAR.Neurogenomics: at the intersection of neurobiology and genome sciences.Nat Neurosci.2004742943315114353
- ShendureJ.Lieberman AidenE.The expanding scope of DNA sequencing.Nat Biotechnol.2012301084109423138308
- OngSE.BlagoevB.KratchmarovaI.et alStable isotope labeling by amino acids in cell culture, SILAC, as a simple and accurate approach to expression proteomics.Mol Cell Proteom.20021376386
- GygiSP.RistB.GerberSA.TurecekF.GelbMH.AebersholdR.Quantitative analysis of complex protein mixtures using isotope-coded affinity tags.Nat Biotechnol.19991799493110504701
- SpurrierB.RamalingamS.NishizukaS.Reverse-phase protein arrays for cell signaling analysis.Nat Protocols.2008317961808
- KlippE.LiebermeisterW.WierlingC.KowaldA.LehrachH.HerwigR.Systems Biology A Textbook. Weinheim, Germany: Wiley-Blackwell2009
- BaderGD.CaryMP.SanderC.Pathguide: a pathway resource list.Nucleic Acids Res.200634D504D50616381921
- KamburovA.PentchevK.GalickaH.WierlingC.LehrachH.HerwigR.ConsensusPathDB - towards a more complete picture of cell biology.Nucleic Acids Res.201139D712D71721071422
- MetzkerML.Sequencing technologies - the next generation.Nat Rev Genet.201011314519997069
- EmesRD.PocklingtonAJ.AndersonCN.et alEvolutionary expansion and anatomical specialization of synapse proteome complexity.Nat Neurosci.20081179980618536710
- MaartenAF.MunozJ.HeckAJR.Next-generation proteomics: towards an integrative view of proteome dynamics.Nat Rev Genet.201314354823207911
- GarberM.GrabherrMG.GuttmanM.TrapnellC.Computational methods for transcriptome annotation and quantification using RNA-seq.Nat Methods.2011846947721623353
- KumarC.MannM.Bioinformatics analysis of mass spectrometrybased proteomics data sets.FEBS Lett.20095831703171219306877
- KamburovA.StelzlU.LehrachH.HerwigR.ConsensusPathDB interaction database: 2013 update.Nucleic Acids Res.201341D793D80023143270
- FranceschiniA.SzklarczykD.FrankildS.et alSTRING v9.1: protein-protein interaction networks, with increased coverage and integration.Nucleic Acids Res.201341D808D81523203871
- MandrioliR.FortiGC.RaggiMA.Fluoxetine metabolism and pharmacological interactions: the role of cytochrome P450.Curr Drug Metab.2006712713316472103
- YildirimmanR.BrolénG.VilardellM.et alHuman embryonic stem cell derived hepatocyte-like cells as a tool for in vitro hazard assessment of chemical carcinogenicity.Toxicol Sci.201112427829021873647
- BoorsmaA.FoatBC.VisD.KlisF.BussemakerHJ.T-profiler: scoring the activity of predefined groups of genes using gene expression data.Nucleic Acids Res.200533W592W59515980543
- SubramanianA.TamayoP.VamsiK.et alGene set enrichment analysis: a knowledge-based approach for interpreting genome-wide expression profiles.Proc Natl Acad Sci U S A.2005102155451555016199517
- VidalM.CusickME.BarabasiAL.Interactome networks and human disease.Cell.201114498699821414488
- ZhuX.GersteinM.SnyderM.Getting connected: analysis and principles of biological networks.Genes Devel.2007211010102417473168
- ErdösP.RenyiA.On random graphs.Publ Math.19596290297
- WattsDJ.StrogatzSH.Collective dynamics of 'small-world' networks.Nature.19983934404429623998
- BarabasiAL.AlbertR.Emergence of scaling in random netowkrs.Science.199928650951210521342
- HofreeM.ShenJP.CarterH.GrossA.IdekerT.Network-based stratification of tumor mutations.Nat Methods.2013101108111524037242
- HorvathS.DongJ.Geometric interpretation of gene coexpression network analysis.PLoS Comput Biol.20084e100011718704157
- OldhamMC.HorvathS.GeschwindDH.Conservation and evolution of gene coexpression networks in human and chimpanzee brains.Proc Natl Acad Sci U S A.2006103179731797817101986
- OldhamMC.KonopkaG.IwamotoK.et alFunctional organization of the transcriptome in human brain.Nat Neurosci.2008111271128218849986
- WindenKD.OldhamMC.MimicsK.et alThe organization of the transcriptional network in specific neuronal classes.Mol Syst Biol.2009529119638972
- KitanoH.Computational systems biology.Nature.200242020621012432404
- KlippE.HerwigR.KowaldA.WierlingC.LehrachH.Systems Biology in Practice: Concepts, Implementation and Application. Weinheim, Germany: Wiley-VCH;2005
- GhoshS.MatsuokaY.AsaiY.HsinKY.KitanoH.Software for systems biology: from tools to integrated platforms.Nat Rev Genet.20111282183222048662
- FunahashiA.MatsuokaY.JourakuA.MorohashiM.KikuchiN.KitanoH.CellDesigner 3.5: a versatile modeling tool for biochemical networks.Proceed IEEE.20089612541265
- ClineMS.SmootM.CeramiE.et alIntegration of biological networks and gene expression data using Cytoscape.Nat Protocols.2007223662382
- van lerselMP.KelderT.PicoAR.et alPresenting and exploring biological pathways with PathVisio.BMC Bioinformatics2008939918817533
- OdaK.MatsuokaY.FunahashiA.KitanoH. A comprehensive pathway map of epidermal growth factor receptor signaling.Mol Syst Biol.200512005.001016729045
- CaronE.GhoshS.MatsuokaY.et alA comprehensive map of the mTOR signaling network.Mol Syst Biol.2010645321179025
- MizunoS.lijimaR.OgishimaS.et alAlzPathway: a comprehensive map of signaling pathways of Alzheimer's disease.BMC Syst Biol.201265222647208
- CarnevaleNT.HinesM.The Neuron Book. Cambridge, UK: Cambridge University Press;2005
- GleesonP.SteuberV.SilverRA.NeuroConstruct: a tool for modeling networks of neurons in 3D space.Neuron.20075421923517442244
- BhallaUS.IyengarR.Emergent properties of networks of biological signaling pathways.Science19992833813879888852
- KholodenkoBN.Cell-signalling dynamics in time and space.Nat Rev Mol Cell Biol.2006716517616482094
- DrewsJ.RyserS.The role of innovation in drug development.Nat Biotechnol.199715131813199415870
- HopkinsA.GroomC.The druggable genome.Nat Rev Drug Discov.2002172773012209152
- ImmingP.SinningC.MeyerA.Drugs, their targets and the nature and number of drug targets.Nat Rev Drug Discov.2006582183417016423
- Le NovèreN.BornsteinB.BroicherA.et alBioModels Database: a free, centralized database of curated, published, quantitative kinetic models of biochemical and cellular systems.Nucleic Acids Res.200634D689D69116381960
- HuckaM.FinneyA.SauroHM.et alThe Systems Biology Markup Language (SBML): a medium for representation and exchange of biochemical network models.Bioinformatics.20031952453112611808
- DemirE.CaryMP.PaleyS.et alThe BioPAX community standard for pathway data sharing.Nat Biotechnol.20102893594220829833
- SchomburgI.ChangA.PlaczekS.et alBRENDA in 2013: integrated reactions, kinetic data, enzyme function data, improved disease classification: new options and contents in BRENDA.Nucleic Acids Res.201341D764D77223203881
- WittigU.KaniaR.GolebiewskiM.SABIO-RK - database for biochemical reaction kinetics.Nucleic Acids Res.201240D790D79622102587
- HorstR.TuyH.Global Optimization. Deterministic Approaches. Heidelberg, Germany: Springer1990
- SchäfflerS.Global Optimization: A Stochastic Approach. Heidelberg, Germany: Springer2012
- MolesCG.MendesP.BangaJR.Parameter estimation in biochemical pathways: A comparison of global optimization methods.Genome Res.20032467247414559783
- KalosMH.Whitlock PaulaA.Monte Carlo Methods. Weinheim, Germany: Wiley-VCH2008
- KirkpatrickS.GelattJr CD.VecchiMP.Optimization by simulated annealing.Science.198322067168017813860
- LebedevaG.SorokinA.FaratianD.et alModel-based global sensitivity analysis as applied to identification of anti-cancer drug targets and biomarkers of drug resistance in the ErbB2/3 network.Eur J Pharm Sci.20124624425822085636
- ChangCW.PoteetE.SchetzJA.GümüsZH.WeinsteinH.Towards a quantitative representation of the cell signaling mechanisms of hallucinogens: Measurement and mathematical modelling of 5-HT1A and 5-HT2A receptor-mediated ERK1/2 activation.Neuropharmacology.20095621322518762202
- NicholsDE.Hallucinogens.Pharmacol Ther.20041013118114761703
- WierlingC.KühnA.HacheH.et alPrediction in the face of uncertainty: a Monte-Carlo-based approach for systems biology of cancer treatment.Mutat Res.201274616317022285941
- HanahanD.WeinbergRA.Hallmarks of cancer: the next generation.Cell.201114464667421376230
- ChenWW.SchoeberlB.JasperPJ.et alInput-output behavior of ErbB signaling pathway as revealed by a mass action model trained against dynamic data.Mol Syst Biol.2009523919156131
- HynesNE.LaneHA.ERBB receptors and cancer: the complexity of targeted inhibitors.Nat Rev Cancer.20055580
- FleckD.GarrattAN.HaassC.WillemM.BACE1 dependent neuregulin processing: review.Curr Alzheimer Res.2012917818322455478
- KholodenkoBN.Spatially distributed cell signalling.FEBS Lett.20095834006401219800332
- JonesHM.Rowland-YeoK.Basic concepts in physiologically based pharmacokinetic modeling in drug discovery and development.Pharmacom Syst Pharmacol.20132e63
- KraussM.SchallerS.BorchersS.FindeisenR.LippertJ.KuepferL.Integrating cellular metabolism into a multiscale whole-body model.PLoS Comput Biol.20128e100275023133351
- SlootPM.HoekstraAG.Multi-scale modelling in computational biomedicine.Brief Bioinform.20101114215220028713
- MacaulayIC.VoetT.Single cell genomics: advances and future perspectives.PLoS Genet.201410e100412624497842
- LovettM.The applications of single-cell genomics.Hum Mol Genet.201322R22R2623922233
- WenZ.NguyenHN.GuoZ.et alSynaptic dysregulation in a human iPS cell model of mental disorders.Nature.201451541441825132547
- RossCA.AkimovSS.Human-induced pluripotent stem cells: potential for neurodegenerative diseases.Hum Mol Genet.201423R17R2624824217
- WellerM.PfisterSM.WickW.HegiME.ReifenbergerG.StuppR.Molecular neuro-oncology in clinical practice: a new horizon.Lancet Oncol.201314e370e37923896276
- WatsonIR.TakahashiK.FutrealPA.ChinL.Emerging patterns of somatic mutations in cancer.Nat Rev Genet.20131470371824022702
- PastinenT.Genome-wide allele-specific analysis: insights into regulatory variation.Nat Rev Genet.20101153353820567245
- MillerVM.XiaH.MarrsGL.et alAllele-specific silencing of dominant disease genes.Proc Natl Acad Sci USA.20031007195720012782788
- MedlandSE.JahanshadN.NealeBM.ThompsonPM.Whole-genome analyses of whole-brain data: working within an expanded search space.Nat Neurosci.20141779180024866045
- KarchCM.CruchagaC.GoateAM.Alzheimer's disease genetics: from the bench to the clinic.Neuron.201483112624991952
- McCarrollSA.FengG.HymanSE.Genome-scale neurogenetics: methodology and meaning.Nat Neurosci.20141775676324866041
- GrattenJ.WrayNR.KellerMC.VisscherPM.Large-scale genomics unveils the genetic architecture of psychiatric disorders.Nat Neurosci.20141778279024866044
- AlivisatosPA.ChunM.ChurchGM.et alThe Brain Activity Map Project and the challenge of functional connectomics.Neuron.20127497097422726828