
Abstract
Background
Abnormal lung function is commonly identified by comparing observed spirometric values to corresponding reference values. It is recommended that such reference values for spirometry are evaluated and updated frequently. The aim of this study was to estimate new reference values for Swedish adults by fitting a multivariable regression model to a healthy non-smoking general population sample from northern Sweden. Further aims were to evaluate the external validity of the obtained reference values on a contemporary sample from south-western Sweden, and to compare them to the Global Lung Function Initiative (GLI) reference values.
Method
Sex-specific multivariable linear regression models were fitted to the spirometric data of n=501 healthy non-smoking adults aged 22–91 years, with age and height as predictors. The models were extended to allow the scatter around the outcome variable to depend on age, and age-dependent spline functions were incorporated into the models to provide a smooth fit over the entire age range. Mean values and lower limits of normal, defined as the lower 5th percentiles, were derived.
Result
This modelling approach resulted in unbiased estimates of the spirometric outcomes, and the obtained estimates were appropriate not only for the northern Sweden sample but also for the south-western Sweden sample. On average, the GLI reference values for forced expiratory volume in one second (FEV1) and, in particular, forced expiratory vital capacity (FVC) were lower than both the observed values and the new reference values, but higher for the FEV1/FVC ratio.
Conclusion
The evaluation based on the sample of healthy non-smokers from northern Sweden show that the Obstructive Lung Disease in Northern Sweden reference values are valid. Furthermore, the evaluation based on the south-western Sweden sample indicates a high external validity. The comparison with GLI brought further evidence to the consensus that, when available, appropriate local population-specific reference values may be preferred.
Dynamic spirometry is an important tool for the assessment of lung function in daily clinical practice. Abnormal lung function is identified by comparing an observed value with a reference value. There are a large number of published reference values for spirometry available (Citation1–Citation14). The Global Lung Function Initiative (GLI), an European Respiratory Society (ERS) task force, presented new multi-ethnic reference values for spirometry in 2012 (Citation10), which currently are endorsed by several respiratory societies such as the ERS and the American Thoracic Society (ATS) (Citation10, Citation15). However, it has recently been shown that the GLI reference values may not be appropriate in all countries (Citation16–Citation20).
It is essential that the sample from which the reference values are derived is representative for the contemporary healthy non-smoking population. The age range and other anthropometric, ethnic, environmental, and socio-economic factors must be considered, since such factors can affect lung function (Citation21). In addition, the spirometric measurements should be performed in line with recommended guidelines (Citation22–Citation25). It is also important that reference values for spirometry are evaluated and updated continuously (Citation22, Citation24, Citation25).
Linear regression models have commonly been used to model lung function. In most models, the predictors are sex, age, and height, but sometimes also weight and ethnicity (Citation1–Citation6, Citation9–Citation13). It has been shown that subjects of European ancestry (Caucasians) have larger lung volumes compared with subjects of other races/ethnicities (Citation22, Citation26, Citation27). Height is a proxy for chest size, and women have smaller lung volumes than men. Age is a proxy for maturity, and lung volumes increase by age during childhood and adolescence followed by a plateau with a subsequent decrease, with a starting point some years post adolescence (Citation3, Citation10, Citation23). In general, there is a high variability in the lung function development in elderly subjects and the age dependence in later stages of life is less studied (Citation24).
Recently, progress has been made in the area of modelling lung function and the Lambda-Mu-Sigma (LMS) method imbedded in the generalised additive models for location, scale and shape (GAMLSS) models (Citation28, Citation29) is preferred by some authors (Citation12, Citation30). This method was used to derive the GLI reference values (Citation10, Citation31). Beside the mean, the GAMLSS allow for skewness and kurtosis to be modelled. It is also common to use spline functions to allow both the predicted estimates and the standard deviation (SD) to vary non-linearly as functions of an explanatory variable (Citation9, Citation10, Citation12, Citation30). Previous studies have shown that not only the predicted mean but also the SD vary with age, especially when including ages from childhood to adulthood (Citation10, Citation31), while a large but somewhat older study indicated constant variance for adults (Citation32).
The aim of this study was to estimate new up-to-date reference values for spirometry for adults of European ancestry by fitting a multivariable regression model to data from Caucasian healthy non-smokers sampled from the general population of northern Sweden. Further aims were to evaluate the external validity of the new reference values on contemporary data of healthy non-smokers from south-western Sweden and to compare them with the GLI reference values.
Material and method
The northern Sweden reference sample
As a part of the Obstructive Lung Disease in Northern Sweden (OLIN) studies, 1,016 randomly selected respondents from a large postal questionnaire survey in 2006 (Citation33) were invited to clinical examinations in 2008–2009. Of them, 737 subjects (72.5%) aged 21–86 years participated in structured interviews and spirometry (Citation34). In 2011–2013, 738 additional healthy non-smokers according to the 2006 questionnaire survey were invited to identical examinations, and 448 subjects (60.6%) aged 25–91 years participated (Citation17). The study flow chart is illustrated in . Information about respiratory diseases and symptoms, other diseases, and smoking history was collected at the interview. The study was approved by the Regional Ethical Review Board at Umeå University, Sweden.
Fig. 1 Study flow chart.
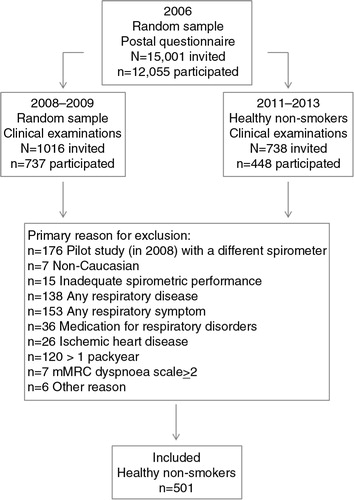
Healthy non-smokers were defined as having none of the following criteria: usually wheeze when breathing; sputum production most days in periods of 3 months per year; ever have had asthma; been diagnosed as having asthma, chronic bronchitis, COPD or emphysema by a physician; ever use of asthma medication regularly or when needed; ever use of medication for chronic bronchitis, COPD, or emphysema; ever had ischemic heart disease; wheeze in past 12 months with concurrent breathlessness; wheeze in past 12 months without having a cold; wheeze in the past 12 months most days per week; any other disability that could affect the lung capacity; or mMRC dyspnoea scale≥2. A further exclusion criterion was a cumulative life-long smoking history of>1 pack year.
The age was calculated by one decimal point as the difference between date of birth and date of examination. Date of birth was collected from the Swedish national registry. Height was measured without shoes with an accurate stadiometer with 0.5 cm precision. Weight was measured with 0.5 kg precision with empty pockets without jacket and shoes. Caucasian ethnicity was defined as a subject of European ancestry. Two Jaeger Masterscope spirometers (JLAB version 5.21 software, CareFusion, Würzburg, Germany) were used to measure forced expiratory volume in one second (FEV1), forced expiratory vital capacity (FVC), and slow expiratory vital capacity (SVC). The procedure followed the ATS/ERS recommendations (Citation35) but with a reproducibility criterion of≤5% instead of≤150 ml deviation from the second highest value. The same highly experienced, trained, and qualified research nurses performed the measurements throughout the study. The spirometers were calibrated every morning. The highest value for FEV1, FVC, and SVC was recorded for each subject and at least three up to a maximum of eight measurements were performed to fulfil the reproducibility criterion. The mean (median) absolute differences between the highest and the second highest values were: 38 ml (27 ml) for women and 59 ml (45 ml) for men in FEV1, and 53 ml (44 ml) for women and 69 ml (54 ml) for men in FVC. In total, 2.8% of the FEV1 measurements and 6.1% of the FVC measurements deviated>150 ml. Vital capacity (VC) was defined as the highest value of FVC and SVC. In total, 501 subjects, 49% women, were identified as healthy non-smoking subjects of European ancestry with adequate spirometry quality. Further details regarding the measurements of lung function can be found in the Appendix.
Derivation of the OLIN reference values based on the northern Sweden reference sample
Normal Q–Q plots were used to evaluate and confirm normal distribution of the spirometric indices FEV1, FVC, SVC, VC, the FEV1/FVC ratio and the FEV1/VC ratio, and linear regression was used to model each outcome measure. Sex-specific multivariable linear regression models were estimated for each of the spirometric indices, with age and height as independent variables. The relationships with weight were also investigated, but as model improvements were absent or negligible, weight was omitted to keep the models parsimonious. Age-dependent spline functions were incorporated in each model to allow the outcome variable to vary smoothly over the age range. A common assumption of multivariable linear regression is that the SD around the regression function is constant (homogeneous variance). This assumption was extended to include the case when the SD is a linear function of one of the regression variables (an explanatory variable), in this case age. Further details of the statistical modelling are described in the Appendix.
Model accuracy check
Z-scores (standardised residuals) and percentiles were calculated for each subject. If the observed value has a perfect normal distribution with mean and SD equal to the mean and SD of the reference values, then mean and SD of the percentile point will be 0.50 and 0.2887, respectively. Equivalently, the mean and SD of the Z-score will be 0 and 1, respectively. These facts were used to statistically test the accuracy of the estimations. A p≥0.05 implies good model accuracy. In addition, possible relationships between Z-scores and age, height, weight, and sex were examined by ordinary linear regression models, with significant associations presented as Beta-coefficients. If the reference values are in perfect agreement with the observed values, no such relationship will exist.
The south-western Sweden sample
To evaluate the external validity of the OLIN reference values, they were also applied to spirometry data of a general population sample from another region in Sweden. In 2009–2012, clinical examinations were performed on a sample aged 17–78 years from the Swedish region of West Gothia (Citation36). The examinations included dynamic spirometry also using a Jaeger Masterscope spirometer (JLAB version 5.03 software, CareFusion) and a structured interview with the same questions as in the interview for the northern Sweden sample. In total, 2,000 subjects were invited to participate in the clinical examinations, of which 1,172 (59%) participated. The study was approved by the Regional Ethical Review Board at the University of Gothenburg. From the participants, 358 healthy non-smoking subjects of European ancestry ≥22 years of age, 54% women, were identified using the same eligibility criteria for healthy non-smokers as in the northern Sweden reference sample. Percent of predicted, Z-scores (standardised residuals) and percentiles based on the OLIN reference values were calculated for each subject.
Comparison with the GLI reference values
The predicted sex- and age-specific FEV1, FVC and FEV1/FVC ratio (meanOLIN and LLNOLIN) was compared to predictions by the GLI reference values (meanGLI and LLNGLI). The comparisons are displayed in graphs, for a male of 180 cm and a female of 165 cm, which are approximately the sex-specific average heights in Sweden.
Results
Equations for the OLIN reference values for spirometry
As a result of the modelling technique, the SD, reference value (mean), and lower limit of normal (LLN, defined as the lower 5th percentile) for each of the spirometric indices are calculated by the following formulas:
SD: A+B*age
Mean: (B(J)*X(J))*SD
LLN: Mean −1.645*SD
where possible values for J ranges from 1–5, age is expressed in years, and the coefficients A, B, B1-5 and the variables X1-5 are found in . Calculation examples are illustrated in the Appendix.
Table 1 Equation coefficients for the OLIN reference values for spirometry
The mean ages for the 244 women and 257 men in the reference sample from northern Sweden were 49.2 (range 22–91) and 46.6 (range 22–86) years, respectively. The mean height was 163.3 cm (range 139.0–181.0) for women and 178.9 cm (range 162.5–198.0) for men, and the mean weight was 68.2 kg (range 45.0–118.0) for women and 84.8 kg (range 56.0–148.0) for men. These are the ranges of age, height, and weight in which the equations for the OLIN reference values are valid.
Model accuracy check based on the northern Sweden reference sample
Mean observed and predicted values, observed values as percent of predicted values, Z-scores and percentiles for the reference sample (n=501) are shown in , stratified by sex and three age groups. The mean observed values and predicted values were close to identical, which yielded mean percent of predicted close to 100%. Correspondingly, the mean Z-scores were approximately 0 with SDs close to 1, and mean percentile points are approximately 0.5 with SDs close to 0.288. Statistical testing revealed that the models for all spirometric indices were concordant with the observed values. These results were equivalent across all age groups and for both sexes. No significant associations between the Z-scores and sex, age, height or weight were found.
Table 2 Evaluation of the OLIN reference values on the northern Sweden reference sample
Applying the OLIN reference values to the south-western Sweden sample
The OLIN reference values were applied to the south-western Sweden sample, and percent of predicted, Z-scores and percentiles were calculated for each subject. The mean percent of predicted was close to 100% and mean absolute values of the Z-scores are approximately≤0.4, corresponding to approximately≤3% of predicted, for all spirometric indices in both age groups and for both sexes in the south-western Sweden sample (n=358). However, statistical testing revealed that the model fit was not perfect for some of the spirometric indices, especially among women (). Also, small but statistically significant associations between the Z-scores and sex were found for FEV1, SVC, and VC such that women on average had higher Z-scores than men when corrected for age and height (B-coefficients between 0.331 and 0.453). When also corrected for weight, the association between the Z-scores for FVC and FEV1/FVC reached statistical significance for female sex (B-coefficients of 0.330 and 0.177, respectively). No other statistically significant associations between the Z-scores and age, height, or weight were found when weight was included, except for the Z-score for FVC where height measured in cm yielded a B-coefficient of 0.018 with p-value 0.049.
Table 3 Evaluation of the OLIN reference values on the south-western Sweden sample
Comparison with GLI
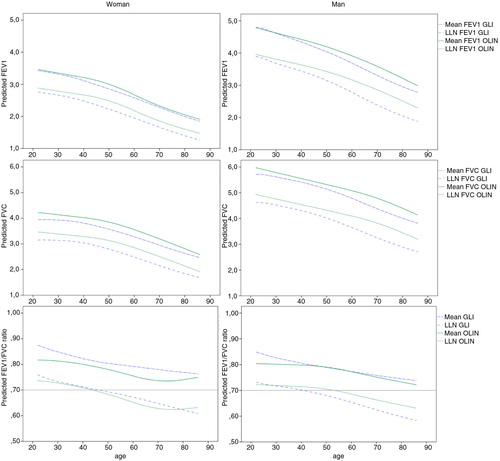
The predicted meanGLI for FEV1 in the northern Sweden reference sample was on average 67 ml lower (p<0.001) than the predicted meanOLIN for women and 103 ml lower (p<0.001) than the predicted meanOLIN for men. For FVC, the predicted meanGLI was on average 203 ml lower for women (p<0.001) and 190 ml lower for men (p<0.001). The average predicted meanGLI for the FEV1/FVC ratio was 0.028 units higher (p<0.001) for women and 0.011 units higher for men (p<0.001).
To make further comparisons to the GLI reference values, the predicted reference values of FEV1, FVC and the FEV1/FVC ratio (mean and LLN) for a woman and man of average height are plotted by age in a–f. The comparisons showed that for a man of average height, meanGLI for both FEV1 and, in particular, for FVC, were lower than meanOLIN across the ages 22–86 years. For a woman of average height, meanOLIN and meanGLI for FEV1 were similar, but meanGLI FVC is constantly lower than meanOLIN FVC. Consequently, the meanGLI FEV1/FVC ratio was also consistently lower than the meanOLIN for the woman. For a woman of average height, the LLNGLI and LLNOLIN for the FEV1/FVC ratio was well in concordance throughout the age span, but less so for FEV1 and FVC where LLNGLI was consistently lower than LLNOLIN. The pattern was somewhat different for the average height man, where the gap between LLNGLI and LLNOLIN increased with increasing age for all three spirometric indices. LLNGLI for the FEV1/FVC ratio reached below 0.7 at the age between 46 and 47 years for a woman of average height and at the age 39–40 years for a man of average height. The corresponding ages when LLNOLIN reached below 0.7 for the FEV1/FVC ratio are 43–44 years for the woman and 53–54 years for the man. Both the LLNGLI and LLNOLIN for FEV1/FVC reached below 0.7 in earlier stages in life for taller subjects compared to for shorter subjects of both sexes.
Fig. 2 (a–f) Sex- and age-dependent decline in the OLIN reference values (mean and LLN) in comparison with GLI. The predicted mean and LLN for the OLIN and the GLI reference values are plotted against age, for FEV1, FVC and the FEV1/FVC ratio, respectively. Figures (a), (b) and (c) display predicted values for a 165 cm tall woman, while (d), (e) and (f) display predicted values for a 180 cm tall man.
Discussion
The modelling approach in this study produced unbiased estimates of mean observed values in the reference sample from northern Sweden. The approach to model lung function by linear regression is a powerful technique, which we successfully extended to let the SD depend on age. In general, the GLI reference values for FEV1 and FVC were lower than the corresponding values in our sample, but higher for the FEV1/FVC ratio. In addition, the SD for the GLI reference values was larger for all spirometric indices, which can impact the LLN. Furthermore, the results indicate a high external validity for Swedish conditions, when evaluated on the sample from south-western Sweden.
Historically, multivariable linear regression has commonly been used to model spirometric outcomes since it is robust and straight-forward. However, linear regression assumes that the outcome variable is normally distributed; an assumption not always true for all spirometric indices (Citation3, Citation10). In addition, traditional multivariable linear regression modelling does not incorporate the dependence that exists between the dispersion around the spirometric outcome and age (Citation10, Citation25), that is, one of the independent or explanatory variables. In this study however, we found all spirometric outcomes to be reasonably normally distributed. A new approach to model spirometric outcomes by linear regression is presented, where the sex-specific spirometric outcomes are predicted by age and height, and where the SD also is allowed to linearly depend on age. Because of the strengths of linear regression modelling mentioned above, this approach presents a useful technique which can be used to model lung function in an efficient way.
It is essential that reference values are evaluated and updated frequently in order to confirm that the classifications of normal and abnormal reflects the realities of the contemporary general population (Citation22, Citation24, Citation25). It has recently been shown that the GLI reference values may not be appropriate for all countries (Citation16–Citation20). The comparison between these new Swedish reference values, that is, the OLIN reference values, and the GLI reference values show that, on average, both the predicted mean values and LLN for FEV1, FVC and FEV1/FVC for a woman and man of average height differ across the entire life span with differences generally more pronounced in older ages. Despite recent debate of its appropriateness (Citation37), classification of airway and lung disease severity often relies on FEV1 and FVC expressed as percent of the predicted value (Citation38). Also, since the LLN for the FEV1/FVC ratio is used as a key element for the diagnosis of airway obstruction, the use of GLI may lead to invalid diagnosis of airway obstruction along with erroneous classification of airway and lung disease severity in the Swedish population (Citation17).
A prominent advantage of the GLI reference values is that they cover an extensive age span and different ethnicities, and thus provide estimates without junction points. The GLI reference values for Caucasians are based on collated data from>57,000 subjects, and estimations based on such an extensive amount of data are likely to be valid. Undoubtedly, the GLI is an extremely valuable contribution to the field of lung function reference values, and provide the opportunity to compare a subject or a population to the world-wide average within each ethnicity which is of substantial value for, for example, international multi-centre studies. Quanjer et al. (Citation39) has previously shown that the GLI SDs are expected to be larger compared to SDs derived from smaller populations due to the large number of data subsets included in the estimation of GLI, an expectation which is confirmed in our sample (Citation17). Quanjer et al. argue that although the LLN according to GLI will identify a somewhat larger proportion of subjects as below LLN in smaller populations compared to in larger populations, this will not lead to any bias since the smaller populations merely are subsets of the population at large. However, we argue that since there are considerable differences in, for example, environmental pollution, occupational exposures and socio-economic factors which can affect lung function between regions (Citation21), bias can indeed be introduced and observed differences should not be neglected. In addition, although the GLI reference values currently are recommended by many respiratory societies, the consensus is still that, when available, appropriate and applicable local population-specific reference values may be preferred (Citation22, Citation23, Citation25). This consensus is confirmed in our study.
An advantage of our study is that, along with FEV1 and FVC, reference values are provided also for SVC and for the highest value of the forced and slow VC, that is, the VC. Although the FVC is a recognised proxy for the VC, additional information of the lung function can be obtained by measuring the SVC, especially in subjects where FVC is reduced by air-trapping due to small-airways obstruction, for example, at early stages of COPD. For example, it is common practice that the FEV1/VC ratio is relied on when diagnosing obstruction and the GOLD criteria for the diagnosis of COPD recognise this alternative to the FEV1/FVC ratio (Citation38), but hitherto few recently published studies provide reference values (and LLN) also for SVC and VC. A weakness of our study is that the age range does not cover children or adults younger than 22 years, that sitting height was not recorded although it has been argued to be a better predictor than standing height (Citation20, Citation26) and that the geographical coverage was limited to northern Sweden. The small but still observable differences in lung function between the samples from northern and south-western Sweden could possibly be due to minor technical or procedural differences, which are not uncommon (Citation39), while substantial biological differences are more unlikely.
Two spirometers, instead of only one, were used for the northern Sweden sample. However, they were of identical brand and model which limits the possible bias. The spirometers were calibrated on a daily basis, but the syringes were not sent for yearly calibration according to the ERS/ATS recommendations and there is a lack of calibration traceability. Further, future studies would most likely benefit from European Spirometry Driving Licenses for the staff and deep insight in previous study protocols such as the NHANES (Citation40, Citation41). However, all measurements in this study were performed by the same three well-trained research nurses with an extensive experience. Also, seasonal variation effects on lung function are avoided due to the random sampling over several years, regardless of season.
The random sample size of 501 subjects is greater than the sample sizes in commonly used Swedish reference values (Citation1, Citation4, Citation5) and suffices to produce valid estimates, results in line with previous studies (Citation39). It is possible that our eligibility criteria are too strict and consequently exclude too many subjects, particularly among the elderly. However, obstructive lung diseases, smoking history, breathlessness, cough and wheeze have been shown to be feasible exclusion criteria to define healthy non-smokers in reference populations for spirometry (Citation25, Citation42). Since the same structured interview questions were used in northern and south-western Sweden, these criteria could be applied identically for both samples. The reference sample from northern Sweden constitutes a representative sample of the general healthy non-smoking population of the area. Thus, bias introduced by including smokers (Citation1, Citation4, Citation5) or by using selected samples such as workers from specific industries (Citation13) or respiratory healthy patients from certain hospitals is avoided. The evaluation of the reference values in the south-western Sweden sample yielded mean Z-scores close to 0 and Z-score SDs close to 1, with corresponding mean percent of predicted close to 100%, for all six different spirometric parameters. Although statistical differences were observed for some of the spirometric parameters, the evaluations reveal a high external validity.
To summarise, the evaluation of the OLIN reference values based on the reference sample of healthy non-smokers from northern Sweden show that the models are valid. Further, the evaluation based on the healthy non-smokers from south-western Sweden indicates a high external validity of the model. The comparison with GLI brought further evidence to the consensus that, when available, appropriate local population-specific reference values may be preferred.
Conflict of interest and funding
The authors have no conflicts of interest to disclose. The study was funded by The Swedish Heart–Lung Foundation, The Swedish Asthma-Allergy Foundation, Visare Norr and Norrbotten County Council.
Acknowledgements
We thank the OLIN-staff Sigrid Sundberg, Ann-Christine Jonsson and Britt-Marie Eklund for excellent data collection. Financial support was received from The Swedish Heart & Lung Foundation, The Swedish Research Council, Umeå University, the Swedish Asthma-Allergy Foundation and Visare Norr.
Related Research Data
References
- Berglund E, Birath G, Bjure J, Grimby G, Kjellmer I, Sandqvist L. Spirometric studies in normal subjects. I. Forced expirograms in subjects between 7 and 70 years of age. Acta Med Scand. 1963; 173: 185–92.
- Gulsvik A, Tosteson T, Bakke P, Humerfelt S, Weiss ST, Speizer FE. Expiratory and inspiratory forced vital capacity and one-second forced volume in asymptomatic never-smokers in Norway. Clin Physiol. 2001; 21: 648–60.
- Hankinson JL, Odencrantz JR, Fedan KB. Spirometric reference values from a sample of the general U.S. population. Am J Respir Crit Care Med. 1999; 159: 179–87.
- Hedenstrom H, Malmberg P, Agarwal K. Reference values for lung function tests in females. Regression equations with smoking variables. Bull Eur Physiopathol Respir. 1985; 21: 551–7.
- Hedenstrom H, Malmberg P, Fridriksson HV. Reference values for lung function tests in men: regression equations with smoking variables. Ups J Med Sci. 1986; 91: 299–310.
- Langhammer A, Johnsen R, Gulsvik A, Holmen TL, Bjermer L. Forced spirometry reference values for Norwegian adults: the Bronchial Obstruction in Nord-Trondelag Study. Eur Respir J. 2001; 18: 770–9.
- Miller A, Thornton JC, Warshaw R, Bernstein J, Selikoff IJ, Teirstein AS. Mean and instantaneous expiratory flows, FVC and FEV1: prediction equations from a probability sample of Michigan, a large industrial state. Bull Eur Physiopathol Respir. 1986; 22: 589–97.
- Paoletti P, Pistelli G, Fazzi P, Viegi G, Di Pede F, Giuliano G. Reference values for vital capacity and flow-volume curves from a general population study. Bull Eur Physiopathol Respir. 1986; 22: 451–9.
- Quanjer PH, Tammeling GJ, Cotes JE, Pedersen OF, Peslin R, Yernault JC. Lung volumes and forced ventilatory flows. Report Working Party Standardization of Lung Function Tests, European Community for Steel and Coal. Official Statement of the European Respiratory Society. Eur Respir J Suppl. 1993; 16: 5–40.
- Quanjer PH, Stanojevic S, Cole TJ, Baur X, Hall GL, Culver BH. Multi-ethnic reference values for spirometry for the 3–95-yr age range: the global lung function 2012 equations. Eur Respir J. 2012; 40: 1324–43.
- Roberts CM, MacRae KD, Winning AJ, Adams L, Seed WA. Reference values and prediction equations for normal lung function in a non-smoking white urban population. Thorax. 1991; 46: 643–50.
- Stanojevic S, Wade A, Stocks J, Hankinson J, Coates AL, Pan H. Reference ranges for spirometry across all ages: a new approach. Am J Respir Crit Care Med. 2008; 177: 253–60.
- Viljanen AA, Halttunen PK, Kreus KE, Viljanen BC. Spirometric studies in non-smoking, healthy adults. Scand J Clin Lab Invest Suppl. 1982; 159: 5–20.
- Sovijärvi AR, Pajunen J, Turjanmaa V, Uusitalo A. Reference values of regional ventilation, lung volumes and perfusion assessed by using an automated multidetector 133-Xe radiospirometer. Ann Clin Res. 1986; 18: 160–6.
- Quanjer PH, Brazzale DJ, Boros PW, Pretto JJ. Implications of adopting the Global Lungs 2012 all-age reference equations for spirometry. Eur Respir J. 2013; 42: 1046–54.
- Ben Saad H, El Attar MN, Hadj Mabrouk K, Ben Abdelaziz A, Abdelghani A, Bousarssar M. The recent multi-ethnic global lung initiative 2012 (GLI2012) reference values don't reflect contemporary adult's North African spirometry. Respir Med. 2013; 107: 2000–8.
- Backman H, Lindberg A, Sovijarvi A, Larsson K, Lundback B, Ronmark E. Evaluation of the global lung function initiative 2012 reference values for spirometry in a Swedish population sample. BMC Pulm Med. 2015; 15: 26.
- Kainu A, Timonen KL, Toikka J, Qaiser B, Pitkaniemi J, Kotaniemi JT. Reference values of spirometry for Finnish adults. Clin Physiol Funct Imaging. 2015. Mar 27. [Epub ahead of print] doi: 10.1111/cpf.12237..
- Kubota M, Kobayashi H, Quanjer PH, Omori H, Tatsumi K, Kanazawa M. Reference values for spirometry, including vital capacity, in Japanese adults calculated with the LMS method and compared with previous values. Respir Investig. 2014; 52: 242–50.
- Quanjer PH, Kubota M, Kobayashi H, Omori H, Tatsumi K, Kanazawa M. Secular changes in relative leg length confound height-based spirometric reference values. Chest. 2015; 147: 792–7.
- Duong M, Islam S, Rangarajan S, Teo K, O'Byrne PM, Schunemann HJ. Global differences in lung function by region (PURE): an international, community-based prospective study. Lancet Respir Med. 2013; 1: 599–609.
- Pellegrino R, Viegi G, Brusasco V, Crapo RO, Burgos F, Casaburi R. Interpretative strategies for lung function tests. Eur Respir J. 2005; 26: 948–68.
- Stanojevic S, Wade A, Stocks J. Reference values for lung function: past, present and future. Eur Respir J. 2010; 36: 12–9.
- Bellia V, Antonelli Incalzi R. European Respiratory Monograph; Respiratory diseases in the elderly. 2009; 43rd ed, European Respiratory Society. Available from: http://erspublications.com/content/9781904097778/9781904097778..
- Lung function testing: selection of reference values and interpretative strategies. American Thoracic Society. Am Rev Respir Dis. 1991; 144: 1202–18.
- Quanjer PH. Lung function, race and ethnicity: a conundrum. Eur Respir J. 2013; 41: 1249–51.
- Braun L, Wolfgang M, Dickersin K. Defining race/ethnicity and explaining difference in research studies on lung function. Eur Respir J. 2013; 41: 1362–70.
- Cole TJ, Green PJ. Smoothing reference centile curves: the LMS method and penalized likelihood. Stat Med. 1992; 11: 1305–19.
- Rigby RA, Stasinopoulos DM. Generalized additive models for location, scale and shape. Appl Statist. 2005; 54(Pt 3): 507–54.
- Vaz Fragoso CA, Concato J, McAvay G, Van Ness PH, Rochester CL, Yaggi HK. The ratio of FEV1 to FVC as a basis for establishing chronic obstructive pulmonary disease. Am J Respir Crit Care Med. 2010; 181: 446–51.
- Cole TJ, Stanojevic S, Stocks J, Coates AL, Hankinson JL, Wade AM. Age- and size-related reference ranges: a case study of spirometry through childhood and adulthood. Stat Med. 2009; 28: 880–98.
- Knudson RJ, Lebowitz MD, Holberg CJ, Burrows B. Changes in the normal maximal expiratory flow-volume curve with growth and aging. Am Rev Respir Dis. 1983; 127: 725–34.
- Backman H, Hedman L, Jansson SA, Lindberg A, Lundback B, Ronmark E. Prevalence trends in respiratory symptoms and asthma in relation to smoking – two cross-sectional studies ten years apart among adults in northern Sweden. World Allergy Organ J. 2014; 7: 1.
- Warm K, Lindberg A, Lundback B, Ronmark E. Increase in sensitization to common airborne allergens among adults – two population-based studies 15 years apart. Allergy Asthma Clin Immunol. 2013; 9: 20.
- Miller MR, Hankinson J, Brusasco V, Burgos F, Casaburi R, Coates A. Standardisation of spirometry. Eur Respir J. 2005; 26: 319–38.
- Ekerljung L, Bjerg A, Bossios A, Axelsson M, Toren K, Wennergren G. Five-fold increase in use of inhaled corticosteroids over 18 years in the general adult population in west Sweden. Respir Med. 2014; 108: 685–93.
- Quanjer PH, Pretto JJ, Brazzale DJ, Boros PW. Grading the severity of airways obstruction: new wine in new bottles. Eur Respir J. 2014; 43: 505–12.
- Global Strategy for the diagnosis, management and prevention of chronic obstructive pulmonary disease (Updated 2014). Global Initiative for Chronic Obstructive Lung Disease. 2014. Available from: http://www.goldcopd.org/guidelines-global-strategy-for-diagnosis-management.html [cited 3 March 2014]..
- Quanjer PH, Stocks J, Cole TJ, Hall GL, Stanojevic S. Global Lungs Initiative. Influence of secular trends and sample size on reference equations for lung function tests. Eur Respir J. 2011; 37: 658–64.
- 1999–2000 National Health and Nutrition Examination Survey (NHANES). Survey Operations Manuals, Brochures, Consent Documents. Body measurements. 2014. Available from: http://www.cdc.gov/nchs/nhanes/nhanes1999-2000/brochures99_00.htm [cited 12 May 2015]..
- National Health and Nutrition Examination Survey (NHANES). Respiratory health. spirometry procedures manual. 2008. Available from: http://www.cdc.gov/nchs/data/nhanes/nhanes_07_08/spirometry.pdf [cited 12 May 2015]..
- Johannessen A, Omenaas ER, Eide GE, Bakke PS, Gulsvik A. Feasible and simple exclusion criteria for pulmonary reference populations. Thorax. 2007; 62: 792–8.
Appendix
Sex-specific normal Q–Q plots of observed values for the six spirometric indices in the northern Sweden reference sample

Details of the statistical modelling
For each individual we consider a vector x of independent variables and x is a component of the vector. The SD σ(x) is assumed to be
where a and b are parameters to be estimated together with a set of parameters describing the mean µ of the dependent variable as a function of the components of the vector x. The log-likelihood function is a sum of terms1
The mean µ(x) does not need to be linear as a function of the components of x, but the mean has to be linear as a function of the parameters.
The variable Y/σ(x) has a normal distribution and the regression is homogeneous. By use of an iterative procedure, where a provisional function approximating σ(x) is used, the parameters of µ(x) are approximately solved. Given the provisional parameters of µ(x), new values of a and b approximating σ(x) will be found by solving a linear system of equations (two equations). The system of equations is found by derivation of the log-likelihood function, putting the derivatives equal to zero and making Taylor expansions (linearize) of the equations. New provisional values of a and b are then obtained and Y/σ(x) is again approximately calculated, etc. Finally, repeated solutions of all the parameters give the same results. An efficient way of presenting (writing) the derivatives of the log-likelihood function simplifies programming and procedure checking.
The derivative of (Citation1) with respect to a, here denoted FA1, is
The second derivative d2/da2 denoted FA2, which we need for the Taylor expansion, is
and d2/dadb, which we denote FAB, is
The derivative of (1) with respect to b, denoted FB1, is
The second derivative d2/db2, denoted FB2, is
The derivative d2/dbda, denoted FBA, equals d2/dadb, denoted FAB, which is given above. Thus
Further evaluation of the statistical models
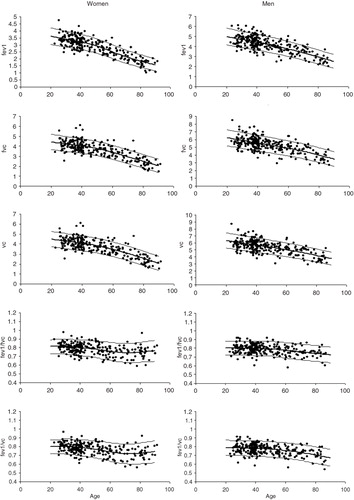
Predicted values based on mean heights for the n=501 subjects in the reference sample are plotted against age in the graphs below in order to further evaluate that the sample size is sufficient and that the models are valid. Height is predicted by sex and age in these graphs. Mean±1.645*sd for each of the spirometric indices are presented.
Details regarding measurements of lung function
Age was calculated with one decimal point by subtracting the date of birth from the examination date. Date of birth was collected from the Swedish national registry.
Measurements of stature (height) were carried out by stadiometers available at the different healthcare centres in the county of Norrbotten where the clinical examinations took place. All measurements were recorded with the head positioned in ‘the Frankfurt plane’ with 0.5 centimetre intervals. The measurements were performed without shoes on but all subjects were allowed to keep their in-door socks on during measurements.
The barometric pressure was collected from the SMHI (the Swedish Meteorological and Hydrological Institute) website which publishes the current barometric pressure for most towns in Norrbotten County on a daily basis www.smhi.se/vadret/vadret-i-sverige/observationer#. Room temperature was measured with a thermometer by the examining nurse at the time of calibration. The assumed temperature in the pneumotach during expiration was 37 degrees Celsius.
All equipment including the two calibration syringes used in this study were newly purchased, serviced and calibrated at study start. The service providers offered support during the study. The syringe was placed on a table during calibration; no ‘hands on’ was applied. The calibration was performed with both the elbow connection and the filter attached. The three flow protocol was applied at study start and at study stop and the results showed no deviance from linearity. The Masterscreens warnings of insufficient forced expiration were enabled. The Lilly screen was ocularly inspected and cleansed according to the recommendations on a daily basis and replaced when necessary. A nose clip was applied during spirometry.
The following filter was used throughout the study:
CareFusion V-892380 MicroGard® IIB, bacteria/viral filter
With both inspiratory and expiratory resistance:
The research staff served as biological controls continuously during the data collection to check for inconsistencies in spirometer performance, however not in a structured form. No obvious deviations were observed.
Calculation of OLIN reference values – worked examples
The sex-specific coefficients A, B, B1, B2, B3, B4 and B5 for each of the different spirometric indices are found in in the main manuscript.
The formula for calculation of the predicted mean value is as follows:
where J ranges from 1 to 5 and SD is calculated as A+B* age)
This can be expressed as follows:
The formula for calculation of the lower limit of normal (LLN) is as follows:
This can be expressed as follows:
Example 1 – FEV1 for a 75 year-old woman of 155 cm
First, X1, X2, X3, X4 and X5 must be calculated:
For FEV1, the coefficients A, B, B1, B2, B3, B4 and B5 are:
Mean predicted FEV1 and LLN for FEV1 is calculated as follows:
Example 2 – FEV1 for a 45 year-old man of 185 cm
First, X1, X2, X3, X4 and X5 need to be calculated:
For FEV1, the coefficients A, B, B1, B2, B3, B4 and B5 are:
Mean predicted FEV1 and LLN for FEV1 is calculated as follows: