Abstract
Nutrient profiling is a highly pressing issue. However, as there are currently various nutrient profiling schemes it may be difficult to maintain an overview. We therefore developed a simple visual model where the various choices that can be made are indicated. This allows for easy comparison of existing schemes. The model is available in PowerPoint format and attached as a separate file to this paper (see Supplementary files under Reading Tools online).
Nutrient profiling has been defined as “the science of categorizing foods according to their nutritional composition” Citation1Citation2 and “categorization of foods for specific purposes on basis of their nutrient composition according to scientific principles” Citation3. Nutrient profiling is a highly topical issue as there are many areas in which nutrient profiling plays a crucial role. Although it is generally agreed that as such, there are no ‘good’ or ‘bad’ foods, and that the ‘overall’ mean nutritional quality of the daily diet, and a balanced food consumption pattern, are the more important determinants of nutritional health, a ‘healthy’ diet requires an informed and healthy food choice by the consumer. As such, ‘healthy eating’ logos or symbols on the food package can be viewed as potential tools to assist consumers in making ‘the healthy choice the easy choice’. Adoption of nutrient profiles might also stimulate the food industry to develop products with an improved nutritional composition.
Some national nutrition authorities, ie from Sweden, The Netherlands, UK, and the USA, and charities and food companies have established voluntary/private systems for nutrient profiling as a basis for consumer education, and/or for product labeling using graphic or symbolic representations to help the consumer identify ‘healthier’ food products (food choices) at the site and moment of purchase. Nutrient profiling schemes have been developed and are applied in various countries for different purposes:
As part of a regulatory system to restrict foods to which nutrients may be added, and/or from making claims, e.g. USA Citation4Citation5, Australia/ New Zealand Citation6, and UK Citation7.
As part of a voluntary system to help consumers making a ‘healthy’ food choice, such as the 1989 Swedish Green Keyhole system Citation8, the 2005 Netherlands Nutrition Centre Tripartite classification scheme Citation9, and the 2004 UK ‘traffic light system’ Citation10.
As part of private ‘healthy eating’ logos (schemes) from charities, especially heart foundations, food companies and retail organizations for labeling their branch products, such as the ‘My choice’ logo Citation11 and the clover logo Citation12. Very recently the Confederation of the Food and Drink Industries in the EU (CIAA) launched the Guideline Daily Amount (GDA) concept as a tool in product labeling and also intended to help consumers making the healthy choice Citation13.
Hence, nutrient profiling can be done for several purposes such as: 1. the evaluation of the nutritional quality of single foods, 2. to help consumers make a ‘healthy’ food choice, 3. to regulate the promotion of foods to children, and 4. to identify food products eligible to bear a nutrition or health claim. The latter is of particular interest in Europe after the EU published its Regulation 1924/2006 on nutrition and health claims made on foods Citation14. Article 4 in that Regulation states that “By … January 2009, the Commission shall … establish specific nutrient profiles … which food or certain categories of food must comply with … in order to bear nutrition or health claims and the conditions for the use of nutrition or health claims for foods or categories of foods with respect to the nutrient profiles.” In order to set these nutrient profiles the European Commission has requested the European Food Safety Authority (EFSA) to provide relevant scientific advice Citation15. In its mandate to EFSA, the European Commission requested specific advice on: 1 whether profiles should be set for food in general and/or categories of food, 2. what should be the choice and balance of nutrients, 3. what should be the choice of reference quantity/basis, 4. what should be the approach to the calculation of profiles and 5. the feasibility and testing of a proposed system.
There are many scientific and policy aspects associated with choosing within the various nutrient profiling schemes. These will not be discussed here as there are already several recent, good and thorough reviews available in this area such as from the UK-FSA Citation1Citation2Citation16Citation17Citation18, EFSA Citation19, ILSI Citation3Citation20Citation21Citation22, BEUC Citation23, Sweden Citation24, France Citation25 and USA Citation26. In these articles/reports full descriptions of the various systems with the (dis-)qualifying criteria and nutrients can be found.
Nutrient profiling is now highly actual. There are many scientific meetings in which nutrient profiling is the major or one of the major topics, such as the ILSI workshop on nutrient profiling in April 2006 in Mallorca, Spain Citation3, the EFSA scientific colloquium on nutrition and health claims in Bologna, Italy in November 2006 Citation27, and the EFSA scientific colloquium on nutrient profiling in Parma, Italy, in October 2007 Citation28.
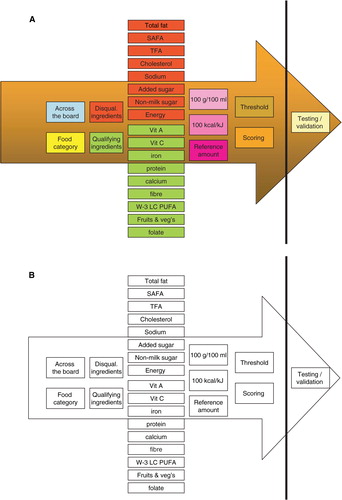
In discussing and presenting the various existing nutrient profiling schemes it is our experience that it is difficult to maintain an overview over the many systems. We therefore developed a simple visual model to illustrate the existing nutrient profiling schemes (). In this model the various choices that can be made are indicated and these are in line with the request in the EU mandate to EFSA Citation15. Choices have to be made with respect to several issues and these are not independent from one another. So in no particular order the following choices are possible, such as a choice between a system based on food categories and/or in general, i.e. ‘across the board’, a choice between qualifying and/or disqualifying ingredients, and the respective qualifying (e.g. vitamin C, fibre, iron, protein, ω-3 PUFA, fruits and vegetables, …) and disqualifying constituents (e.g. salt, sugar, saturated fat, trans fat, cholesterol, energy, … .), a choice for the reference base, which can be per 100g/100 ml, 100 kcal/100 kJ, and/or per reference quantity/serving, and a choice between a scoring system or a threshold system. When all the individual choices have been made and agreed upon by scientists and policy makers, any system of choices needs to be validated and tested.
Figure 1. A simple visual model to compare existing nutrient profiling schemes; basic figure.
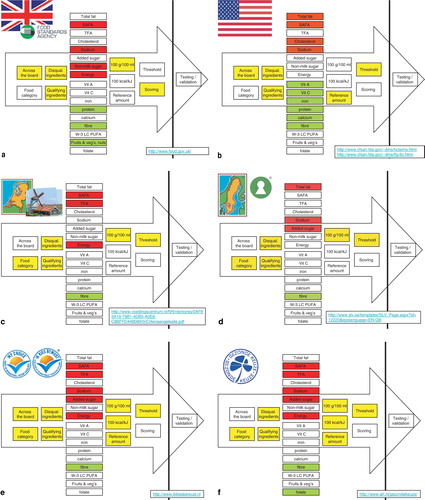
When the simple visual model is applied to the existing nutrient profiling schemes, it is immediately clear that various bodies have made different choices among the existing possibilities (). This simple model was eagerly welcomed when presented to scientific audiences such as at the recent FENS conference in July 2007, in Paris, France Citation29 and we have decided to share this simple visual model in the public domain.
Figure 2. Application of the simple visual model to compare existing nutrient profiling schemes; examples from the UK (a), USA (b), The Netherlands (c) and Sweden (d) as well as the private ‘Ik Kies Bewust’/‘Choices’ initiative (e) and the Albert Heijn/Ahold retailer's ‘clover system’ (f). Note: the Dutch system will be adapted shortly with sodium as an additional disqualifying criterion.
Upon official publication of this scheme in this journal, the PowerPoint version will be attached to this manuscript as a separate file. Moreover, we have it upon ourselves to collect more schemes for this system. As such, all bodies that have issued nutrient profiling schemes can send their version to the authors and upon checking we shall incorporate the newest versions in the PowerPoint presentation on a regular basis. It can then be used by all interested, provided that proper reference is given. It is our hope that this instrument will be helpful in providing and keeping an overview of existing nutrient profiling schemes.
A simple visual model to compare existing nutrient profiling schemes
Download MS Power Point (570.5 KB)References
- Rayner M, Scarborough P, Stockley L. Nutrient Profiles: Options for Definitions for Use in relation to Food Promotion and Children's Diets. UK Food Standards Agency 2004. http://www.food.gov.uk/multimedia/pdfs/nutrientprofilingfullreport.pdf.
- Rayner M, Scarborough P, Williams C. The origin of Guideline Daily Amounts and the Food Standards Agency's guidance on what counts as ‘a lot’ and ‘a little’. 2004; 7: 549-56
- Tetens I, Oberdörfer R, Madsen C, Vries J. Nutritional Characterisation of Foods: Science-based Approach to Nutrient Profiling. 2007; 46: Suppl 2: 4-14
- Food and Drug Administration, USA. Claims That Can Be Made for Conventional Foods and Dietary Supplements. http://www.cfsan.fda.gov/∼dms/hclaims.html
- Food and Drug Administration, USA. A Food Labeling Guide–Appendix C. http://www.cfsan.fda.gov/∼dms/flg-6c.html
- Food Standards Australia New Zealand. http://www.foodstandards.gov.au
- Food Standard Agency, United Kingdom. Nutrient profiles: Options for definitions for use in relation to food promotion and children's diets. Final report (2004). http://www.food.gov.uk/
- National Food Administration, Sweden. The Keyhole symbol. http://www.slv.se/templates/SLV_Page.aspx?id=12220&epslanguage=EN-GB
- Dutch Nutrition Centre, The Netherlands. Criteria for the nutritional evaluation of foods; the Netherlands tripartite classification model for foods. http://www.voedingscentrum.nl/NR/rdonlyres/0AF85A19-79B1-4DB5-A0E8-C8BFFD44B089/0/Criteriaengelssite.pdf
- Food Standard Agency, United Kingdom. Traffic light labelling. http://www.eatwell.gov.uk/foodlabels/trafficlights/
- Ik Kies Bewust. Gezonder kiezen doe je zo (My Choice). http://www.ikkiesbewust.nl/home.php (in Dutch only).
- Albert Heijn. Healthy Choice (Gezonde keuze). (Healthy Choice) http://www.ah.nl/gezondekeuze/ (in Dutch only).
- CIAA (Confederation of the Food and Drink Industries in the EU). All you wanted to know about GDA's. http://gda.ciaa.eu
- European Commission. Regulation (EC) No 1924/2006 of the European Parliament and of the council of 20 December 2006 on nutrition and health claims made on foods. http://eur-lex.europa.eu/LexUriServ/site/en/oj/2007/l_012/l_01220070118en00030018.pdf
- European Food Safety Authority. Request of the European Commission (EC) to the European Food Safety Authority (EFSA) for scientific advice on the setting of nutrient profiles pursuant article 4 of Regulation 1924/2006 on nutrition and health claims on foods. http://www.efsa.europa.eu/etc/medialib/efsa/science/nda/requestsmandate.Par.0002.File.dat/ToR%20on%20nutrient%20profiles_web.pdf
- Scarborough P, Boxer A, Rayner M, Stockley L. Testing nutrient profile models using data from a survey of nutrition professionals. 2007; 10: 337-45
- Scarborough P, Rayner M, Stockley L. Developing nutrient profile models: a systematic approach. 2007; 10: 330-6
- Arambepola C, Scarborough P, Rayner M. Validating a nutrient profile model. 2007; July: 1–8.
- European Food Safety Authority, Italy. Opinion on the setting of nutrient profiles for foods bearing nutrition and health claims pursuant to article 4 of Regulation 1924/2006. http://www.efsa.europa.eu/EFSA/ScientificPanels/efsa_locale-1178620753812_NDA.htm
- Garsetti M, de Vries J, Smith M, Amosse A, Rolf-Pedersen N. Nutrient profiling schemes: overview and comparative analysis. 2007; 46: Suppl 2: 15-28
- Volatier J-L, Biltoft-Jensen A, de Henauw S, Gibney M, Huybrechts I, McCarthy SN, O'Neill JL, Quinio C, Turrini A, Tetens I. A new reference method for the validation of the nutrient profiling schemes using dietary surveys. 2007; 46: Suppl 2: 29-36
- Quinio C, Biltoft-Jensen A, De Henauw S, Gibney MJ, Huybrechts I, O'Neill JL, Tetens I, Turrini A, Volatier JL. Comparison of different nutrient profiling schemes to a new reference method using dietary surveys. 2007; 46: Suppl 2: 37-46
- BEUC The European Consumers’ Organisation: Discussion Group on Simplified Labelling: Simpler labelling for healthier choices. Final Report BEUC/X/044/2006. http://www.spismest.dk/NR/rdonlyres/CA725337-D4FE-4049-952C-14274B355DBF/0/20060053201E.pdf
- Larsson I, Lissner L. The ‘green keyhole’ nutritional campaign in Sweden: do women with more knowledge have better dietary practices. 1996; 50: 323-28
- Azais-Braesco V, Goffi C, Labouze E. Nutrient profiling: comparison and critical analysis of existing systems. 2006; 9: 613-22
- Drewnowski A. What's next for nutrition labelling and health claims?. 2007; 42: 206-14
- European Food Safety Authority, Italy. EFSA conference on nutrition and health claims, November 11 2006, Bologna. Italy. http://www.efsa.europa.eu/EFSA/efsa_locale-1178620753812_1178621460354.htm
- European Food Safety Authority, Italy. Report on the EFSA scientific colloquium on nutrient profiles and EFSA's tasks in advising on nutrient profiles. October 11–12, 2007, Parma. Italy. http://www.efsa.europa.eu/EFSA/Scientific_Document/nda_report_nutrient_profiling.pdf
- 10th European Nutrition Conference, Paris, France, July 10–13, 2007. http://www.fens2007.org/