Abstract
Background: Knowledge is lacking about dietary habits among people with intellectual disability (ID) living in community residences under new living conditions.
Objective: To describe the dietary habits of individuals with ID living in community residences, focusing on intake of food, energy and nutrients as well as meal patterns.
Design: Assisted food records and physical activity records over a 3-day observation period for 32 subjects.
Results: Great variation was observed in daily energy intake (4.9–14 MJ) dispersed across several meals, with on average 26% of the energy coming from in-between-meal consumption. Main energy sources were milk products, bread, meat products, buns and cakes. The daily intake of fruit and vegetables (320±221 g) as well as dietary fiber (21±9.6 g) was generally low. For four vitamins and two minerals, 19–34% of subjects showed an intake below average requirement (AR). The physical activity level (PAL) was low for all individuals (1.4±0.1).
Conclusion: A regular meal pattern with a relatively high proportion of energy from in-between-meal eating occasions and a low intake of especially fruits were typical of this group of people with ID. However, the total intake of energy and other food items varied a great deal between individuals. Thus, every adult with ID has to be treated as an individual with specific needs. A need for more knowledge about food in general and particularly how fruit and vegetables could be included in cooking as well as encouraged to be eaten as in-between-meals seems imperative in the new living conditions for adults with ID.
1 Introduction and background
People with intellectual disabilities (ID) are a heterogeneous group; their gender, age and disabilities vary, making it difficult to pinpoint what characterizes them beyond their limited intellectual development Citation1. An ID often implies difficulties for people in dealing with the details of everyday life, e.g. because it affects their ability to sort out and arrange their experiences, which involves both their intellect and their memory Citation2. In the Western world, current policies for services for people with ID are based on ideas of normalization, inclusion and self-determination. People with ID should get the support necessary to allow them to live like other people in society and to make their own decisions to the greatest extent possible Citation3. Throughout almost the entire Western world, people with ID are being offered a life in the community instead of a life in an institution. The very last institutions for ID in Sweden were closed in 2000 Citation4Citation5.
Nowadays, people with ID in Sweden are offered two different housing alternatives: apartments in group homes or individual service apartments. Although all residents should have their own kitchen, a group home should have a common area with a kitchen where all residents can gather for common meals. The group homes are usually limited to five residents with extensive needs and have a permanent staff group with 24-hour service. Service apartments are for people who need less support. These apartments are situated in regular housing areas; most often spread out in several buildings. People who live in service apartments should also have access to a common area where they can meet other residents and staff Citation6. These new living conditions mean that people with ID can now have their own private lives, including the possibility of influencing their own food habits. They can either take care of their own menus, preparation and cooking of meals or get support with these kinds of activities from staff at the residences Citation7Citation8Citation9. It is well known that people with ID are a risk group concerning food-related diseases. Both WHO and The American Dietetic Association have pointed out the need for improvement in the organization of the food supply and the nutritional status of people with ID Citation10Citation11. In Sweden, the National Food Administration and the Swedish National Institute of Public Health have also recognized people with ID as a risk group Citation12Citation13. Studies of the nutritional status of people with ID have mostly been studies of bodyweight and have often focused on changes in the living conditions of people with ID. A longitudinal study of the dental status of people with ID in Sweden Citation8 established that 40% of 55 subjects had increased bodyweight and 13% had decreased bodyweight 5 years after moving out from an institution. Similar results on the development of bodyweight have also been found in international studies Citation7Citation14. People with severe ID tend to be underweight; occurrences of food-refusal and self-induced vomiting are often high in this group. People with mild ID tend to be more overweight Citation14Citation15. The increased risks for overweight due to these living conditions also entail increased risks for developing diet-related chronic diseases Citation10Citation11Citation14. A recent study of dietary intake among people with mild and moderate ID who live in 3 different kinds of housing in North America was conducted using screening questionnaires and interviews with subjects assisted by their care providers. Results showed low intake of fruits and vegetables and high intake of dietary fat among subject in all housing types, and the authors fear increased risks of chronic diseases among people with ID Citation16. However, comprehensive studies of the dietary habits of people with ID are lacking and the present study is the first of its kind in Sweden.
The purpose of the present study was to describe the dietary habits of individuals with ID living in community residences, focusing on intake of food, energy and nutrients as well as meal patterns.
2 Methods
The present descriptive study of dietary habits using quantitative methods was performed in parallel with a qualitative observational study about food choice and meal situations among people with ID (to be published elsewhere). Since many people with IDare illiterate, nonverbal and physically impaired Citation17 with difficulties to contribute the collection of data, the methods need to be chosen with special concern. However, these problems should not prevent doing studies about their living conditions in the same way that other peoples' living conditions are studied. Thus, in the present study, the methods were chosen and appropriately adapted to fit this heterogeneous group of subjects. The first author carefully followed each subject during almost all waking hours for a total of 3 days, which enabled her to make detailed food records as well as records of daily physical activity.
2.1 Subjects
The project was approved by the management of community residences in one of the largest towns in Sweden. The subjects were recruited in order to obtain a convenience sample. The recruitment process started in October 2003 and ended in May 2005. Residence managers alone or together with staff suggested individuals for the study. The subjects alone or together with their trustees gave their consent to participate. All individuals who agreed to take part were recruited. The research group did not know individual diagnoses. Thirty-four subjects from 20 residences were included, and 32 (14 women and 18 men) completed the study. This corresponds to 7% of all people with ID who lived in community residences in this town and less than 0.5% of all people with ID who lived in community residences in the entire country at the time of the start of the study Citation18. Subjects ranged from 26 to 66 years of age and from 16 to 48 in BMI (). All subjects had been living in community residences for several years. Twenty-three subjects lived in a group home and the other nine lived in service apartments. Subjects’ level of ID and other disabilities varied. Since the group of subjects was heterogeneous, their need for support and their own role in food-related activities greatly varied from one subject to another, even if they all had daily contact/communication with the supporting staff. Of all subjects, 5 needed support with eating. The Regional Ethics Review Board in Uppsala approved the study.
Table 1. Characteristics of subjects, their physical activity level and daily energy intake in total as well as divided by different macronutrients and meals
2.2 Assisted food records and physical activity records
A traditional 3-day food record was made Citation19. Food, dietary supplements and leftovers were weighed on an ordinary kitchen scales. In a few situations, estimation was needed, e.g. if a subject or the staff acted rapidly without considering the weighing before eating/feeding or before disposing the leftowers or the food intake happened unexpectedly. All dietary supplements were included in the food records. Physical activities were registered in a diary every 15 minutes about 14 hours a day. The subjects or the staff were asked to estimate the physical activities for the rest of the day and to report any unexpected food intake after observation hours. Each subject's daily physical activity level (PALobs) was assessed based on the diary and a 9-level scale (METs) Citation20. The days for observation were chosen so that they were convenient for the subjects. The goal was to choose two weekdays on which the subject engaged in ordinary daily activities and one day during a weekend or holiday. However, for three subjects this was not possible; two were observed on three ordinary weekdays and one on three days of holiday. All data were collected between December 2003 and July 2005.
To calculate body mass index (BMI) and to estimate basal metabolic rate (BMRest), subjects’ weight and height were measured without shoes and with light clothes on. Because six subjects with physical disabilities needed special equipment for measuring their weight and height values, this data was taken from recent health control documentation. BMR was calculated using the Schofield equation Citation21. The food intake level (FIL), a ratio between the energy intake (EI) and BMRest was calculated and compared with PALobs. A similar FIL and PAL indicate good agreement of EI and expenditure, and FIL also gives information about the validity of observed intake Citation22.
Food records were analyzed using the dietary calculation software MATs Citation23, based on the official Swedish food composition database (version 2.00) that includes about 2000 food items Citation24. Dietary supplements and a few food items that were not included in the database were coded as similar food items and those without similar food items were added to the computer program based on data collected from producers of the food items. The presented levels of sucrose include only added sugar and exclude the sucrose from fruits and vegetables. The descriptive statistical analysis was performed with Windows Minitab Version 15; the data are presented as mean and standard deviation (SD), as well as ranges for some of the variables.
To analyze the distribution of the food items and energy, the eating occasions were defined according to time of day. Breakfast was the first eating occasion of the day. Lunch was an eating occasion in the middle of the day, after 10.30 am and before 2.30 pm, if the eating occasion consisted of prepared warm food or a substantial quantity of cold food. Dinner was a similar eating occasion, but occurred later on in the day, after 3.45 pm. All other food consumption was defined as in-between-meal consumption. Adjustments to these definitions were made if subjects or staff used the terms differently. For example, if a subject's first eating occasion on a given day was at the coffee break at the daily activities at nine o'clock and she or he did not call it breakfast, it was defined as an in-between-meal eating occasion. The food items were categorized in food groups according to the Swedish food composition database and in agreement with the food item categorization in a national study of dietary habits in Sweden Citation24Citation25. Energy density was calculated for the whole diet except water, coffee, tea and soft drinks Citation26.
The Nordic Nutrition Recommendations Citation27 were used as a comparison regarding the observed meal pattern, intake of micronutrients and dietary fiber as well as proportions of macronutrients. For micronutrients, the average requirement (AR) was used as a reference value. For vitamin D and calcium, which are not given an AR, the lower level of intake (LI) was used. The comparison has been differentiated for all subjects, meaning that gender and age have determinated the guiding values of AR and LI for each subject. For dietary fiber, the recommended daily intake of 25 g per day was used. The total intake of fruit and vegetable did not include potatoes, but included 100 g juices as maximum Citation28.
3 Results
3.1 Energy intake, distribution of macronutrients, meal patterns and physical activity level
The EI ranged from 4.9 to 14.0 MJ/day. The mean intake of macronutrients matched the suggested distribution in current Nordic Recommendations. Only 4 of the 32 subjects consumed alcoholic beverages during the observations (). For most of the subjects, either lunch or dinner was the largest eating occasion of the day, but for 9 subjects in-between-meal consumption contributed more energy than any of the other meals, and for one subject as much as 56% of the energy came from eating occasions occurring between meals. The energy density was on average 5.7 kJ/g (). The meal patterns were regular. Subjects ate at least one hot meal every day and the majority had breakfast every day. On average, the subjects’ PAL was low (mean 1.4) ().
3.2 Daily intake of different food items
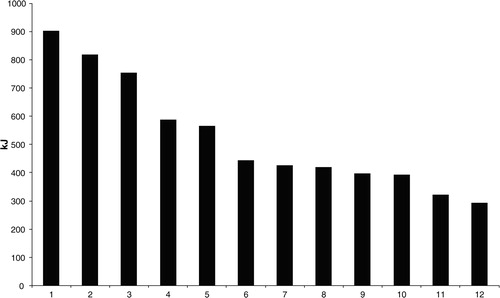
Consumption of food items varied across observation days and subjects. Milk products, bread, meat products and buns and cakes were the food groups from which subjects on average got most of their energy (). Water and different kinds of fruit drinks, both syrup and juices, were more usual than milk and soft drinks as mealtime beverages. All subjects consumed bread and all except one consumed vegetables and milk products. Bread was usually consumed between meals or as breakfast. Mean intake of vegetables and fruit together was around 320 g per day (±221 g) and the median was around 240 g per day. For 7 of the 32 subjects, daily consumption was above 500 g, but more than half of them, 17 subjects, had a daily consumption below 250 g. Vegetables were often consumed at meals and were commonly tomatoes, cucumber and lettuce without seasonal variations. Fruits were mostly eaten between meals and fruit consumption was generally lower than vegetable consumption. Consumption of sweets and crisps was generally low, but the majority of subjects consumed buns and cakes primarily between meals. Dietary supplements were used by 6 subjects; these included either vitamin supplements or more extensive nutrient supplements, such as nutrition enrichment in food or supplemental nutrition instead of food.
Figure 1. The daily contribution of energy (kJ) from different food groups. Average values for all subjects (n = 32). 1: Milk-products, 2: Bread, 3: Meat, poultry incl. dishes, 4: Buns, biscuits, 5: Potatoes and potato dishes, 6: Pizza, pies, crêpes, 7: Pasta and pasta dishes, 8: Sausage and sausage dishes, 9: Fruit syrup and soft drinks, 10: Fish and fish dishes, 11: Edible fats, 12: Vegetable and vegetable dishes.
3.3 Daily intake of micronutrients and dietary fiber
Intakes of micronutrients at levels below AR were most commonly seen in retinol, thiamin, riboflavin, folic acid, iron and selenium (). For those micronutrients, 19–34% of the subjects showed an intake level below AR. For 8 subjects (25%), all intake of micronutrients was above AR and the intake of dietary fibre was above the recommended daily level. Of the subjects with a daily consumption of 500 g fruits and vegetables (n = 7), all except one had an intake of vitamin E, vitamin C and folic acid above AR, as well as an adequate fiber intake. The subjects (n = 17) whose daily consumption of fruit and vegetable was below 250 g had an intake of dietary fiber below 25 g per day, and several subjects showed an intake of retinol, folic acid and vitamins C and/or E below AR. Mean intake of dietary fiber was below the recommended 21 g per day (±9.6 g). Subjects who had an intake level of riboflavin and thiamin below AR consumed soft drinks, fruit syrups (lemonade) or water as mealtime beverages rather than milk. Of the six subjects with an intake of at least 4 micronutrients below AR as well as an intake of dietary fiber below 25 g per day, four were of normal weight and two were underweight. Subjects consuming dietary supplements had an intake level of at least one micronutrient or fibre below AR even if the contribution from supplements was included.
Table 2. Intake levels of micronutrients and dietary fibre for all subjects and number of subjects with intake level below average requirement (AR) or lower intake level (LI) of micronutrients and the recommendations of daily intake of dietary fibre
4 Discussion
The present results show that most of the subjects, individuals with ID living in Swedish community residences, had a relatively varied diet, with the daily EI divided across several meals. However, for most of the subjects, the daily intake of fruits and vegetables was low and poorly matched to the daily recommendations Citation28. The subjects had, on average, a higher consumption of vegetables than fruits, in contrast to the Swedish population in general, according to the most recent national food consumption survey in Sweden Citation25. These results for fruit and vegetable consumption are in agreement with those from a study among people with ID from North America, but the high intake levels of dietary fat in subjects in the North American study were not seen in the present study Citation16. A low consumption of fruits and vegetables reduces the possibility of a sufficient intake of retinol equivalents, vitamin C, vitamin E, folic acid and fiber Citation29, which is confirmed in our study. The low intake follows rather well the data from the Swedish population on average Citation25. A low intake of retinol, riboflavin and thiamin in the present study was related to a choice of soft drinks instead of milk at meals. Intakes of dietary fiber and micronutrient below AR were observed mostly among underweight and as-normal weight subjects. Because earlier studies have mostly focused on bodyweight-related problems for people with ID Citation7Citation8Citation14Citation15 it is important not to forget that normal weight adults with ID can also be a vulnerable group regarding low intake of nutrients. The results also indicate, as seen in , that females are more vulnerable than males in this group.
The distribution of EI from lunch and dinner was very well matched with current meal pattern recommendations, each accounting for 25–35% of the total daily EI Citation28. The average EI from breakfast was 20%, which is at the lower edge of the recommendations (20–25%), and most notably, the EI from in-between-meal consumption was on average larger than that from breakfast. A low EI from breakfast is not usually replaced by a higher EI from lunch or dinner, but instead by a higher EI from in-between-meal consumption Citation30, also seen in this study. That is why food with typically higher energy density and lower micronutrient content increases Citation31Citation32. Eating in-between-meals may have increased in conjunction with new living conditions, which may partly have caused the increased number of in-between-meal eating occasions established by Gabre et al. Citation8. The policy today in Sweden means that individuals who have abilities should take care of the daily food-related tasks by themselves. But everybody who lives in community residences can get support, at least with a check up by staff regarding food purchases and meal preparations for lunch and dinner, whereas breakfast and eating-between-meals are usually left to the individual's own solutions Citation6.
Caution must be taken in generalizing the current results on dietary habits and meal patterns in individuals with ID. The study group is small, including approximately 7% of the ID adult population in community residences, at the time of the study, in the study town. Furthermore, the individuals were not randomly selected; random selection was not possible because of the confidentiality policies to consider in the recruitment process, which is common in studies such as this one Citation16. Nevertheless, the population of adults with ID is generally a heterogeneous group, with different types of disability, and varying in terms of age and gender, also observed as a wide range in BMI in the present study. With this perspective, the present study may provide an adequate picture of the general mix of adults with ID living in similar conditions in residences.
The objective to describe dietary habits mainly focuses on food items and meal patterns, but also on nutrient intake. Although a weight record is considered as the most precise method available for estimation of food and nutrient intake, more than 3 days would have increased the precision of the nutrient intake estimates. However, to observe the adults with ID for additional days was not possible. On the other hand, the food record was performed by the same investigator and not by the subjects themselves, which probably increases food-recording precision. In addition, one of the main findings in the present study, showing low intake of fruit and vegetables, seems valid, since those are food items not usually under-reported Citation33Citation34. There was generally good agreement between FIL and PALobs, probably because all food records were assisted and made by the same independent person. The PAL for all subjects was generally below the PAL level of 1.8 considered as sufficient for good health Citation28.
The subject with the lowest FIL/PALobs ratio (0.68) mostly took care of his household by himself and had a BMI of 35. Persons with high BMI often deliberately under-report or adapt their food intake during studies of dietary habits Citation34Citation35. The subject with the highest FIL/PALobs ratio (1.58) was spastic and had athetoid movements. The extra energy expenditure for these movements Citation11Citation36 is not included in the BMR. Therefore, the BMR would be underestimated and the FIL/PALobs ratio overestimated in this case. This subject had a BMI of 24 and probably maintained a rather good energy balance. Five other subjects were also spastic, but they had a lower FIL/PAL ratio (on average 1.10) and a lower BMI (on average 17). Also in these cases, the BMR is underestimated due to the spastic movements. Their FIL/PAL ratio is lower, in agreement with the low BMI and probably a sign of insufficient EI.
In conclusion, this first study on the dietary habits of people with ID who are living under new conditions shows great variation in EI, but a similar meal pattern. The most important energy sources were generally milk products, bread and meat products, though buns and cakes mainly eaten in-between-meals, as well as soft drinks and fruit syrups, were also quite considerable sources of energy. Most subjects had a low intake of vegetables and especially fruits. The intake of dietary fiber was generally low, and almost one-third of the subjects showed an intake below AR for several micronutrients. All members of this heterogeneous group should be regarded as individuals with specific needs. To have a kitchen and supporting staff seems not to be enough. Adults with ID have to be treated individually due to their specific needs. A need for more knowledge about food in general and particularly how fruit and vegetables could be included in cooking as well as encouraged to be eaten as in-between-meals seems imperative in the new living conditions for adults with ID. To gain more knowledge about the individuals, the present study will be followed by a case study aimed at giving a deeper understanding of how living conditions influence dietary habits.
Acknowledgements
This study has been financially supported by Stiftelsen Sävstaholm in Sweden. Stiftelsen Sävstaholm is a foundation providing financial support for research on people with ID and has a special program to support PhD students. We wish to give special thanks to all our subjects, their co-residents and supporting staff.
References
- World Health Organisation. ICD-10 guide for mental retardation. Geneva: WHO; 1990 (http://www.who.int/mental_health/media/en/69.pdf 20080717).
- Mervis CB. Mental retardation: cognitive aspects. International encyclopaedia of the social and behavioral sciences, Smelser NJ, Baltes BP. Elsevier Science Ltd: Oxford; 2001, 9700-4
- Snell MR, Luckasson R. Mental retardation: clinical aspects. International encyclopaedia of the social and behavioral sciences, Smelser NJ, Baltes BP. Elsevier Science Ltd: Oxford; 2001, 9695-700
- Grunewald K. Close the institutions for the intellectually disabled. Everyone can live in the open society. Saltsjö-Duvnäs: Author; 2003 (http://www.independentliving.org/docs7/grunewald2003.pdf 2008 08 11).
- Swedish Statute Book (SFS). Act of support and service for persons with certain functional impairments; 1993: 387 (http://www.sweden.gov.se/sb/d/3873/a/72669 20080717).
- Socialstyrelsen. The National Board of Health and Welfare Bostad med särskild service för vuxna enligt LSS. Stöd för rättstillämpning och handläggning. Stockholm: Socialstyrelsen; 2007: 21–36 (http://www.socialstyrelsen.se/NR/rdonlyres/B19EF024-33AE-4FA8-BE30-8133B197FBF6/7947/20071016.pdf). (In Swedish.)
- Bryan F, Allan T, Russell L. The move from a long-stay learning disabilities hospital to community homes: a comparison of clients’ nutritional status. 2000; 13: 265-70. 10.3402/fnr.v52i0.1857
- Gabre P, Martinsson T, Gahnberg L. Move of adults with intellectual disability from institutions to community-based living: changes of food arrangements and oral health. 2002; 26: 81-8
- Mallander O. De hjälper oss till rätta. Lund universitet: Meddelanden från Socialhögskolan; 1999: 2. (In Swedish.)
- World Health Organisation. Healthy aging – adults with intellectual disabilities: summative report. Geneva: WHO; 2000 (http://www.who.int/mental_health/media/en/20.pdf 20080717).
- ADA Report Position of the American Dietetic Association: providing nutrition services for infants, children, and adults with developmental disabilities and special health care needs. 2004; 104: 97-107. 10.3402/fnr.v52i0.1857
- The National Food Administration, The Swedish National Institute of Public Health. The National Plan of Action for Nutrition Uppsala. The National Food Administration; 1999 (http://www.slv.se/upload/dokument/mat/nutrition/handplanwebversion.pdf 20080717). (In Swedish.)
- Mattsson Sydner Y. Mat inom handikapp-och äldreomsorg. Sweden: Umeå University; 2004 (http://www.slv.se/upload/dokument/Rapporter/mat_naring/mat_handikapp_aldreomsorgen.pdf 20080717). (In Swedish.)
- Rimmer JH, Yamaki K. Obesity and intellectual disability. 2006; 12: 22-7. 10.3402/fnr.v52i0.1857
- Hove O. Weight survey on adult persons with mental retardation living in the community. 2004; 25: 9-17. 10.3402/fnr.v52i0.1857
- Draheim CC, Stanish HI, Williams DP, Mc Cubbin JA. Dietary intake of adults with mental retardation who reside in community settings. 2007; 112: 392-400. 10.3402/fnr.v52i0.1857
- Tøssebro J. Researching the living conditions of people with intellectual disabilities. Methods for studying the living conditions of persons with disabilities, Hjelmquist E, Kebbon L. Socialvetenskapliga forskningsrådet: Stockholm; 1998
- The National Board of Health and Welfare. Statistics – LSS persons with certain functional impairments – measures specified by LSS 2003. Stockholm: Socialstyrelsen; 2004 (http://www.socialstyrelsen.se/Publicerat/2004/5105/2004-44-2.htm). (In Swedish.)
- Gibson RS.The principals of nutritional assessments2nd ednOxford University Press: New York; 2005
- Bouchard C, Tremblay A, Leblanc C, Lortie G, Savard R, Thériault G. A method to assess energy expenditure in children and adults. 1983; 37: 461-7
- Schofield WN. Predicting basal metabolic rate, new standards and review of previous work. 1985; 1: 5-41
- Johansson G, Åkesson A, Berglund M, Nermell B, Vahter M. Validation with biological markers for food intake of a dietary assessment method used by Swedish women with three different dietary preferences. 1998; 1: 199-206. 10.3402/fnr.v52i0.1857
- Nordin M. MATs: a nutrient calculation system designed for research and education (Version 4.0 ed.). Västerås: Rudans Lättdata; 1997. (In Swedish.)
- National Food Administration. NFA database 2.00.
- Becker W, Pearson M. Riksmaten 1997–1998 Kostvanor och näringsintag i Sverige [Dietary habits and nutrient intake in Sweden 1997–1998]. Uppsala: Livsmedelsverket; 2002 (http://www.slv.se/upload/dokument/Rapporter/kostundersokningar/riksmat.pdf 20080717). (In Swedish).
- Ledikwe JH, Blanck HM, Kettel Kahn L, Serdula MK, Seymour JD, Tohill BCet al.Dietary energy density determined by eight calculation methods on a nationally representative United States population. 2005; 2: 273-8
- Nordic Council of Ministers. Nordic nutrition recommendations. Copenhagen: Nord; 2004: 13.
- Statens livsmedelsverk. Rekommendationer om kost och motion. Livsmedelsverket Uppsala; 2004 (http://www.slv.se/templates/SLV_Page.aspx?id = 14663&epslanguage = SV 20080717). (In Swedish.)
- Taylor CA, Hampl JS, Johnston JS. Low intakes of vegetables and fruits, especially citrus fruits, lead to inadequate vitamin C intakes among adults. 2000; 54: 573-8. 10.3402/fnr.v52i0.1857
- Kerver JM, Yang EJ, Obayashi S, Bianchi L, Song WO. Meal and snacks patterns are associated with dietary intake of energy and nutrients in US adults. 2006; 106: 46-53. 10.3402/fnr.v52i0.1857
- Ovaskainen M-L, Reinivuo H, Tapanainen H, Hannila M-L, Korhonen T, Pakkala H. Snacks as an element of energy intake and food consumption. 2006; 60: 494-501. 10.3402/fnr.v52i0.1857
- Sjöberg A, Hallberg L, Höglund D, Hulthén L. Meal pattern, food choice, nutrient intake and lifestyle factors in Göteborg Adolescence Study. 2003; 57: 1569-78. 10.3402/fnr.v52i0.1857
- Bingham SA, Cassidy A, Cole TJ, Welch A, Runswick SA, Black AEet al.Validation of weighed records and other methods of dietary assessment using the 24 h urine nitrogen technique and other biological markers. 1998; 73: 531-50. 10.3402/fnr.v52i0.1857
- Johansson L, Solvoll K, Bjørneboe G-EA, Drevon CA. Under- and overreporting of EI related to weight status and lifestyle in a nationwide sample. 1998; 68: 266-74
- Goris AH, Westerterp-Plantenga M, Westerterp KR. Undereating and underrecording of habitual food intake in obese men: selective underreporting of fat intake. 2000; 71: 130-4
- Johnson RK, Goran MI, Ferrara MS, Poehlman ET. Atheotosis increases resting metabolic rate in adults with cerebral palsy. 1996; 96: 145-8. 10.3402/fnr.v52i0.1857