Abstract
Background: People who eat more fiber often have a lower body weight than people who eat less fiber. The mechanism for this relationship has been explained, in part, by increased satiety, which may occur as a result of changes in appetite-suppressing gut hormone levels, and decreases in food intake at subsequent meals.
Objective: We hypothesized that increasing doses of mixed fiber, consumed in muffins for breakfast, would proportionally influence satiety, gut hormone levels, and subsequent food intake.
Design: This was a randomized, double-blind, crossover study. Healthy men (n=10) and women (n=10) with a BMI of 24±2 (mean±SEM) participated in this study. Fasting subjects consumed a muffin with 0, 4, 8, or 12 g of mixed fibers and approximately 500 kcal. Visual analog scales rated hunger and satiety for 3 h; blood was drawn to measure ghrelin, glucagon-like peptide-1 (GLP-1), and peptide YY3–36 (PYY3–36) at various intervals; and food intake was measured at an ad libitum lunch.
Results: Responses to satiety-related questions did not differ among treatments. However, despite lack of differences in satiety, gut hormone levels differed among treatments. Ghrelin was higher after the 12 g fiber dose than after the 4 and 8 g fiber doses. GLP-1 was higher after the 0 g fiber dose than after the 12 and 4 g fiber doses, and PYY3–36 did not differ among fiber doses. Food intake was also indistinguishable among doses.
Conclusion: Satiety, gut hormone response, and food intake did not change in a dose-dependent manner after subjects consumed 0, 4, 8, and 12 g of mixed fiber in muffins for breakfast.
Introduction
Observational studies suggest that fiber intake is inversely associated with body weight Citation1Citation2Citation3. For example, a study reported that in a 20-month period, every 1 g increase in total fiber consumed per day, decreased body weight by 0.25 kg Citation4. Improved satiety and decreased food intake are common theories used to describe why fiber intake may be associated with a lower body weight Citation5.
Fiber has well-documented effects on satiety Citation6; and because of this, it is often implied that consuming high-fiber foods will reduce food intake. Some studies have compared satiety and food intake after one dose of fiber compared to a control; however, few, if any, studies have evaluated how increasing doses of fiber actually influence food intake at subsequent meals.
Certain types of fiber may influence satiety more than others Citation7. For example, a large review suggests that viscous fibers, such as guar gum, pectin, and β-glucan may improve satiety more than less viscous fibers Citation6.
Gut hormones are also proposed as important factors for the control of appetite and satiety Citation8. Ghrelin has been shown to be positively correlated with hunger Citation9, while glucagon-like peptide-1 (GLP-1) and peptide YY3–36 (PYY3–36) are believed to be inversely correlated Citation10Citation11. However, most studies evaluate gut hormone changes after predominantly carbohydrate, protein, or fat intake; very few studies have evaluated how these three hormones change in response to fiber intake Citation12Citation13. It is possible, that fiber decreases appetite by favorably influencing gut hormone levels.
At a time when food manufactures are adding fibers to everything from yogurt to snack foods, it is important to know more about the physiologic benefits of various fiber types and doses. Therefore, we hypothesized that a mixed-fiber muffin, fed at four practical doses (0, 4, 8, and 12 g), would increase satiety and decrease food intake in a dose-dependent manner. We also hypothesized that ghrelin, GLP-1, and PYY3–36 would change in proportion to fiber dose.
Methods and materials
The University of Minnesota Institutional Review Board Human Subjects Committee approved all aspects of this research. Twenty subjects were recruited in the fall of 2007 by flyers placed around the University of Minnesota campus. They were chosen based on power calculations (80% power with α = 0.05) calculated from the differences in visual analog scale (VAS) scores.
Subjects were screened over the phone and subject eligibility was determined in accordance with all inclusion and exclusion criteria. Included subjects were English-speaking, healthy men and women between 18 and 65 years of age. They were non-smoking; not taking medications; non-dieting (weight stable over last 3 months); had a BMI between 18 and 27; and were normoglycemic. Subjects also had to be able to give blood through an IV. Subjects were excluded if they: did not regularly consume breakfast; had a distaste for muffins; had any history of disease or significant past medical history; were vegetarians or consumed more than approximately 15 g of fiber per day; were pregnant or lactating; or if they had irregular menstrual cycles.
Screening and study visits
Prior to any procedures the study coordinator obtained a signature on informed consent. After formal acceptance into the study, each subject received instructions for the day before study visits. In the 24 h prior to each visit, subjects followed a low-fiber, lead-in diet, which prohibited use of fiber supplements and alcohol. Subjects were required to maintain their body weight and activity level throughout the study period; specifically, they had to avoid excessive exercise 24 h before each visit.
Fasted subjects arrived at the General Clinical Research Center (GCRC) on the University of Minnesota campus between 7:00 and 9:00 am on weekdays. All visits were held in a quiet room, which allowed subjects to read, use laptops, work quietly, or listen to music. Visits were scheduled at least 1 week apart. However, women participated only during the follicular phase of their menstrual cycle so some visits were more than a week apart.
Upon arrival at the GCRC, a registered nurse inserted an antecubital IV that was used for blood drawing purposes only. The IV was left in place for 10 min before drawing the baseline blood sample; this was done in attempt to reduce the possibility of elevated hormone levels after venipuncture stress Citation14.
After 10 min of rest, subjects were given instructions for completing the computerized VAS and proceeded to complete their baseline appetite assessment. Immediately after, fasting blood samples were drawn to evaluate ghrelin, GLP-1, and PYY3–36. Subjects then consumed either a low-fiber control muffin or one of three fiber-containing muffins for breakfast. The muffin and 250 ml of water were consumed within 10 min.
Appetite sensations were rated by VAS at 15, 30, 45, 60, 90, 120, and 180 min after baseline. Ghrelin samples were drawn at 15, 30, 60, and 90 min, and GLP-1 and PYY3–36 were drawn at 30 and 60 min. The IV was removed at the end of the 180-min period and subjects were given a buffet lunch of pre-selected, pre-weighed pizzas, and 1 l of water. Subjects were told to eat until comfortably satisfied. After 30 min, the remaining pizza and water were weighed, and energy intakes were calculated. Pizza has been successfully used as an ad libitum meal in previous studies Citation15Citation16Citation17. Before subjects were discharged from the GCRC they were instructed to keep a detailed food record for the remainder of the day.
Treatment muffins
In a randomized fashion subjects received the four treatment muffins containing: 0, 4, 8, and 12 g of mixed fiber for breakfast. The mixed fiber was presented in equal proportions in each muffin: pectin (Apple Pectin SF 50-LV, Herbstreith & Fox, Neuenbürg/Württ, Germany), barley β-glucan (Barliv, Cargill, Hammond, IN), guar gum (Guar, TIC Gums, White Marsh, MD), pea fiber (Centara Dietary Pea Fibre, Norben, Willoughby, OH), and citrus fiber (Citri-Fi 100FG, Fibrestar, Inc., Willmar, MN). These fibers were chosen based on a literature review of fiber and satiety, which suggested that viscous fibers were more likely to affect appetite, and for their ability to be baked uniformly into muffins Citation6. The muffins were spice flavored and commercially made (Nestlé R&D Center; Solon, OH). Attempts were made to balance macronutrient content; however, disguising viscous fiber in products is extremely difficult and some variances in macronutrient content were inevitable ().
Table 1. Composition of treatment muffinsa
After baking and cooling, the muffins were frozen at −20°C. Muffins were removed from the freezer 2 h before each subject visit and were thawed at room temperature.
Visual analog scales (VAS)
Questions were taken directly from previously validated 100 mm VAS Citation18. The appetite-related questions assessed hunger, satisfaction, fullness, and prospective food intake.
Dietary intake analysis
The post-intervention food records were analyzed using the dietary analysis program, Nutrition Data System for Research (NDSR, version 2007, Nutrition Coordinating Center, Minneapolis, MN). NDSR provided detailed nutrient information, including: total energy, carbohydrate, fat, protein, and fiber intake.
Sample collection and analysis
Gut hormones were analyzed with commercially available RIA and ELISA kits from Millipore, St. Charles, MO (Total Ghrelin, Cat. # GHRT-89HK; Active Glucagon-Like Peptide-1, Cat. # EGLP-35K; and Human PYY3–36, Cat. # PYY-67HK). Plasma samples were prepared and stored according to manufacturer's instructions. Intra- and inter-assay coefficients of variation are available on the manufacturer website.
Statistical analysis
Every subject who consented to the study completed all four visits. Appetite-related responses and gut hormone levels are expressed as change from baseline and were compared using area under the curve (AUC). AUC was calculated by the trapezoidal rule. Change from baseline AUC for appetite questions; change from baseline AUC for gut hormones; and ad libitum food intake in the post-intervention period were compared among treatments using a mixed effects linear model with a random subject effect (Proc Mixed). Proc Mixed calculated treatment means, standard error, and statistical differences between treatment means. Data are presented as mean±SE when appropriate. Statistical significance was determined at p<0.05. Carryover, treatment sequence, and interaction terms were tested in each model, but were omitted because they were not significant at p<0.05. All final models included fiber dose and visit number only. Spearman correlation coefficient tests were performed to assess associations between select variables. All analyses were carried out with SAS 9.1.2 (SAS Institute, Cary, NC).
Results
Subject characteristics
Twenty racially diverse subjects (10 men and 10 women) participated in this study. The mean age and BMI were 26±7 years and 24±2 kg/m2, respectively. Age and BMI did not differ between genders or among the treatment sequence groups (data not shown).
Baseline responses on VAS and fasting gut hormone levels were not statistically different among treatments. All data were normally distributed and, therefore, were not transformed.
Appetite sensations
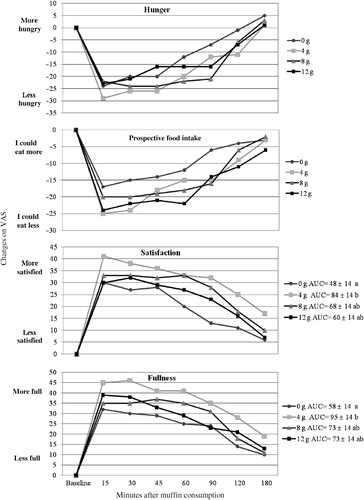
AUC hunger and prospective food intake did not differ among fiber doses; AUC satisfaction and fullness varied slightly among treatments (). Subjects were more satisfied and more full after consuming the 4 g fiber muffin than after consuming the 0 g fiber muffin (p<0.01); the remaining treatments were indistinguishable. Appetite sensations did not change in a clear dose-dependent manner (p for trends >0.11).
Figure 1. AUC changes for satiety-related questions (expressed as change from baseline). In the legend, the numbers after each fiber dose represent the AUC score±SEM. The treatments with different letters have statistically different AUC; p<0.05. AUC is not specified unless the fiber doses provoked significantly different responses.
Food intake
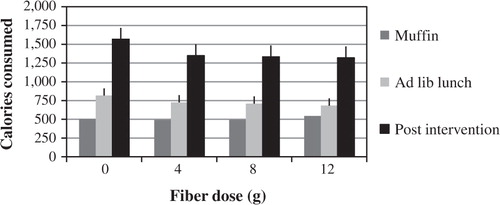
Food intake at the lunch buffet and in the post-intervention period did not differ among fiber doses (). Total fiber (g), total fat (g), total carbohydrate (g), total protein (g), and total food weight (g) consumed were also indistinguishable (data not shown).
Figure 2. Mean (±SEM) calorie intake during 24-h intervention day. There were no statistical differences among treatments for intake at the lunch buffet or during the post-intervention period.
Gut hormones
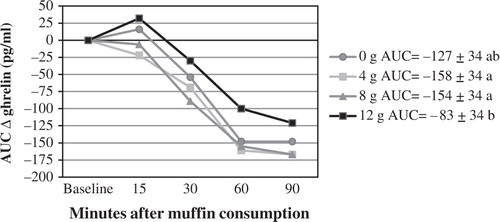
AUC ghrelin was higher after the 12 g fiber dose than after the 4 and 8 g fiber doses (). This was unexpected since ghrelin is known to be the hunger hormone and our subjective appetite measures indicated that there were no differences in hunger among the 4 fiber doses. In addition, AUC ghrelin did not correlate with AUC hunger for any of the fiber doses (Spearman Correlation Coefficients; p>0.05). Ghrelin did not change in a clear dose-dependent manner (p for trend = 0.24).
Figure 3. AUC ghrelin (expressed as change from baseline). In the legend, the numbers after each fiber dose represent the AUC score±SEM. The treatments with different letters have statistically different AUC; p<0.05.
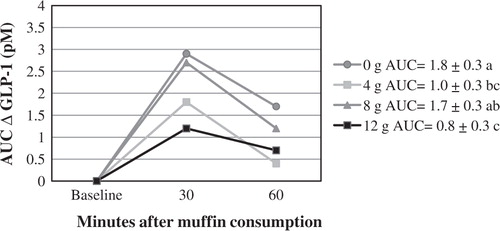
AUC GLP-1 was higher after the 0 g fiber dose than after the 4 and 12 g doses; it was also higher after the 8 g dose than after the 12 g dose (). GLP-1 did not change in a clear dose-dependent manner (p for trend = 0.08).
Figure 4. AUC GLP-1 (expressed as change from baseline). In the legend, the numbers after each fiber dose represent the AUC score±SEM. The treatments with different letters have statistically different AUC; p<0.05.
AUC PYY3–36 did not differ among treatments, but approximately 65% of samples fell below the assay detection level of 21.1 pg/ml (data not shown). Levels less than detection were included in the analysis as 21 pg/ml.
Discussion
The purpose of this study was to compare the effects of four practical doses of mixed fiber on satiety, gut hormone levels, and food intake. Surprisingly, none of our endpoints changed in a dose-dependent manner.
Our findings are inconsistent with previous reviews suggesting that fiber intake is positively associated with satiety Citation5Citation6. To the best of our knowledge, only two crossover studies have evaluated how various doses of the same fiber influence satiety in the same subject population. In each of these studies, the higher fiber dose was more satiating than the low- or no-fiber dose. Mathern et al. Citation19 studied the effects of 0, 4, and 8 g of viscous fenugreek fiber on a variety of appetite sensations. They found that 8 g of fenugreek mixed into orange juice was significantly more satiating than 0 or 4 g. Similarly, Gustafsson et al. Citation20 found that portions of carrots containing 6 and 9 g of fiber were significantly more satiating than portions containing 3 g of fiber, when incorporated into a mixed meal. It is difficult to explain why our results are incongruous with these two studies; however, it is likely related to the type of fiber administered. Certain types of fiber have been found to be more satiating than others Citation7. The fibers used in this study were chosen because of their viscous characteristics and their previous association with appetite suppression Citation6. Our results, however, suggest that a combination of fibers may not be as effective as one fiber given in isolation.
Studies that use lower doses of fiber generally find no effect on satiety. For example, Mattes et al. Citation21 found no difference in satiety when subjects consumed a snack bar with 4 g of mixed fiber and a bar with 1 g of fiber. Similarly, Hlebowicz et al. Citation22 found no differences in appetite ratings after subjects consumed a control cereal and cereals with 1.5–7 g of fiber. Lastly, a third study found snack bars with 4–10 g of added fiber had no influence on appetitive sensations compared to a 2 g fiber control Citation23. Although, our study included up to 12 g of fiber, it is possible that this dose still was not large enough to influence appetite. Collectively, the results of these studies suggest that higher fiber doses may be needed to induce satiety.
It should also be noted that the water content increased and the caloric density decreased slightly with each dose of fiber. It is possible that these differences could have influenced our satiety results. However, this is unlikely since research suggests that an increased water content and increased caloric density should improve satiety Citation6; and this was not the case in our study. In fact, the 12 g fiber muffin (with the highest water content and lowest caloric density) was no more satiating than any of the other muffins. Also of note, we recognize that the 0 g fiber muffin contained more fat than the other muffins. We do not, however, feel this influenced our findings since the satiety-related results for this muffin were not significantly different from the other muffins with less fat.
A large dietary fiber review reported that subjects tend to eat less at subsequent meals (and over time) if they are fed higher fiber foods compared to lower fiber foods Citation5. Our data contradict this association. Food intake at the ad libitum pizza lunch, and in the post-intervention period, was indistinguishable among our fiber doses. This, however, was somewhat expected since appetite sensations were not significantly different among our fiber doses. If subjects’ hunger and prospective food intake levels were not different then we would not expect food intake to differ at a subsequent meal or for the remainder of the day. Mattes Citation21 reported similar findings after feeding subjects a combination of viscous fibers in a breakfast bar.
Many reviews have suggested that gut hormones – like ghrelin, GLP-1, and PYY3–36 – play influential roles in appetite regulation and food intake Citation8Citation24Citation25Citation26Citation27. However, it is clear that different macronutrients exert different post-prandial effects Citation28Citation29.
Research suggests that digestible carbohydrates or proteins are more effective for suppressing post-prandial ghrelin than fat Citation25Citation28Citation30. However, the effect of consuming a predominantly fiber food, or consuming fiber as part of a mixed meal, is rarely described.
Elevated ghrelin is typically correlated with hunger and stimulation of food intake, while ghrelin suppression is correlated with satiety Citation25Citation31Citation32. In our study, AUC ghrelin was higher after the 12 g fiber dose than after the 4 and 8 g doses. This finding was unexpected, since there were no differences in hunger or satiety among these doses. There is some evidence, however, that fiber intake may inhibit ghrelin suppression. For example, ghrelin suppression was inhibited when comparing meals that had little or no fiber, to meals that contained high doses of psyllium Citation33, viscous fibers Citation34, and wheat fiber Citation35.
It is possible that the viscous nature of our fibers inhibited ghrelin suppression by altering gastric emptying and changing patterns of digestion and absorption Citation36Citation37. However, if this were true then we should have expected to see the most ghrelin suppression after the 0 g fiber dose, which we did not. Further research is needed to better understand the role ghrelin plays in appetite after fiber intake.
GLP-1 is typically very low in the fasting state, but rises quickly after food intake, especially after carbohydrates Citation10. The rise of GLP-1 has been correlated with increased satiety and less hunger Citation38Citation39. In our study, AUC GLP-1 was highest after the 0 g fiber treatment and lowest after the 12 g dose. GLP-1 was also significantly higher after the 0 g fiber dose than after the 4 g fiber dose. This is contrary to what we would expect, since the 4 g fiber dose produced greater feelings of satisfaction and fullness compared to the 0 g fiber treatment.
Again, we hypothesize that gastric emptying time and overall nutrient absorption may have been slower after our fiber treatments; thus, fewer stimuli (nutrients) were available to promote GLP-1 release. It is conceivable that nutrients interfaced with intestinal cells and nerve fibers more rapidly after the 0 g fiber dose, which subsequently produced a greater GLP-1 response. This theory is supported by Juvonen et al. Citation36. They compared high- and low-viscosity beverages with equivalent fiber content and found that the high-viscosity beverage significantly slowed gastric emptying and suppressed GLP-1 release compared to the equivalent low-viscosity beverage. Miholic et al. Citation40 also report that gastric emptying time is positively correlated with GLP-1 levels. Specifically, they state that faster gastric emptying time was related to higher GLP-1 concentrations. This is contrary to the findings of others, who have reported that GLP-1 is inversely associated with gastric emptying time Citation38Citation41Citation42. However, these studies have evaluated gastric emptying after GLP-1 infusions or GLP-1 stimulated by fiber-free meals.
Similar to GLP-1, PYY3–36 concentrations are expected to increase shortly after food intake Citation11. The change in PYY3–36 concentration is believed to reflect calorie content and the macronutrient composition of a meal. However, there are no published human studies evaluating changes in PYY3–36 after fiber is consumed as part of a mixed meal. Several studies have indicated that satiety increases in proportion to plasma levels of PYY3–36; however, this is most often seen after exogenous administration and not by way of endogenous production after food intake Citation43Citation44Citation45.
PYY3–36 did not rise substantially after any of our muffins were consumed. However, the majority of our subjects’ blood samples remained below the assay detection range for PYY3–36. We have no reason to believe this was an assay error, since preparation and analysis techniques were the same as those previously described in the literature Citation46Citation47. PYY3–36 was consistently detectable in seven of our 20 subjects; though, there was significant variability in the baseline values among subjects and among test days (22–161 pg/ml). This suggests that basal levels of PYY3–36 are highly variable within, and between, individuals, and that this study was not powered appropriately to determine statistical differences in PYY3–36.
In conclusion, increasing doses of a practical dose of mixed fiber did not influence satiety, gut hormone levels, or food intake in a dose-dependent manner. Despite common notions that fiber may improve satiety, this does not appear true for all types and doses of fibers. Therefore, blanket statements between fiber and satiety should be made with caution, and should be specific to a particular fiber type and dose. As well, three commonly accepted objective appetite markers (ghrelin, GLP-1, and PYY3–36) were not consistent with the subjective satiety ratings of our subjects. This emphasizes the complexity of appetite and gut hormone signaling in the setting of fiber intake.
Conflict of interest and funding
ALE, LH, and HG are employees of Nestlé but have no conflicts of interest. Authors HJW, WT, and JLS have no conflicts of interest.
Acknowledgements
This research was sponsored by the Nestlé Research Center, a Doctoral Dissertation Fellowship from the University of Minnesota, and Grant No. M01 RR00400 from the National Center for Research Resources.
Related Research Data
References
- Howarth NC, Saltzman E, McCrory MA, Greenberg AS, Dwyer J, Ausman Let al.Fermentable and nonfermentable fibre supplements did not alter hunger, satiety or body weight in a pilot study of men and women consuming self-selected diets. 2003; 1333141-4
- Liu S, Willett WC, Manson JE, Hu FB, Rosner B, Colditz G. Relation between changes in intakes of dietary fibre and grain products and changes in weight and development of obesity among middle-aged women. 2003; 78920-7
- Maskarinec G, Takata Y, Pagano I, Carlin L, Goodman MT, Le Marchand Let al.Trends and dietary determinants of overweight and obesity in a multiethnic population. 2006; 14717-26
- Tucker LA, Thomas KS. Increasing total fibre intake reduces risk of weight and fat gains in women. 2009; 139576-81
- Howarth NC, Saltzman E, Roberts SB. Dietary fibre and weight regulation. 2001; 59129-39
- Slavin J, Green H. Dietary fibre and satiety. 2007; 3232-42
- Willis HJ, Eldridge AL, Beiseigel J, Thomas W, Slavin JL. Greater satiety response with resistant starch and corn bran in human subjects. 2009; 29100-5
- Huda MS, Wilding JP, Pinkney JH. Gut peptides and the regulation of appetite. 2006; 7163-82
- Kojima M, Kangawa K. Structure and function of ghrelin. 2008; 4689-115
- Holst JJ. The physiology of glucagon-like peptide 1. 2007; 871409-39
- Neary MT, Batterham RL. Peptide YY: food for thought. 2009; 97616-9
- Essah PA, Levy JR, Sistrun SN, Kelly SM, Nestler JE. Effect of macronutrient composition on postprandial peptide YY levels. 2007; 924052-5
- Stock S, Leichner P, Wong AC, Ghatei MA, Kieffer TJ, Bloom SRet al.Ghrelin, peptide YY, glucose-dependent insulinotropic polypeptide, and hunger responses to a mixed meal in anorexic, obese, and control female adolescents. 2005; 902161-8
- Kawakami Y. Noninvasive methods to monitor the production of hormone. 2001; 49562-5
- Samra RA, Anderson GH. Insoluble cereal fibre reduces appetite and short-term food intake and glycemic response to food consumed 75 min later by healthy men. 2007; 86972-9
- Freeland KR, Anderson GH, Wolever TM. Acute effects of dietary fibre and glycaemic carbohydrate on appetite and food intake in healthy males. 2008; 5258-64
- Anderson GH, Catherine NL, Woodend DM, Wolever TM. Inverse association between the effect of carbohydrates on blood glucose and subsequent short-term food intake in young men. 2002; 761023-30
- Flint A, Raben A, Blundell JE, Astrup A. Reproducibility, power and validity of visual analogue scales in assessment of appetite sensations in single test meal studies. 2000; 2438-48
- Mathern JR, Raatz SK, Thomas W, Slavin JL. Effect of fenugreek fibre on satiety, blood glucose and insulin response and energy intake in obese subjects. 2009; 231543-8
- Gustafsson K, Asp NG, Hagander B, Nyman M. Dose-response effects of boiled carrots and effects of carrots in lactic acid in mixed meals on glycaemic response and satiety. 1994; 48386-96
- Mattes RD. Effects of a combination fibre system on appetite and energy intake in overweight humans. 2007; 90705-11
- Hlebowicz J, Wickenberg J, Fahlstrom R, Bjorgell O, Almer LO, Darwiche G. Effect of commercial breakfast fibre cereals compared with corn flakes on postprandial blood glucose, gastric emptying and satiety in healthy subjects: A randomized blinded crossover trial. Nutr J 2007; 6: 22. http://www.biomedcentral.com/content/pdf/1475-2891-8-26.pdf [cited 10 April 2009].
- Peters HP, Boers HM, Haddeman E, Melnikov SM, Qvyjt F. No effect of added beta-glucan or of fructooligosaccharide on appetite or energy intake. 2009; 8958-63
- Chaudhri OB, Salem V, Murphy KG, Bloom SR. Gastrointestinal satiety signals. 2008; 70239-55
- Cummings DE, Overduin J. Gastrointestinal regulation of food intake. 2007; 11713-23
- Naslund E, Hellstrom PM. Appetite signaling: from gut peptides and enteric nerves to brain. 2007; 92256-62
- Wren AM, Bloom SR. Gut hormones and appetite control. 2007; 1322116-30
- Karhunen LJ, Juvonen KR, Huotari A, Purhonen AK, Herzig KH. Effect of protein, fat, carbohydrate and fibre on gastrointestinal peptide release in humans. 2008; 14970-8
- Lomenick JP, Melguizo MS, Mitchell SL, Summar ML, Anderson JW. Effects of meals high in carbohydrate, protein, and fat on ghrelin and peptide YY secretion in prepubertal children. 2009; 944463-71
- Baynes KC, Dhillo WS, Bloom SR. Regulation of food intake by gastrointestinal hormones. 2006; 22626-31
- Callahan HS, Cummings DE, Pepe MS, Breen PA, Matthys CC, Weigle DS. Postprandial suppression of plasma ghrelin level is proportional to ingested caloric load but does not predict intermeal interval in humans. 2004; 891319-24
- le Roux CW, Patterson M, Vincent RP, Hunt C, Ghatei MA, Bloom SR. Postprandial plasma ghrelin is suppressed proportional to meal calorie content in normal-weight but not obese subjects. 2005; 901068-71
- Karhunen L , Flander S , Liukkonen KH , Lähteenmäki L , Valtanen S Jalkanen H, et al. Fibre effectively inhibits postprandial decrease in plasma ghrelin concentration. 2005; 6: 59 (Presented as a postor at the European Congress on Obesily, Athens, Greece).
- Mohlig M, Koebnick C, Weickert MO, Lueder W, Otto B, Steiniger Jet al.Arabinoxylan-enriched meal increases serum ghrelin levels in healthy humans. 2005; 37303-8
- Weickert MO, Spranger J, Holst JJ, Otto B, Koebnick C, Mohlig Met al.Wheat-fibre-induced changes of postprandial peptide YY and ghrelin responses are not associated with acute alterations of satiety. 2006; 96795-8
- Juvonen KR, Purhonen AK, Salmenkallio-Marttila M, Lahteenmaki L, Laaksonen DE, Herzig KHet al.Viscosity of oat bran-enriched beverages influences gastrointestinal hormonal responses in healthy humans. 2009; 139461-6
- Hoad CL, Rayment P, Spiller RC, Marciani L, Alonso Bde C, Traynor Cet al.In vivo imaging of intragastric gelation and its effect on satiety in humans. 2004; 1342293-300
- Naslund E, Barkeling B, King N, Gutniak M, Blundell JE, Holst JJet al.Energy intake and appetite are suppressed by glucagon-like peptide-1 (GLP-1) in obese men. 1999; 23304-11
- Verdich C, Flint A, Gutzwiller JP, Naslund E, Beglinger C, Hellstrom PMet al.A meta-analysis of the effect of glucagon-like peptide-1 (7–36) amide on ad libitum energy intake in humans. 2001; 864382-9
- Miholic J, Hoffmann M, Holst JJ, Lenglinger J, Mittlbock M, Bergmann Het al.Gastric emptying of glucose solution and associated plasma concentrations of GLP-1, GIP, and PYY before and after fundoplication. 2007; 21309-14
- Flint A, Raben A, Ersboll AK, Holst JJ, Astrup A. The effect of physiological levels of glucagon-like peptide-1 on appetite, gastric emptying, energy and substrate metabolism in obesity. 2001; 25781-92
- Naslund E, Bogefors J, Skogar S, Gryback P, Jacobsson H, Holst JJet al.GLP-1 slows solid gastric emptying and inhibits insulin, glucagon, and PYY release in humans. 1999; 277R910-6
- Sloth B, Holst JJ, Flint A, Gregersen NT, Astrup A. Effects of PYY1–36 and PYY3–36 on appetite, energy intake, energy expenditure, glucose and fat metabolism in obese and lean subjects. 2007; 292E1062-8
- Degen L, Oesch S, Casanova M, Graf S, Ketterer S, Drewe Jet al.Effect of peptide YY3–36 on food intake in humans. 2005; 1291430-6
- Batterham RL, Cohen MA, Ellis SM, Le Roux CW, Withers DJ, Frost GSet al.Inhibition of food intake in obese subjects by peptide YY3–36. 2003; 349941-8
- Helou N, Obeid O, Azar ST, Hwalla N. Variation of postprandial PYY3–36 response following ingestion of differing macronutrient meals in obese females. 2008; 52188-95
- Rubio IG, Castro G, Zanini AC Medeiros-Neto G. Oral ingestion of a hydrolyzed gelatin meal in subjects with normal weight and in obese patients: Postprandial effect on circulating gut peptides, glucose and insulin. 2008; 1348-53