Abstract
Background: In recent years new applications of technologies, including digital images, to capture dietary behaviour in real time have been explored.
Objectives: To validate a digital method for estimating evening meal intake in a free-living adult population, and to examine the feasibility of the method for recording evening meal intake over a prolonged period of time.
Design: The digital method was compared against weighed records of 19 participants’ usual evening meals for five consecutive days. Two trained image analysts independently estimated the weight of individual foods within the meals into major food categories, and the nutrient content was calculated. A second study included interviews with 28 participants recording their evening meals on weekdays for three consecutive weeks to get their perspective on the feasibility of the method.
Results: High correlation coefficients between the digital method and weighed records were found for all measured food categories and nutrients. Comparable means and acceptable limits of agreement (mean difference +/− 2 SD) were found with regard to macronutrient distribution (e.g. fat content −5 to 6 E%), energy density (−75 to 91 kJ/100 g), and energy-adjusted foods (e.g. fruit and vegetable content −241 to 236 g/10 MJ). The majority of the participants expressed satisfaction with the method and were willing to record their evening meals for 1 month or more using the digital method.
Conclusion: The digital method is valid and feasible for evening meal estimation in real-time where a prolonged recording period of participants’ meals is needed.
Introduction
Valid and feasible dietary assessment tools are needed to capture actual food intake and allow for evaluation of intervention studies aiming at improving the diet of different population groups. However, achieving accuracy and precision in assessing dietary intakes is a challenge. There is no ‘one-size-fits-all’ dietary assessment tool appropriate for all research conditions, and there is always a trade-off with the choice of any diet assessment methodology. Several methods are available that possess both strengths and limitations. Traditional methods for assessing dietary intake such as 24-h dietary recalls, diet records, and food frequency questionnaires depend largely on the participants’ memory and/or ability to estimate portion sizes Citation1. Moreover, high intake variation within individuals in nutrient intake poses a challenge for dietary assessment in studies requiring estimates of usual intake under ‘free-living’ conditions Citation2. Weighed records for several days are often regarded as a ‘gold standard’ method for individual level dietary assessment, but this method is time-consuming and demanding for the participants Citation3 and may result in changed eating habits during the survey period.
In recent years new applications of technologies, including digital images, to capture dietary behaviour in real time have been explored Citation4. The use of digital methods seems to be especially useful in out-of-home facilities including laboratory facilities Citation5Citation6 and dining facilities at worksites Citation7, universities Citation8, nursing homes Citation9, and elementary schools Citation10Citation11Citation12. Food and nutrient intake data can be collected from a large group with minimum participant burden and impact on the eating behaviour. The methodology generally involves taking images of participants’ food selection and plate waste by a research team using a standardised procedure. Reference dishes from the dining facility with known weights of individual foods within the meals can be used to estimate the weights of participants’ individual food intake. In an earlier study assessing food intake in worksite canteens, we showed that estimation error is reduced by weighing the dishes before and after eating and hereby obtain an estimate of total weight of food eaten (not published).
With regard to assessing the food intake of free-living individuals, several issues complicate the usability of the digital method. First, it is not possible to take images of reference dishes directly related to the food eaten. Instead a database with reference images of commonly eaten foods can be applied but this may increase estimation error. Second, it requires the participants to take images themselves thereby introducing greater participant burden and potentially lower image quality and compliance, which may also lead to increased estimation errors. Nevertheless, recent validation studies have shown promising results among both children Citation13Citation14 and adults Citation5Citation15 using different camera technologies including disposable cameras, mobile phones, or personal digital assistants with camera. Kikunaga and colleagues Citation15 compared a hand-held digital assistant with camera and mobile phone with weighed diet record as the reference method among college students, and found median nutrient intakes to be comparable. Martin and colleagues Citation5 tested the digital method using a camera-enabled cell phone for total energy estimation among a free-living adult population receiving pre-weighed evening meals to eat at home. Results indicated that the digital method produced reliable estimates of energy intake of the dinner meals. However, as the food was provided by the researchers, the variety of meals was limited and not necessarily representative of the habitual diet.
The objective of the present study was to evaluate the validity of the digital method to assess evening meal intake in an adult population compared with weighed diet records. The evening meal is an important regular event in the lives of the majority of the Danes. It is often considered as the most significant meal of the day and often has special meanings as family meals Citation16. A second objective was to examine, from the participants’ point of view, the feasibility of the digital method for recording evening meal intake over a prolonged period of time.
Methods
The study was performed in accordance with the ethical standards of the Helsinki Declaration of 1975, as revised in 2008, and written informed consent was obtained from all participants.
Validity study
A total of 23 volunteers (11 women and 12 men) were recruited from the local community and personal contacts. The participants’ general characteristics were collected at enrolment. Inclusion criteria were healthy men and healthy non-pregnant women between the ages of 18 and 70 years. The mean age of the participants was 37 (SD 16, range 18 − 69) years and mean BMI was 24 (SD 3) kg/m2. There were 53% that had completed a medium- or long-term higher education.
Each participant was instructed to take images of evening meals for five consecutive week-days and asked to provide recipes according to the digital method procedure. In addition, each participant was instructed to weigh and record individual foods within the meals separately using a Soehnle 8026 digital balance (0–1,000 g = 1 g, 1,000–2,000 = 2 g). Beverages were not included in the analysis. The instruction took place at the participants’ homes or another location convenient to them.
Data from two randomly selected persons (a total of 10 evening meals) were used to train image analysts in weight estimation. These meals were excluded from the validity study. Furthermore, data from two more participants as well as data from seven evening meals from five individuals were excluded due to incomplete weighing of the food items. In total 88 evening meals from 19 participants were included in the validity study.
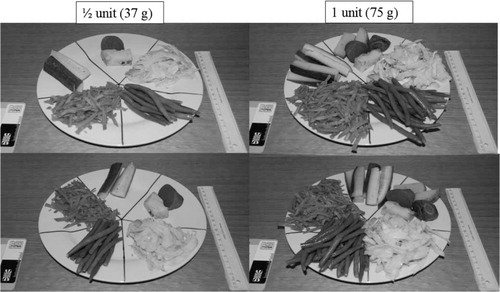
A reference database was developed consisting of 16 different starchy foods, 21 fruit and vegetables, 7 fatty foods and sauces, and 17 meat and composite dishes. The foods were selected to represent the most frequently eaten foods at dinner taking into account foods with different shapes and/or weight densities. Each food was photographed at least three times from different angles and in up to eight different portion sizes from a half to four servings (example in ). Two image analysts working within the area of food and nutrition were trained in portion size estimation. First, they were provided with reference charts containing information about typical portion sizes of different foods and were asked to estimate portion sizes in grams of individual foods (spread, bread, filling, garnish, vegetables, pasta, rice, potatoes, and meat dishes). As part of the training, the computer provided the image analyst with the correct answer after each weight estimation.
Fig. 1. Example of images from the reference material (½ and 1 unit, respectively, of five different vegetable items from two different plate-angles).
Second, the image analysts were asked to estimate the weights of individual foods within various dishes, including the 10 evening meals (data from two of the participants) on the basis of the reference database.
The weights of individual foods within the meals excluding possible leftovers were estimated independently by the two image analysts and recorded into one of the following main food categories covering the whole plate: Citation1 meat and composite dishes; Citation2 fruit and vegetables; Citation3 fatty products inclusive sauces; and Citation4 starchy products such as bread, cereals, rice, pasta, and potatoes. Nutrient calculations were conducted using the computer programme Dankost 3000 (Dansk Catering Center A/S, Denmark) on the basis of average weight estimations of individual foods provided by the two image analysts.
Feasibility study
A total of 28 volunteers (15 women and 13 men) were recruited from a financial company in the Copenhagen area order to evaluate the digital method from the participants’ viewpoint. Inclusion criteria were healthy men and healthy non-pregnant women aged 18 years or older. The mean age of the participants was 40 (SD 6, range 27–52) years and mean BMI was 24 (SD 2) kg/m2. There were 63% that had completed a medium- or long-term higher education. On average, one out of 15 days was not recorded resulting in a compliance rate of 94%.
The participants were instructed to register their evening meals according to the digital method procedure on weekdays for three consecutive weeks. The instruction took place at the company. During the registration period, the participants were offered canteen take-away meals twice a week, which were provided by the company.
Semistructured interviews were conducted by two of the authors (SP and LE) individually at the end of the registration period. The main themes that were covered in relation to the digital method referred to details of how the method was used, pros and cons, as well as reasons for possible change in behaviour, and ethical concerns. All interviews were audio-recorded and transcribed in full. The interviews were coded and analysed by the main author using the template analysis approach Citation19. Some initial codes were created based on the interview question. Further codes were added and modified after exploration of the data. Selected review of the coding was performed by an experienced colleague, and the coding levels as well as the analysis were discussed with the co-authors. The template method was chosen since it works well with 20–30 participants and the discipline of producing the template enables the researcher to take a well-structured approach to handling the data Citation20. Codes were organised in a hierarchical manner onto three levels of coding as shown in . Furthermore, a compliance rate was calculated by dividing the number of recorded meals with the total possible meal number during the recording period.
Table 1. ‘Coding tree’ used to analyse interviews about use of the digital method
Digital method procedure
Participants were instructed verbally and given detailed written information on how to capture images of their evening meals served on plates before eating and again after they had finished eating, including possible leftovers. Images should be taken using the auto function with the provided camera whilst seated at the table pointing the camera at a 45° angle towards the plates. The camera was a Nikon Coolpix S210 with electronic VR image stabilisation and motion detection for sharp, steady results. The camera was precoded with date and participant number. A ruler was provided and placed beside the plate as an internal reference in all images. The participants were asked to keep different meal components separated on the plate, and it was emphasised that images should to be taken of all foods, including extra food portions, if necessary on additional plates, as well as starters, desserts, and beverages. Additionally, participants were provided with a notebook to record the recipes used with ingredients given in either grams or in common household measures like cups, spoons, slices, and so on.
Statistics
Comparisons between the digital and the weighed record methods were done on the log-transformed weight values for the individual food categories and on total energy content to approximate normality. Furthermore, comparisons were made on the energy-adjusted weight values (g/10 MJ) and on energy density (KJ/100 g). Macronutrient intakes were expressed as percentages of energy (E%). Estimation of variance components and subsequent analysis of variance were applied to the test whether a person-effect in taking the images was present.
The modified Bland–Altman analyse for repeated measurements Citation21 was used to assess agreement between methods. This analyse takes into account both the inter-rater variation and the variation of differences between methods. The limits of agreement are defined as two times the corrected standard deviations of the differences above and below the mean. The methods were compared in terms of limits of agreement, mean difference between methods, and possible heterogeneity between the mean weights and estimated differences. In the case of log-transformed data, antilogs of the limits of agreement were calculated to express the intervals (range of percentages). Since nutrient calculation was made on the average estimation values from the two image analysts, no estimate on the inter-rater variation could be obtained in these cases. Therefore, the ordinary Bland–Altman procedure was used with regard to energy and macronutrient distribution.
For comparison of means between the digital and the weighed record methods the Wilcoxson's signed-rank test was used. Furthermore, measurement bias was evaluated by comparing regression slopes where significant deviations from unity would indicate bias. The ability to classify estimated weights and nutrients correctly was examined by cross-classification of quartiles. Finally, the intraclass-correlation coefficient was estimated to assess the inter-rater variability (food categories). In all statistical analyses a significance level of 5% was applied. The SAS Enterprise Guide 4.0 was used for the computations.
Results
Validity study
Mean weights estimated by the digital method were significantly lower for all food categories than those obtained by the weighed record method when expressed as g per meal (log-transformed) (). Likewise, the energy content was significantly underestimated by an average of 11% using the digital method (). However, none of the energy adjusted mean weight values (g/10 MJ) estimated by the digital method differed significantly from the values attained by the weighed record method (), nor did energy density or any of the macronutrients expressed as percentages of total energy.
Table 2. Regression and cross-classification analysis between weights estimated by the digital and by the weighed record methods, respectively, for different food categories (log-transformed and per 10 MJ)
Table 3. Regression and cross-classification analysis between values estimated by the digital and by the weighed record methods, respectively, for total energy intake per meal, energy density, and macronutrient distribution (n = 88)
Lowest correlation coefficients between the digital and weighed record methods were seen in the food categories ‘fatty products and sauces’ and ‘starchy products’ (0.83 when expressed as g/10 MJ). Other measured food categories (g/10 MJ) and nutrients showed correlation coefficients between 0.89 and 0.98 ( and ). Results of the linear regression analysis showed that with regard to the macronutrient distribution, energy content, and density of the meals no bias in regression slopes was seen, except for the protein content (). With regard to the food categories, the fruit and vegetable group expressed as g per 10 MJ and the starchy group expressed as g were not biased below one.
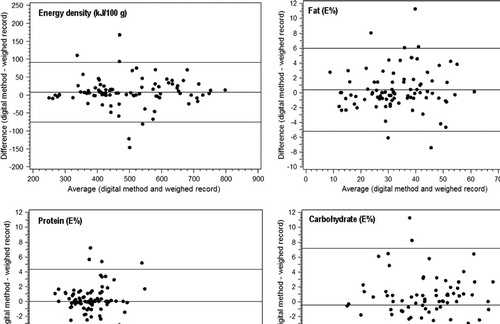
Estimation bias was consistent over different levels of intake as shown by the Bland–Altman plots. Limits of agreement for estimation of fat content ranged from −5 to 6 E%, being respectively, narrower and wider compared to the limits seen for carbohydrate and protein (). With regard to energy content, in 95% of the cases the digital method gave from 60% lower to 20% higher values than the weighed record method (antilog of the log-transformed limits of agreement, not shown), whereas energy density limits of agreements ranged from −75 to 91 KJ/100 g ().
Fig. 2. Bland–Altman plots showing the mean bias (middle line) and limits of agreement (top and bottom lines) between the digital and weighed record methods, respectively, for energy density and macronutrients.
With regard to the fruit and vegetable category limits of agreement when expressed as g per 10 MJ was from −241 to 236, whereas the antilog transformed limits of agreement in g were from −85 to 36% (not shown). An almost similar range of agreement limits were found for the meat category (−32 to 85%), whereas ranges were a little wider for the fat and sauce category (−37 to 108%) and slightly narrower for the starchy category (−29 to 74%; not shown).
The capacity of the digital method to classify weights within the same quartile or adjacent quartile for each food category is shown in and . The proportion of food categories classified into the same quartile ranged from 56 to 78% (expressed as g/10 MJ). With regard to energy content and macronutrient distribution, 64 to 82% of the intakes estimated by the digital method were correctly ranked. The intraclass-correlation coefficient (all food categories) between the two image analysts was 0.96 with a 95 confidence interval from 0.95 to 0.97 (not shown).
Feasibility study
The participants expressed overall satisfaction with the digital method. Participants did not express great difficulties or problems with the digital method. However, one younger single woman said that she found it challenging to fit the digital method into her lifestyle because she often had a quick dinner meal without placing the food on a plate. Many found that it was easy and it quickly became routine. Some even expressed the view that it had been interesting and that the whole family had been involved in the assessment. The most difficult part was apparently to remember to record the intake, particularly when eating out. It was not so much the time it took but rather the attention it required, especially with regard to writing down recipes. In some cases it could also be difficult writing down recipes when the meal was not prepared by the participants themselves. All found it easy to operate the camera and take the images. Some said that they found it awkward not to mix different meal components on the plate and that it was forgotten from time to time.
None of the participants expressed that their eating habits were influenced to any great extent; however some mentioned that they had bigger first servings during the study to avoid second servings. Likewise, extra meal components, sauce, and so on were sometimes not selected in order to avoid taking extra images. Thus, both the type of food chosen and the quantities could be influenced to some degree due to practical concerns. Participants felt that their eating habits were not changed due to increased awareness of their dietary behaviour or as a result of concerns about having other people evaluate their food intake. Only a few mentioned that they felt embarrassed to show what they had for dinner especially at the beginning of the study, and others said that they were uncomfortable with taking images when eating at restaurants or friends’ homes.
All participants completed the 3 weeks of recording. A few mentioned that this was the maximum length of time they would accept. The majority said that 1 or possibly 1.5 months would be acceptable, and about half of the study participants said that an even longer recording period would be acceptable.
Discussion
The present study suggests that the digital estimation method is a valid measure of evening meal intake with regard to macronutrient distribution, energy density, and energy-adjusted food categories compared against weighed records as the reference method. The digital method gave significantly lower values for total energy intake and for all measured food categories when expressed as absolute weights.
Two studies evaluating the validity of the digital method among adults under free-living conditions similarly found significant underestimation of energy intake compared to weighed measures of the same magnitude as seen in the present study Citation5Citation15. This underestimation should be addressed in image analysts’ training programmes in order to improve the accuracy of estimates. Intraclass correlation in the present study showed good agreement between image analysts (intraclass-correlation coefficient 0.96). Others have reported intraclass correlation for inter-rater reliability at about the same level or lower Citation5Citation13Citation14.
High correlation coefficients were found in the present study for all food categories (g/10 MJ), energy content, energy density, and macronutrient distribution (0.87 − 0.98) between the digital and weighed record methods. However, high correlation does not necessarily imply good agreement between methods. A more valid assessment of agreement is provided by a Bland–Altman plot of the differences between the methods against the mean values Citation21. Acceptable limits of agreement were found with regard to both energy density (−75 to 91 KJ/100 g), fruit and vegetable content (−241 to 236 g/10 MJ), and fat E% (−5 to 6 E%) – all being important nutritional factors to consider in evaluating diet quality. Several aspects may influence the level of agreement including the number of hidden or unobservable foods or foods that are highly amorphous and thereby difficult to estimate. Participants in the present study were asked to keep different meal components separated on the plate to improve the accuracy of the estimation process, but this may be difficult to accomplish. Also the weighted diet record may be prone to some degree of error and may explain some discrepancies between estimated and weighed values in this study.
The feasibility study revealed that willingness to record home meal intake using the digital method was high. Compliance rate in terms of proportions of reported meals was 94% and participants expressed satisfaction with the method. Taking the images was not regarded as a problem but recording recipes could be perceived as a bothersome task. Yet, the majority of the participants expressed that they would be willing to record their evening meal intake for 1 or possibly 1.5 months. Wang et al. Citation22 likewise asked participants how long they could continue recording their diet using the so-called Wellnavi instrument – a hand held personal digital assistant with camera. About half of the participants were willing to do so for about 1 month. Higgins and colleagues Citation13 concluded that the digital method they tested was more convenient and less burdensome for children and their families compared to the traditional food diary method, and Boushey et al. Citation23 found that dietary assessment methods using technology (e.g. a personal digital assistant or a camera) were preferred among adolescents compared with the pen and paper record.
The concern that other people would know about their meals was found to be a significant obstacle for the participants in the study by Wang et al. Citation22 using the Wellnavi instrument as dietary assessment method. This may subsequently influence food selection. This aspect was not perceived as a big concern for the present selected participant group. This may be at least partly explained by the long registration period making the recording a routine over time. Another aspect that may influence the food intake is changes in the eating pattern due to the recording of foods (e.g. greater first servings to avoid taking images of a second serving). Participants, however, did not believe that their food intake was altered to any great extent. To limit the interference of the dietary assessment method with the subject's usual dietary behaviour, the digital method procedure was developed to keep the eating situation as close to normal as possible. More studies should investigate the best compromise between accuracy and subject compliance, including the possible change in diet behaviour. Possible ways of improving the accuracy of the method may involve asking participants to weigh the dishes before and after eating to obtain a more precise estimate of total weight of the food, providing specific plate mates, and/or using fixed photograph set-ups to improve image quality.
The digital method may have a broad range of applications including studies that require a long recording period. Multiple days of recording are required to capture individuals’ usual intake under free-living conditions as day-to-day variability in diet is known to be high Citation2. Dietary surveys usually have a duration of 7 days at the most, because participant fatigue otherwise may result in less accurate reporting by the end of the recording period Citation24. The method is potentially useful to evaluate the impact of different intervention programmes and natural experiments on dietary behaviours from diverse population groups across different age and ethnicities, including children and adolescents Citation23Citation25. Compared to the 24-h dietary recall method the digital method does not rely on highly trained interviewers and repeated interviews to get dietary intake information over a number of days. In addition, the food images may be used qualitatively to gain more insight into the food habits of the target population Citation26.
The present study has certain limitations that need to be taken into account. The validation study was a small convenience sample, which is not representative of the adult population as a whole. Moreover, participants in both the validity and the feasibility study were more educated compared to the general adult population. Studies with other population groups are therefore required. Also, the method's ability to record in-between meals and complete dietary intake should be evaluated further. Beverages were not included in the present validation study as Johnson et al. Citation17 suggest that food and drinks should be treated separately, as they have differing effects on satiety and energy intake. Also, the exclusion of beverages in the calculation of energy density increase comparability with other studies Citation17Citation18. This study also has several strong points. The study was conducted in the context of participants’ usual eating environment rather than on specific foods or in laboratory environments. Also, it deals with the validity of the method and with participants’ perspective on the method and its perceived impact on their food intake and behaviour. Challenges of using the digital method include costs in terms of human labour to identify food types and the quantity of the foods. Assessing food ingredients from mixed dishes is a common challenge when assessing dietary intake Citation6 and the images need to be combined with recipe and product reviews in order to measure all aspects of food intake reliably. In the future technological advancements can be expected both in terms of automatic volume calculation and in terms of more advanced cameras and devices to capture intake and get information from participants on product types, recipes, and so on Citation27Citation28Citation29 thereby reducing researcher workload significantly Citation4.
In conclusion, these findings suggest that the digital method is valid for assessing evening meal intake among free-living individuals with regard to macronutrient distribution, energy density, and energy-adjusted foods. Moreover, the method was found to be feasible for assessing evening meal intake over a prolonged period of time.
Conflict of interest and funding
The authors declare no conflict of interest. The project is part of the Canteen Take Away study funded by the Danish Council for Strategic Research, programme for health, food, and welfare.
Acknowledgements
The authors would like to thank all who took part in this survey and Karin Hess Ygil from DTU National Food Institute for supporting the method development work and performing weight estimation, and Anne Vibeke Thorsen from DTU National Food Institute for reviewing the qualitative coding. We also thank Gitte Laub Hansen from The Danish Cancer Society for her active support in conducting the study and Lars Ovesen from Slagelse Hospital, Department of Gastroenterology, for his advice and manuscript review.
Related Research Data
References
- Thompson FE, Subar AF, Loria CM, Reedy JL, Baranowski T. Need for technological innovation in dietary assessment. 2010; 11048-51
- Basiotis PP, Welsh SO, Cronin FJ, Kelsay JL, Mertz W. Number of days of food intake records required to estimate individual and group nutrient intakes with defined confidence. 1987; 1171638-41
- Gibson R.Principles of nutritional assessmentOxford University Press: AucklandNew Zealand; 2005
- Ngo J, Engelen A, Molag M, Roesle J, Garcia-Segovia P, Serra-Majem L. A review of the use of information and communication technologies for dietary assessment. 2009; 101S102-12
- Martin CK, Han H, Coulon SM, Allen HR, Champagne CM, Anton SD. A novel method to remotely measure food intake of free-living individuals in real time: the remote food photography method. 2009; 101446-56
- Williamson DA, Allen HR, Martin PD, Alfonso AJ, Gerald B, Hunt A. Comparison of digital photography to weighed and visual estimation of portion sizes. 2003; 1031139-45
- Lassen AD, Biltoft-Jensen A, Andersen KK, Christensen T, Gille M-B, Tetens I. Validation of a digital photography method for estimating actual lunch consumption at worksite canteens. 7th International Conference on Diet and Activity Methods, Washington, 3–7 June 2009, p. 214 [Program and Abstract book].
- Williamson DA, Allen HR, Martin PD, Alfonso A, Gerald B, Hunt A. Digital photography: a new method for estimating food intake in cafeteria settings. 2004; 924-8
- Simmons SF, Reuben D. Nutritional intake monitoring for nursing home residents: a comparison of staff documentation, direct observation, and photography methods. 2000; 48209-13
- Martin CK, Newton RL Jr, Anton SD, Allen HR, Alfonso A, Han Het al.Measurement of children's food intake with digital photography and the effects of second servings upon food intake. 2007; 8148-56
- Mitchell SA, Miles CL, Brennan L, Matthews J. Reliability of the School Food Checklist for in-school audits and photograph analysis of children's packed lunches. 2010; 2348-53
- Swanson M. Digital photography as a tool to measure school cafeteria consumption. 2008; 78432-7
- Higgins JA, LaSalle AL, Zhaoxing P, Kasten MY, Bing KN, Ridzon SEet al.Validation of photographic food records in children: are pictures really worth a thousand words?. 2009; 631025-33
- Small L, Sidora-Arcoleo K, Vaughan L, Creed-Capsel J, Chung KY, Stevens C. Validity and reliability of photographic diet diaries for assessing dietary intake among young children. 2009; 127-36
- Kikunaga S, Tin T, Ishibashi G, Wang DH, Kira S. The application of a handheld personal digital assistant with camera and mobile phone card (Wellnavi) to the general population in a dietary survey. 2007; 53109-16
- Blake CE, Bisogni CA, Sobal J, Jastran M, Devine CM. How adults construct evening meals. Scripts for food choice. 2008; 51654-62
- Johnson L, Wilks DC, Lindroos AK, Jebb SA. Reflections from a systematic review of dietary energy density and weight gain: is the inclusion of drinks valid?. 2009; 10681-92
- Rolls BJ. The relationship between dietary energy density and energy intake. 2009; 97609-15
- King, N. Template analysis – What is template analysis?; 2004 Available from: www.hud.ac.uk/hhs/research/template_analysis/whatis.htm [cited 10 January 2010].
- King N. Using templates in the thematic analysis of text. In: Symon G, Cassell C. Essential guide to qualitative methods in organizational research. London: Sage; 2004: pp. 256–270.
- Bland JM, Altman DG. Statistical methods for assessing agreement between two methods of clinical measurement. 1986; 1307-10
- Wang DH, Kogashiwa M, Kira S. Development of a new instrument for evaluating individuals’ dietary intakes. 2006; 1061588-93
- Boushey CJ, Kerr DA, Wright J, Lutes KD, Ebert DS, Delp EJ. Use of technology in children's dietary assessment. 2009; 63S50-7
- Lillegaard ITL, Loken EB, Andersen LF. Relative validation of a pre-coded food diary among children, under-reporting varies with reporting day and time of the day. 2007; 6161-8
- Story M, Giles-Corti B, Yaroch AL, Cummins S, Frank LD, Huang TTet al.Work group IV: Future directions for measures of the food and physical activity environments. 2009; 36S182-8
- Keller C, Fleury J, Perez A, Ainsworth B, Vaughan L. Using visual methods to uncover context. 2008; 18428-36
- Sun M, Fernstrom JD, Jia W, Hackworth SA, Yao N, Li Yet al.A wearable electronic system for objective dietary assessment. 2010; 11045-7
- Weiss R, Stumbo PJ, Divakaran A. Automatic food documentation and volume computation using digital imaging and electronic transmission. 2010; 11042-4
- Zhu F, Mariappan A, Boushey CJet al.Technology-assisted dietary assessment. 2008; 68141-10