Background
Studies show inconsistent results with regards to whether eating slower can enhance satiety and reduce intake in a meal. Some methodological differences are apparent and could potentially explain why results are not consistent across studies.
Objective
To determine whether eating slower can enhance satiety and reduce intake when rate of eating is manipulated and not manipulated in a kitchen setting using a sample of participants who exhibit high dietary restraint (HDR).
Design
Two samples of college students who exhibit HDR, which is a group likely to use behavioral strategies to manage intake, were selected in a prescreening session. Participants were told how fast or slow to eat (Variation 1) or allowed to eat at their own pace (Variation 2). Self-reported satiety during the meal and amount consumed was recorded. The types of foods, macronutrient intakes, weights of foods, order of food intakes, and the dimensions of foods were held constant between groups to control for group differences in the sensory and hedonic qualities of the meals.
Results
Eating slower enhanced mid-meal satiety ratings, but only when instructions were given to eat fast or slow (Variation 1). In both variations, eating slower did not reduce amount consumed in the meal, although each variation had sufficient power to detect differences.
Conclusion
Eating slower is not likely to be an effective strategy to control intake in a meal among those exhibiting HDR.
Factors that contribute to satiety (or fullness) are of particular importance to researchers who study the relationship between satiety (i.e. fullness) and food intake. One factor of particular importance is the relationship between eating rate and satiety. Eating rate (i.e. the speed at which participants eat) is hypothesized to influence satiety and food intake, with slower eating rates associated with enhanced satiety and reduced food intake. One hypothesis proposes that eating slower provides time for physiological satiety signals to initiate Citation1 Citation2. A second hypothesis proposes that eating slower decreases feelings of deprivation by enhancing and prolonging pleasurable aspects of eating Citation3. Both hypotheses predict that eating slower will reduce food intake and enhance satiety; however, data to support this prediction have been inconsistent.
Studies that investigate eating rate vary greatly with regards to research design. Specifically, studies using obese and healthy participants vary on their measurement of satiety and manipulation of eating rate. When participants are allowed to eat at their own rate, studies largely show that rate of eating does not influence food intake Citation4 Citation5. When eating rate is manipulated by instructing participants to eat fast or slow, results vary on how these instructions are delivered. Eating slower reduced food intake when researchers manipulated the duration of time between bites in one study Citation6, but the opposite results were observed in a later study Citation7. Others have shown that eating slowly enhances self-reported ratings of satiety, but these studies did not measure food intake Citation8 Citation9.
Studies on eating rate are important because of the possibility of using the rate of eating as a simple and practical intervention for treating eating disorders and groups that exhibit high dietary restraint (HDR). Studies that look at those who are obese or exhibit eating disorders show mixed results Citation10 Citation11 Citation12 , including those described here. However, little research has investigated those exhibiting HDR. Dietary restraint is the intent to control body weight by controlling food intake Citation13 Citation14. Participants exhibiting higher dietary restraint show greater weight loss Citation15 and negative energy balance Citation16 in clinical trials. Whether this group may also be sensitive to manipulations of eating rate has not yet been determined.
The objective of the present study was to test whether eating slower can reduce intake and enhance satiety when HDR participants are instructed how fast or slow to eat and when these participants are allowed to eat at their own pace. Participants with HDR were tested because this group has not yet been tested and appears to be more likely than those with low dietary restraint (LDR) to use behavioral strategies, such as eating slower, to control intake Citation17. Eating disorders were not specifically addressed here.
Materials and methods
The present study tested whether manipulating (Variation 1) or not manipulating (Variation 2) how fast or slow participants ate would influence satiety and how much they consumed in a meal. In each variation, a between-subjects design was employed with at least 16 participants in each group (slow, fast rate of eating). This sample size, although limited, was associated with the ability to detect group effects with power equal to at least . 80 in each variation, which meets standard criteria for having sufficient power to detect effects Citation18. An institutional review board for human participant research approved the procedures for this experiment.
Participants
A total of 76 participants (36 men, 40 women) were recruited through university classroom visits and sign-up sheets. Participants received extra credit in an introductory psychology class for their participation. In Variation 1 (N=40; 20 men, 20 women), participant characteristics were (M±SD) age (20.3±1.4 years), weight (71.7±8.7 kg), height (1.7±0.08 m), and BMI (25.1±2.0 kg/m2). In Variation 2 (N=36; 16 men, 20 women), participant characteristics were age (20.9±2.1 years), weight (73.2±8.4 kg), height (1.7±0.07 m), and BMI (25.5±1.9 kg/m2). In a prescreening session, students completed the three factor eating questionnaire-R18 (TFEQ-R18; Citation19), which includes a 6-item subscale that measures dietary (cognitive) restraint shown to have strong construct validity Citation20. Scores on the 6-item subscale range from 6 to 24 with higher scores indicating greater restraint. Only participants scoring at least 18 on this subscale, i.e. those exhibiting HDR, were included in the experiment. In addition, participants included in this experiment reported no physician or doctor diagnosed food allergies, eating disorders, medical conditions, or other dietary restrictions.
Laboratory kitchen setting
All experimental foods were consumed in a laboratory kitchen setting (length×width×height: 5.5×2.4×2.7 m). As participants entered the kitchen area, they were seated at a small round table (circumference: 0.8 m) with two chairs and a plain tablecloth laid over the table. The kitchen area consisted of a faucet, sink, counter, four cabinets, and a refrigerator. To minimize background noise, the refrigerator was unplugged during each observation period.
Materials and foods
All experimental foods were prepared in the kitchen area. No experimental foods required cooking and so were prepared at refrigerator or room temperature. The experimental foods used in each variation are summarized in . The same foods were used in each variation. In a prescreening, all participants rated that they liked the foods listed in and that they perceived the foods as being both a snack and a meal food. Because meal foods tend to be more filling than snack foods (called cognitive satiety; Citation21), the foods used were meal-snack neutral and therefore minimized the likelihood that cognitive satiety could explain the results.
Table 1. (A) Weight (g) and dimensions (mm) per 125 kcal portion of experimental foods used in Variations 1 and 2. Food weights are given M±SD. Dimensions did not vary between food presentations. (B) Macronutrients (g) of each food portion in Variations 1 and 2
All foods were served on 102 mm paper plates in 125 kilocalorie (kcal) portions. Cold water was served in 266 mL paper cups and more water was available in clear one-quart plastic containers on the table where the participants sat. Although water consumed with food has little effect on food intake Citation22 Citation23, participants were limited to consuming water only after each portion of food was completed to ensure that similar amounts of water were consumed between groups. Two portions at a time of each food item were displayed in the buffet. As portions were selected they were replaced so that two portions of each type of food were always available in the buffet. Hence, the buffet table displayed a total of 10 portions of food for a total of 1,250 kcal (125 kcal per portion×10 portions). To reduce variability of intakes, portion sizes, types of food, weight of foods, order of food intakes, and the dimensions of foods were held constant between groups. The mean weight and dimensions per portion of food and the macronutrients per portion are given in .
Procedures
In Variation 1, participants were randomly assigned to receive instructions to eat fast or slow. The instructions given to participants in each group were adapted from those described by Azrin et al. (2008, p. 359). In the fast rate of eating group, participants were told: ‘Eat quickly until you are full. Specifically consume large amounts with each mouthful. You do not have to fully swallow each mouthful before reaching for the next portion.’ In the slow rate of eating group, participants were told: ‘Eat slowly until you are full. Consume only small amounts of food with each mouthful. Completely swallow each portion before reaching for the next portion, and roll your tongue slowly around the food to savor the full taste before swallowing.’ In Variation 2, no instructions were given. Instead, participants were only asked to eat until they were full or satisfied.
As a manipulation check the researcher who sat with the participant recorded the duration (s) of time spent chewing foods for each participant during the meal using a silent electronic timer. The time began each time a participant put food in their mouth and ended when the observer determined that food chewing had stopped, similar to measures used in previous studies (4, 5). The total time recorded was the duration of time spent chewing for each observation. In Variation 1, chewing durations ranged from 98 to 202 s for the fast rate of eating group; chewing durations ranged from 226 to 360 s for the slow rate of eating group. In Variation 2, the mean time (s) spent chewing was recorded for each participant. Participants taking longer than the mean time were categorized in a slow eating group; participants taking less than the mean time were categorized in a fast eating group. Using this procedure, chewing durations ranged from 110 to 220 s for the fast rate of eating group; chewing durations ranged from 235 to 375 s for the slow rate of eating group.
One participant at a time was brought into the laboratory kitchen setting and seated at the table. All procedures were conducted between 11:00AM and 1:00PM EST. Participants were handed an informed consent and told that they would be served a lunch and would fill out rating packets. After signing the informed consent, participants were instructed to select one plate of each type of food (listed in ) from the buffet and return to the table. Participants selected the five plates to facilitate, as best as possible, experimental realism – the extent to which participants felt as if they were in a buffet or free choice setting. Participants selected one of each type of food to ensure that all participants ate each food in the buffet; hence, each participant had the same five plates of food. The rate of eating instructions for each group were given after a participant was seated with his or her food.
Each plate was numbered from 1 to 5 and contained a 125 kcal portion of food. Participants were told to consume the foods in numeric order. The plates were numbered such that the highest fat, carbohydrate (CHO), and protein portions would be consumed first. Participants were required to consume all of one portion before consuming the next portion. These procedures we used to ensure that participants in each group consumed similar amounts of macronutrients (fats, CHO, proteins) and to ensure that the sensory and hedonic qualities of the experimental foods consumed were similar between the rate of eating groups.
During the meal participants had a rating packet with them. Each page of the rating packet corresponded to the plates of food and contained two 9-point scales. A pleasantness scale ranging from 1 (extremely pleasant) to 9 (extremely unpleasant) was used to check that participants liked each portion of food. A second satiety scale ranging from 1 (extremely full) to 9 (extremely hungry) was used to measure self-reported satiety. Participants gave pleasantness and satiety ratings for each portion of food immediate after finishing each portion, as in previous investigations Citation21. Participants could end their meal at any time that they reported that they were full. If participants consumed the first five portions, they were allowed to return to the buffet one time if they wanted to eat more and were allowed to choose any experimental foods they wanted for this second helping. Half the participants in each group (slow, fast) in each variation chose this option. If participants did not finish the last portion, then the remaining portion was weighed in grams and converted to kilocalories for analysis. All participants indicated that they were full at the end of the meal. Once participants finished their meal, they were given a debriefing form and dismissed. Total observation times varied from 30 to 45 min per observation in each variation.
Statistical analyses
For Variation 1, a Gender (men, women) Rate of Eating (slow, fast) between-subjects analysis of variance (ANOVA) was computed with amount consumed as the dependent variable. Because participants could eat until they were full, self-reports of satiety were tested only at the beginning, middle, and end of the meal. To standardize the middle of the meal for all participants, the middle of the meal was determined based on the average amount consumed by all participants in a given group. To test for differences in self-reports of satiety, the time of rating was added as a within-subjects factor. Two-way ANOVAs were used to check that mean pleasantness ratings of the experimental foods, macronutrient intakes, and the BMI score of participants did not vary by gender or rate of eating.
For Variation 2, a one-way multivariate ANOVA with gender (men, women) as the between-subjects factor was computed with amount consumed (kcal) in the meal, BMI, rate of eating, and mid-meal satiety ratings as the dependent variables. Because rate of eating was a continuous factor and not manipulated, a Pearson correlation was used to determine whether rate of eating, amount consumed in the meal, and satiety ratings were related. To compare results with Variation 1, participants were also grouped into slow and fast rate of eating groups and two-independent sample t-tests were computed with rate of eating (slow, fast) as the between-subjects factor and amount consumed in the meal, satiety ratings, and pleasantness ratings as the dependent measures. Two-way ANOVAs were computed for each macronutrient to determine if macronutrient intakes differed between rate of eating groups or gender. A Bonferroni correction was used to control for experimentwise alpha. All tests were analyzed at a .05 level of significance for both variations.
Results
In Variation 1, mean pleasantness ratings of the experimental foods did not differ between the slow and fast rate of eating groups (p=0.66) and did not differ by gender (p=0.60). BMI of participants also did not differ between groups (p=0.32) and did not differ by gender (p=0.21). Because these factors did not significantly differ between groups or by gender, they were not included in further analyses. A two-way ANOVA with amount consumed (M±SD kcal) as the dependent variable showed only a significant main effect of gender, F(1, 36) = 13.65, p=0.001 (R2=0.26), with women (539±174) consuming fewer calories than men (758±192) in the meal. An analysis of macronutrient intakes showed that men consumed significantly more grams of fat, F(1, 36) = 4.34, p<0.05, and CHO, F(1, 36) = 6.30, p<0.01, than women. No significant differences in macronutrient intakes were evident between the fast and slow rate of eating groups, p>0.40. The amount consumed in the meal (M±SD kcal) did not differ between the slow (627±183) and fast (670±184) rate of eating groups (p=0.46).
An ANOVA with self-reports of satiety as the dependent variable showed a significant main effect of time, F(2, 72) = 551.19, p<0.001 (=0.93), and a significant Time Rate of Eating interaction, F(2, 72) = 4.10, p<0.03 (R2=0.11). Two-independent sample t-tests were computed at each time of rating (beginning, middle, and end of the meal) to analyze the simple main effects. As shown in A for Variation 1, ratings of satiety were significantly lower in the slow rate of eating group only for ratings given in the middle of the meal, t(38) = 2.269, p=0.029 (d=0.72).
Figure 1. Mean satiety ratings in Variation 1 (A) and in Variation 2 (B). An asterisk (*) indicates significance at a .05 level of significance.
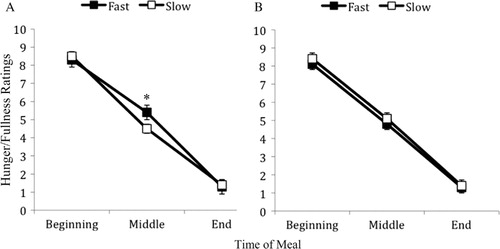
In Variation 2, the ANOVA showed a significant effect of gender, F(1, 34) = 6.46, p=0.016 (R2=0.14), with women (568±166) consuming fewer calories than men (725±154) in the meal (M±SD kcal). An analysis of macronutrient intakes showed that men consumed significantly more grams of fat, F(1, 32) = 5.61, p<0.05, and CHO, F(1, 32) = 7.92, p<0.01, than women. BMI scores (p=0.54), rate of eating (p=0.15) and mid-meal satiety ratings (p=0.17) did not vary by gender. Pearson correlations showed no relationship between rate of eating and calories consumed in the meal (p=0.58), and no relationship between rate of eating and mid-meal satiety ratings (p=0.57). For comparison with the results in Variation 1, the data were also organized into slow and fast eating groups. Mean pleasantness ratings of the experimental foods and macronutrient intakes did not differ between the slow and fast rate of eating groups (p=0.25). Two-independent sample t-tests also showed no significant group differences in amount consumed (p=0.39) or mid-meal satiety ratings (p=0.52; shown in B), consistent with the correlation analysis. The amount consumed (M±SD kcal) was 697±148 (slow group), and 602±157 (fast group). The variances of intakes in both variations were statistically similar between the rate of eating groups indicating that high variability between groups was not likely to account for insignificant data in both variations.
Discussion
The hypothesis that eating slower will reduce intake in participants exhibiting HDR was tested. The results show that eating slower in both variations did not reduce intake in participants exhibiting HDR, which does not support the hypothesis tested here. Mid-meal satiety ratings were significantly different in Variation 1, similar to findings by Azrin et al. (2008), but not in Variation 2, possibly due to demand characteristics resulting from the directions to eat fast or slow given only in Variation 1.
One possible artifact is the discrete portion sizes used in each variation. In both variations, each portion size was discrete (in terms of kcal and dimensions), as is representative of typical human feeding patterns Citation24 Citation25. Participants often judge their fullness based on the size or volume of the food portions they consume Citation26 Citation27 Citation28 , even when the energy density of a portion is held constant Citation27 Citation29. In the present experiment, then, participants may have judged the end of a meal by the number of portions or size of the portions they consumed, which may have overridden rate of eating to control food intake; hence leading to similar intakes between the rate of eating groups. Interestingly, portion size is related to amount consumed in a meal but not ratings of satiety Citation28 Citation30, which is consistent with the results here in that patterns of mid-meal satiety ratings were not consistent between variations.
One limitation is that we did not control for the menstrual cycle of women. However, because women did not show differences between groups (slow, fast) in this experiment, it is unlikely that such a factor was significantly different between groups. One recurring result, however, was that women consumed fewer calories than men in both variations, consistent with previous laboratory studies Citation31. The results show that for men and women exhibiting HDR, this sex difference cannot be explained by the rate at which men and women eat because differences were not observed between groups. Men and women require about 13–18 calories per pound depending on physical activity levels Citation32. Hence, men likely consumed more in each variation because they weighed more than women.
Conclusions
The results in this experiment are the first to show that manipulations of eating rate can enhance satiety, but do not reduce energy intake in participants exhibiting HDR in a laboratory setting where many factors regarding the types and intakes of foods were controlled to reduce variability. Hence, eating slower is not likely to be an effective strategy to reduce intake in a meal among participants exhibiting HDR, which is a group that is likely to use such a behavioral strategy to control food intake.
Conflict of interest and funding
The authors declare no conflict of interest. This research was partly supported by an internally funded Faculty Research Grant awarded to the first author.
References
- Stuart RB. Behavioral control of overeating. 1967; 5: 357-65
- Stuart RB, Davis B.Slim chance in a fat world: behavioral control of obesity. Research Press Co: Champaign IL. 1972
- Brownell KD.The LEARN program for weight management. American Health Publishing: Dallas TX. 20002000
- Spiegel TA, Kaplan JM, Tomassine A, Stellar E. Bite size, ingestion rate, and meal size in lean and obese women. 1993; 21: 131-45
- Spiegel TA. Rate of intake, bites, and chews–the interpretation of lean-obese differences. 2000; 24: 229-37
- Kaplan DL. Eating style of obese and nonobese males. 1980; 42: 529-38
- Yeomans MR, Gray RW, Mitchell CJ, True S. Independent effects of palatability and within-meal pauses on intake and appetite ratings in human volunteers. 1997; 29: 61-76
- Azrin NH, Brooks J, Kellen MJ, Ehle C, Vinas V. Speed of eating as a determinant of the bulimic desire to vomit. 2007; 30: 263-70
- Azrin NH, Kellen MJ, Brooks J, Ehle C, Vinas V. Relationship between rate of eating and degree of satiation. 2008; 30: 355-64
- Andrade A, Minaker T, Melanson K. Eating rate and satiation. 2006; 14Suppl.A6-A7
- Zandian M, Ioakimidis I, Bergh C, Brodin U, Södersten P. Decelerated and linear eaters: effect of eating rate on food intake and satiety. 2009; 96: 270-5
- Martin CK, Anton SD, Walden H, Arnett C, Greenway FL, Williamson DA. Slower eating rate reduces the food intake of men, but not women: Implications for behavioral weight control. 2007; 45: 2349-59
- Herman CP, Polivy L. Anxiety, restraint and eating behavior. 1975; 84: 666-72
- Lawson OJ, Williamson DA, Champagne CM, Delany JP, Brooks ER, Howat PM et al. The association of body weight, dietary intake, and energy expenditure with dietary restraint and disinhibition. 1995; 3: 153-61
- Foster GD, Wadden TA, Swain RM, Stunkard AJ, Platte P, Vogt RA. The eating inventory in obese women: clinical correlates and relationship to weight loss. 1998; 22: 778-85
- Williamson DA, Martin CK, York-Crowe E, Anton SD, Redman LM, Han H et al. Measurement of dietary restraint: validity tests for four questionnaires. 2007; 48: 183-92
- Privitera GJ.The Psychological Dieter: it's not all about the calories. University Press: Lanham MD. 2008
- Cohen J.Statistical power analysis for the behavioral sciences2nd ed. Lawrence Erlbaum: Hillsdale NJ. 1988
- Stunkard AJ, Messick S. The three factor eating questionnaire to measure dietary restraint, disinhibition and hunger. 1985; 29: 71-83
- Anglé S, Engblom J, Eriksson T, Kautiainen S, Saha M-T, Lindfors P, et al.. Three factor eating questionnaire-R18 as a measure of cognitive restraint, uncontrolled eating and emotional eating in a sample of young Finnish females. 2009; 6: 41. 10.3402/fnr.v56i0.10202.
- Capaldi ED, Owens JQ, Privitera GJ. Isocaloric meal and snack foods differentially affect eating behavior. 2006; 46: 117-23
- DellaValle DM, Roe LS, Rolls BJ. Does the consumption of caloric and non-caloric beverages with a meal affect energy intake?. 2005; 44: 187-93
- Rolls BJ, Bell EA, Thorwart ML. Water incorporated into a food but not served with a food decreases energy intake in lean women. 1999; 70: 448-55
- Fernández-Armesto F.Near a thousand tables: a history of food. Free Press: New York NY. 2002
- Ungar PS, Teaford MF.Human diet: Its origin and evolution. Bergin & Garvey: Westport CT. 2002
- Fisher JO, Rolls BJ, Birch LL. Effects of repeated exposure of a large portion-sized entrée on children's eating. 2001; 9: 76S
- Kral TVE, Rolls BJ. Energy density and portion size: their independent and combined effects on energy intake. 2004; 82: 131-8
- Kral TVE. Effects of hunger and satiety, perceived portion size and pleasantness of taste of varying portion size of foods: a brief review of selected studies. 2006; 46: 103-5
- Rolls BJ, Bell EA, Waugh BA. Increasing the volume of food by incorporating air effects satiety in men. 2000; 72: 361-8
- Kral TVE, Roe LS, Rolls BJ. Combined effects of energy density and portion size on energy intake in women. 2004; 79: 962-8
- Rolls BJ, Kim S, McNells A, Fischman MW, Foltin RW, Moran TH. Time course of effects of preloads high in fat or carbohydrate on food intake and hunger ratings in humans. 1991; 260: R756-R763
- Harvard Medical School. Harvard medical school family health guide, In: Komaroff AL, New YorkNY: Free Press; 2004.