Abstract
There is an ongoingFootnote1
1JVK and MTMC contributed equally to this work as first authors.
increase in the availability of foods fortified with micronutrients and dietary supplements. This may result in differing intakes of micronutrients within the population and perhaps larger differences in intakes. Insight into population micronutrient intakes and evaluation of too low or too high intakes is required to see whether there are potential problems regarding inadequacy or excessive intakes. Too low population intakes are evaluated against an estimated average requirement; potential too high population intakes are evaluated against a tolerable upper intake level (UL). Additional health effects, seriousness, and incidence of these health effects are not considered but these can be taken into account in a benefit-risk assessment. Furthermore, authorities would like to regulate food fortification and supplementation in such a way that most of the population is not at risk of potentially high intakes. Several models are available for estimating maximum levels of micronutrients for food fortification and dietary supplements. Policy makers and risk managers need to decide how to divide the ‘free space’ between food fortification and/or dietary supplements, while protecting populations from adverse health effects.Adequate vitamin and mineral intakes are essential for the maintenance of health and disease prevention. Dietary intake is the most important source for micronutrients. A well-known exception to this is vitamin D with relatively small amounts available through dietary sources and status being mainly reliant on exposure to ultra-violet light. The role of optimal nutrition in the prevention of chronic disease is well established and, therefore, diet is recognised as a vital component of disease prevention strategies.
Socio-economic advancements have resulted in rapid changes to diet and lifestyle over the past few decades. Although life expectancy has steadily increased, this has coincided with a dramatic increase in the prevalence of chronic disease. Both too low and too high intakes are associated with adverse health effects. An adverse health effect has been defined as any impairment of a physiologically important function Citation1 and as any change in morphology, physiology, growth, development or life span of an organism that results in impairment of functional capacity or impairment of capacity to compensate for additional stress or increase in susceptibility to the harmful effects of other environmental influences Citation2 Citation3. The prevention of both too low and too high intakes is therefore imperative for the maintenance of health. Current strategies for the modification of population diets that are found to have too low or too high intakes include nutrition education, food fortification, and/or the use of dietary supplements. Careful consideration must be given to any strategies aimed at dietary change ensuring the needs are met for particular subgroups that may have high prevalence of suboptimal or excessive intakes. The need for regulation of specific nutrients depends on the severity of the adverse health effects, taking into consideration all population subgroups. A benefit-risk assessment may be necessary to help predict the impact of varying levels of nutrient intakes on health maintenance, chronic disease prevention, and safe intakes. In this paper we will give an overview of the state of the art on estimation of the prevalence of too low and too high population intakes including population reference intakes (PRI) and tolerable upper intake levels (UL), benefit-risk assessment, and the estimation of maximum safe fortification and supplementation levels.
Population reference intakes and evaluation of too low intakes
The ideal method for the estimation of suboptimal micronutrient intakes is to compare individual habitual micronutrient intake with individual micronutrient requirement. This would allow the demonstration of the proportion of the population with nutrient intakes that are too low. Unfortunately, this method of examination is not possible as individual requirements are unknown Citation4.
The evaluation of micronutrient intakes at a population level has resulted in several (inter)national expert committees setting recommendations for the intake of each micronutrient for their population. Different types of PRI are used, for example, Estimated Average Requirement (EAR), Recommended Daily Allowance (RDA), and Adequate Intake (AI). Although physiological micronutrient requirements are obviously very similar across different countries, the difference in opinions between expert committees has resulted in wide variation in nutrient recommendations within Europe and beyond Citation5–Citation7. This issue highlighted the need for consensus of European micronutrient recommendations. The EURRECA project has proposed a general framework to align the process of establishing micronutrient requirements in Europe Citation8.
Nutritional reference intakes are based on the concept of nutrient requirement. For a micronutrient, the requirement may be defined as the lowest level of habitual intake that will maintain a defined level of nutriture in an individual Citation9. The requirement can be deemed adequate when it prevents the signs of deficiency diseases or when it reduces the risk of chronic diseases Citation9. Requirements vary between individuals. As such, within a population there is a distribution of requirements for every micronutrient for any given definition of adequacy (e.g. prevent classic nutrient deficiency, reduce risk of chronic diseases, or a change in a biochemical parameter). The PRI are generally set for different life stages and gender groups within a population. The EAR () is the daily intake value that is estimated to meet the requirement in 50% of the individuals in a life stage or gender group Citation9. Requirements are usually assumed to be distributed normally Citation10 and the coefficient of variation (SD/mean) of the requirement is generally assumed to be 10% Citation9 to 15% Citation10–Citation12. Once the EAR is set and the requirement distribution is described, the RDA is located at the point on the distribution at which intake is adequate for 97%–98% of the population group. For most micronutrients, assuming a normal distribution of requirements, the RDA can be calculated as the EAR + 2 SD of the requirement or assuming a CV of 10% (or 15%): RDA = 1.2 (or 1.3)×EAR. As the EAR is set for different life stages and gender groups, so is the RDA.
Fig. 1. A normal frequency of distribution of individual requirements for a nutrient. Abbreviations: EAR – estimated average requirements (mean/median requirement of the population); RDA – recommended daily allowance (mean requirement plus 2 SD – the intake that meets the needs of 97%–98% of healthy individuals in a population).

A frequently encountered misconception in evaluating the prevalence of inadequate intakes is comparing habitual intakes with RDA values. The RDA values are already more than adequate for almost all in the population. Therefore, the proportion of the population with intakes below the RDA is not equal to the proportion with inadequate intakes Citation4. The proportion of the population for which intake is inadequate may correctly be estimated using the EAR cut-point method Citation13 Citation14. The proportion of the population with intakes below EAR has been shown to be a realistic estimate of the prevalence of suboptimal dietary intakes in a population Citation14. It is important to notice that there are some assumptions underlying the EAR cut-point method. When these assumptions are not met the EAR cut-point method will give a biased estimate of the prevalence of inadequate intakes Citation14 Citation15.
An alternative to assess the prevalence of inadequate intake is the probability method Citation14 Citation16. In this method, given a distribution of requirements a risk curve is computed. This risk curve associates certain intake levels with the risk of inadequate intake. The prevalence of inadequate intakes is then estimated by combining the habitual intake distribution with the risk curve. Again, several assumptions are made in this method and it is required to have the distribution of requirements. Assumptions on, for instance, the shape of the requirement distribution will highly influence the outcome of the prevalence estimate. A drawback is that the EAR values (and other PRIs) are currently set in age-steps rather than continuously over ages. Therefore evaluation of dietary intakes is also in age-steps, rather than continuously over ages. In order to overcome age-steps, recently a continuous methodology was developed, which more readily reflects continuous requirements over life Citation17; however, this method does need PRIs set continuously over ages.
When an EAR cannot be estimated, a less precise reference intake is often estimated e.g. the AI Citation9. This measure cannot be used to evaluate inadequate intakes in a population quantitatively because the relationship of such reference values to the requirement for the nutrient is unknown. Only a qualitative statement can be made; if the median habitual intake is at or above the AI, the prevalence of too low intakes can be stated to be ‘low’, whereas no statement can be made if the median habitual intake is below the AI Citation15.
Tolerable upper intake levels and evaluation of high intakes
Besides inadequate intakes due to too low micronutrient intakes, excessive intakes may also result in adverse health effects. In order to be able to evaluate and manage potential excessive micronutrient intake, several (inter)national committees, for example the European Food Safety Authority (EFSA) and Institute of Medicine (IOM), have set tolerable upper intake levels (ULs) Citation1 Citation18. The UL is the maximum level of total chronic daily intake of a nutrient (from all sources, including foods, water, nutrient supplements, and medicines) judged to be unlikely to pose a risk of adverse health effects to almost all individuals in the general population Citation18. ‘Tolerable’ implies a level of intake that can be tolerated physiologically by humans. Like PRI values, ULs may be derived for various life stage groups in the population (e.g. adults, pregnant and lactating women, infants, and children). The UL is not a recommended level of intake but is an estimate of the highest level of habitual intake that carries no appreciable risk of adverse health effects. It is important to realise that the UL is a different type of measure than an EAR. It cannot be stated that the proportion of the population with micronutrient intakes above the UL has too high intakes; however, they are potentially at risk as having too high intakes and, as a consequence, potentially at risk of adverse health effects.
There is an established paradigm for determining safe intakes of foreign compounds, such as food additives, based on the dose-response relationship for adverse health effects in animals or humans Citation19. A similar paradigm can be applied for micronutrients Citation20. However it should be taken into account that, different from foreign compounds, micronutrients are subject to homeostatic control whereby the body content is regulated over a range of intakes. Homeostasis reduces not only the risk of depletion of body pools when intakes are low, but also reduces the risk of excessive accumulation when intakes are high. Furthermore, unlike foreign compounds, nutrients are also required at a certain dose. For most types of toxicity from either foreign compounds or nutrients, there is believed to be a threshold dose (or intake) at and below which adverse health effects do not occur. Uncertainty factors are used to allow, for instance, human variability and species differences when necessary Citation19.
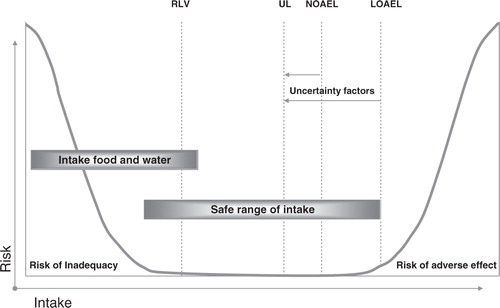
The risk-assessment paradigm consists of four steps: hazard identification, hazard characterisation, exposure assessment, and risk characterisation Citation18. The first two steps of the risk assessment paradigm are required for determining the UL. In the last two steps the intake levels are evaluated. The initial step of hazard identification includes the collection and evaluation of all micronutrient information relating to the capacity of the micronutrient to potentially cause adverse health effects. The next step, hazard characterisation, a dose-response assessment (or otherwise a semi-quantitative evaluation) is performed taking into account the scientific uncertainties. The UL can be derived from this dose-response curve. The traditional approach in setting the UL is to first find the no-observed adverse effect level (NOAEL), which is the highest intake of a micronutrient at which the adverse health effect(s) has not been observed (). If there are no data to demonstrate a NOAEL, as an alternative, a lowest-observed adverse effect level LOAEL may be used. This is the lowest intake of a micronutrient at which the adverse health effect has been observed. Where different adverse health effects occur, for each health effect, a NOAEL (or LOAEL) can be derived and these may differ. The health effect with the lowest NOAEL is called the critical effect and is used for the derivation of the UL. The NOAEL (LOAEL) is surrounded by several scientific uncertainties due to, for instance, extrapolations from animals to humans. To correct for these uncertainties, an uncertainty factor is applied to the NOAEL in order to derive the UL. The higher the uncertainty, the higher the uncertainty factor and, consequently, the lower the UL. As micronutrients are essential dietary constituents, the population reference intakes (nutritional needs) should be kept in mind when setting the UL. Due to a high uncertainty factor, caution must be taken not to estimate the UL below the PRI, which also could result in undesired health effects.
Fig. 2. Theoretical description of adverse health effects of a nutrient as a result of too low or too high intakes. Abbreviations: NOAEL – no observed adverse effect level; LOAEL – lowest observed adverse effect level; UL – tolerable upper intake level; RLV – reference labelling values (RDA – recommended daily allowance for labelling purposes).
Similar to population reference intakes, ULs are derived for all groups of the general healthy population, including sensitive individuals, throughout the life stage. Upper intake levels have been derived for a number of micronutrients Citation1 Citation9 Citation18 Citation21–Citation25 (). Experience has shown that it is not always possible to establish a UL for a micronutrient for different reasons: (a) evidence of the absence of any adverse health effects even at high intakes e.g. vitamin B1 Citation18, (b) absence of evidence of any adverse effect (which does not necessarily mean that there is no potential for adverse effects resulting from high intake) e.g. biotin Citation18, and (c) evidence of adverse effects but insufficient data on which to base a dose-response assessment e.g. β-carotene Citation24 and manganese Citation2.
Table 1. Health effects and tolerable upper intake levels of vitamins, minerals and trace elements
Benefit-risk assessment of vitamins and minerals
Many micronutrients have adverse health effects at both too low and too high intakes. Besides classical deficiency symptoms, there is promising evidence that micronutrient intakes are also associated with reduced risks on other health effects (e.g. chronic diseases). The levels associated with this risk reduction may be higher than the levels required to prevent classic deficiency symptoms and may also be different for subpopulations. On the other hand, the UL is set in a way that even the most sensitive subjects are protected. Seriousness of the adverse health effect, incidence at a specific dose, and in subpopulations are not taken into account. Balancing all these benefits and risks is an important issue for policy makers and the food industry. Especially, as there is an ongoing increase of availability of over-the-counter dietary supplements and (voluntary) fortified foods. This may result in increased differences in micronutrient intakes within populations.
For a long time the process of risk assessment and benefit assessment of micronutrients have been separate processes Citation12 Citation26. It is increasingly recognised that an integrated benefit-risk assessment approach is required Citation27–Citation32. A benefit-risk comparison weighs potential health advantages versus health disadvantages, thereby allowing for a better-informed choice from a public health perspective Citation29 Citation33. Benefit-risk assessment begins with a question relating to a whole diet, a food or a food component (e.g. micronutrient), and the positive/negative health effects associated with it. Hoekstra et al. Citation29 Citation30 have proposed an integrated benefit-risk model that allows the assessment of both beneficial and hazardous effects of a micronutrient with balancing potential health risks and health benefits using the common health measure disability adjusted life years (DALYs). The model was mirrored on the established paradigm for risk analysis Citation28 and consisted of Citation1 hazard and benefit identification, Citation2 hazard and benefit characterisation through dose-response functions, Citation3 exposure assessment, and Citation4 benefit-risk integration using a common health measure (DALYs). The case study showed how the benefit-risk approach may assist in decisions on any voluntary or obligatory food fortification programmes. It also illustrated general problems regarding data demands, assumptions, and uncertainties Citation29 Citation30. The use of a benefit-risk model as demonstrated by Hoekstra et al. Citation30 provides an insightful opportunity for policy makers to assess the potential health impact of, for instance, food fortification. However, a similar approach can be applied for other nutritional questions balancing health benefits and risks.
It has been noted that a benefit-risk analysis may not always be necessary or even possible, given the amount/lack of data available on a given area. The EFSA has suggested that a benefit-risk analysis should only be performed when a substantial public health impact is expected Citation28 Citation33. Fransen et al. Citation33, Hoekstra et al. Citation29 Citation33, and EFSA Citation28 have proposed a tiered approach for the benefit-risk assessment of foods. These tiered approaches use the same four benefit-risk steps as the model of Hoekstra et al. Citation30. The key aspect of the tiered approach is the use of several ‘stop’ moments, depending on whether the information gathered is sufficient to address the initial benefit-risk question. The use of such an approach allows a case-by-case assessment and enables the policy maker to decide when to stop or to continue with a benefit-risk assessment Citation28 Citation29 Citation33.
Safe addition of vitamins and minerals to foods and supplements
The proliferation in the production and use of (voluntary) fortified foods and dietary supplements has required regulation of these products to ensure the safety of the whole population from unacceptably high intakes. Regulation is needed, for example, to define which chemical form of a nutrient is allowed in these products and the amount of a nutrient that can be added. Within the EU there is existing legislation for the addition of micronutrients to foods (Regulation 1995/2006) Citation34 and food supplements (Directive 2002/46) Citation35. However the allowed levels of nutrients are currently under discussion and not defined.
The first step in setting maximum nutrient levels for food fortification and supplementation is to define what ‘free space’ is available for each nutrient next to dietary intake from a regular diet (excluding voluntary fortification and dietary supplements). This ‘free space’ is the maximum amount of a nutrient that is available for total intake from food fortification and dietary supplements. The logical next step is how to divide this ‘free space’ over foods to be fortified and dietary supplements. This can be in any ratio, from 100% for food fortification to 100% for dietary supplements (). This decision is one of risk management or policy, unlike science. Whatever ratio is chosen, it has an effect on the final maximum levels allowed in food fortification and dietary supplements Citation36.
Fig. 3. Free space for the addition of vitamins and minerals to foods and supplements. Abbreviations: UL – tolerable upper intake level; RDA – recommended daily allowance.

Several models have been developed to estimate the maximum level of a nutrient for food fortification level and in dietary supplements Citation36–Citation41. In all these models the UL is used as an upper limit for the total intake to make sure that the high intake will not harm public health. From the (age-specific) population nutrient intake distribution, a specific percentile of intake is chosen to represent the intake from a regular diet (i.e. without voluntary fortification and dietary supplements). Often the 95th percentile is used, as subjects with a high intake should be protected from excessive intakes due to additional consumption of fortified foods and/or dietary supplements. However, in theory any other percentile can be considered. The ‘free space’ is then the difference between the UL and the regular intake at the 95th percentile. As both UL and intake differ between age-gender groups, this should be calculated for each group separately. Furthermore, as a decision is made about the distribution ratio of the ‘free space’ for food fortification and/or dietary supplements the maximum amounts can be calculated. For dietary supplements, this is a straight forward method as the maximum amount is the maximum level that may be available in one daily dose. For food fortification, it is less straight forward as the maximum amount available for food fortification should be divided over many foods. In the different models this is solved by estimating a maximum fortification level per food portion or per 100 kcal of a food Citation37–Citation40. In addition, a maximum proportion of the energy intake that may and will be fortified or a maximum number of food portions to be fortified can be estimated.
Conclusion
This paper gives an overview of the state of the art on issues related to too low and too high intake of micronutrients. It is important to have insight into the population micronutrient intake as both too low and too high intakes may be associated with adverse health effects and should be prevented or balanced. Insight into population intake distributions may assist policy makers on how to achieve adequate intakes in the whole population (not too low or too high). Helpful tools are PRIs and ULs that are set by different (inter)national expert committees; however, large differences exist. Harmonisation of methodologies to set threshold levels (PRI, UL) is needed and is an ongoing process Citation5 Citation6 Citation8. More and more knowledge on associations between micronutrient intake or status and health effects is gathered Citation42. This may result in conflicting advice at a population level as what is beneficial for one specific subpopulation may be harmful for another subpopulation. In a benefit-risk assessment the effect on subpopulations, the seriousness, and incidence of a health effect will be taken into account to balance the beneficial and harmful health effects. Such a benefit-risk assessment will give insight into the different health effects in more detail and will result in better informed decision making. Nevertheless, a full benefit-risk assessment is not always needed.
In the EU, setting maximum levels for addition of vitamins and minerals to foods and dietary supplements is currently under discussion. Although several models have been proposed, it remains difficult to set one maximum value for the whole of Europe. The setting of maximum levels is a task where scientists need to advise policy makers. Some of the decisions that have to be made, for example, which part of the population are protected from too high intakes and how to divide the ‘free space’ over fortification and/or dietary supplements, need to be a priority by risk managers. Scientists should assist this process by showing the impact of a specific choice.
Conflict of interest and funding
The authors have not received any funding or benefits from industry or elsewhere to conduct this study.
Notes
1JVK and MTMC contributed equally to this work as first authors.
References
- Institute of Medicine: FNB. Dietary reference intakes: a risk assessment model for establishing upper intake levels for nutrients. WashingtonDC: National Academies Press; 1998.
- Scientific Committee on Food: European Commission(2000): Opinions of the scientific committee for food (arsenic, barium, fluoride, boron and manganese in natural mineral waters). European Commission: Reports of the Scientific Committee for Food – Food Science and Techniques. Luxembourg.
- World Health Organisation. Assessing human health risks of chemicals. Derivation of guidance values for health based exposure limits. Geneva: World Health Organisation; 1994. http://www.inchem.org/documents/ehc/ehc/ehc170.htm [cited 16 August 2011].
- Carriquiry AL. Assessing the prevalence of nutrient inadequacy. 1999; 2: 23-33. 10.3402/fnr.v56i0.5728
- Doets EL, de Wit LS, Dhonukshe-Rutten RAM, Cavelaars AEJM, Raats MM, Timotijevic L et al. Current micronutrient recommendations in Europe: towards understanding their differences and similarities. 2008; 47: 17-40. 10.3402/fnr.v56i0.5728
- King JC, Garza C. International harmonization of approaches for developing nutrient-based dietary standards – introduction. 2007; 28: S13-S15
- Prentice A, Branca F, Decsi T, Michaelsen KF, Fletcher RJ, Guesry P et al. Energy and nutrient dietary reference values for children in Europe: methodological approaches and current nutritional recommendations. 2004; 92: S83-S146. 10.3402/fnr.v56i0.5728
- Dhonukshe-Rutten RAM, Timotijevic L, Cavelaars A, Raats MM, de Wit LS, Doets EL et al. European micronutrient recommendations aligned: a general framework developed by EURRECA. 2010; 64: S2-S10. 10.3402/fnr.v56i0.5728
- Institute of Medicine: Standing Committee on the Scientific Evaluation of Dietary Reference Intakes FNB. Dietary reference intakes for calcium, phosphorus, magnesium, vitamin D, and fluoride. WashingtonDC: National Academies Press; 1997.
- Scientific Committee on Food: European Commission. Nutrient and energy intakes for the European Community. Reports of the Scientific Committee for Food – Food Science and Techniques. Commission of the European Communities, Luxembourg, 1993; http://ec.europa.eu/food/fs/sc/scf/out89.pdf [cited 16 August 2011].
- Great Britain Department of Health. Dietary reference values for food energy and nutrients for the United Kingdom. London: Department of Health; 1991.
- Renwick AG, Flynn A, Fletcher RJ, Muller DJG, Tuijtelaars S, Verhagen H. Risk-benefit analysis of micronutrients. 2004; 42: 1903-22. 10.3402/fnr.v56i0.5728
- Beaton GH.Criteria for an adequate dietModern nutrition in health and disease8th edShils M, Olson JA, Shike MLea & Febiger: Philadelphia PA. 19941491-1505
- Carriquiry AL. Estimation of usual intake distributions of nutrients and foods. 2003; 133: 601S-608S
- Institute of Medicine. Dietary reference intakes. Applications in dietary assessment. WashingtonDC: National Academies Press; 2000.
- National Research Council. Nutrient adequacy. Assessment using food consumption surveys. WashingtonDC: National Academies Press; 1986.
- Waijers P, Dekkers ALM, Boer JMA, Boshuizen HC, van Rossum CTM. The potential of AGE MODE, an age-dependent model, to estimate usual intakes and prevalences of inadequate intakes in a population. 2006; 136: 2916-20
- European Food Safety Authority. Tolerable upper intake levels for vitamins and minerals. European Food Safety Authority, Parma, Italy, 2006; http://www.efsa.europa.eu/EFSA/Scientific_Document/upper_level_opinions_full-part33.pdf [cited 16 August 2011].
- Edler L, Poirier K, Dourson M, Kleiner J, Mileson B, Nordmann H et al. Mathematical modelling and quantitative methods. 2002; 40: 283-326. 10.3402/fnr.v56i0.5728
- Smith M, Comm FS. Food safety in Europe (FOSIE): risk assessment of chemicals in food and diet: overall introduction. 2002; 40: 141-44. 10.3402/fnr.v56i0.5728
- EGVM (Expert Group on Vitamins and Minerals). Report on safe upper levels for vitamins and minerals. London: Food Standards Agency; 2003. http://www.foodstandards.gov.uk/multimedia/pdfs/vitmin2003.pdf [cited 16 August 2011].
- Food and Nutrition Board. Institute of Medicine. Dietary reference intakes for vitamin A, vitamin K, arsenic, boron, chromium, copper, iodine, iron, manganese, molybdenum, nickel, silicon, vanadium and zinc. WashingtonDC: National Academies Press; 2001.
- Institute of Medicine: Standing Committee on the Scientific Evaluation of Dietary Reference Intakes FaNB. Dietary reference intakes for thiamin, riboflavin, niacin, vitamin B6, folate, vitamin B12, pantothenic acid, biotin, and choline. WashingtonDC: National Academies Press; 1998.
- Scientific Committee on Food: European Commission. Guidelines of the scientific committee on food for the development of tolerable upper intake levels for vitamins and minerals. Brussels: European Commission Health & Consumer Protection Directorate-General; 2000.
- Scientific Committee on Food. Opinion of the scientific committee on food. Tolerable upper intake levels of vitamin D. Brussels: Scientific Committee on Food; 2002.
- Meltzer HM, Aro A, Anderson NL, Koch B, Alexander J. Risk analysis applied to food fortification. 2003; 6: 281-91. 10.3402/fnr.v56i0.5728
- Cohen JT, Bellinger DC, Connor WE, Kris-Etherton PM, Lawrence RS, Savitz DA et al. A quantitative risk-benefit analysis of changes in population fish consumption. 2005; 29: 325-34. 10.3402/fnr.v56i0.5728
- European Food Safety Authority. Report of the public consultation on the EFSA draft guidance on human health risk-benefit assessment of foods. 2010; 8: 1674 [48 pp.].
- Hoekstra J, Hart A, Boobis A, Claupein E, Cockburn A, Hunt A, et al.. BRAFO tiered approach for benefit-risk assessment of foods. Food Chem Toxicol2010; 27 May 2010; DOI: 10.1016/j.fct.2010.05.049.
- Hoekstra J, Verkaik-Kloosterman J, Rompelberg C, van Kranen H, Zeilmaker M, Verhagen H et al. Integrated risk-benefit analyses: method development with folic acid as example. 2008; 46: 893-909. 10.3402/fnr.v56i0.5728
- van Kreijl CF, Knaap AGAC, van Raaij J.Our food, our health: healthy diet and safe food in the Netherlands. National Institute for Public Health and the Environment (RIVM): The Netherlands. 2006
- Hendriksen MA, Tijhuis MJ, Fransen HP, Verhagen H, Hoekstra J. Impact of substituting added sugar in carbonated soft drinks by intense sweeteners in young adults in the Netherlands: example of a benefit-risk approach. 2011; 50: 41-51. 10.3402/fnr.v56i0.5728
- Fransen H, de Jong N, Hendriksen M, Mengelers M, Castenmiller J, Hoekstra J et al. A tiered approach for risk-benefit assessment of food. 2010; 30: 808-16. 10.3402/fnr.v56i0.5728
- The European Parliament and the Council of the European Union. Regulation (EC) No 1925/2006 of the European Parliament and of the Council of 20 December 2006 on the addition of vitamins and minerals and of certain other substances to foods. Official J Eur Union; 2006, L404. http://eurlex.europa.eu/LexUriServ/site/en/oj/2006/l_404/l_40420061230en00260038.pdf [cited 16 August 2011].
- European Commission Directive. 2002/46/EC of the European Parliament and of the Council of 10 June, 2002 on the approximation of the laws of the Member States relating to food supplements. Official Journal of the European Communities; 2002, P0051–P0057. http://eur-lex.europa.eu/LexUriServ/LexUriServ.do?uri = CELEX:32002L0046:EN:NOT [cited 16 August 2011].
- ILSI Europe. Micronutrient landscapes of Europe: comparison of intakes and methodologies with particular regard to higher consumption. Brussels: ILSI Europe Addition of Nutrients to Food Task Force; 2009.
- Domke A, Grossklaus R, Niemann B, Przyrembel H, Richter K, Schmidt E, et al.. Use of minerals in foods: toxicological and nutritional physiological aspects. Berlin: Federal Institute for Risk Assessment; 2006, pp. 189–226.
- Flynn A, Moreiras O, Stehle P, Fletcher RJ, Muller DJG, Rolland V. Vitamins and minerals: a model for safe addition to foods. 2003; 42: 118-30. 10.3402/fnr.v56i0.5728
- Kloosterman J, Fransen HP, de Stoppelaar J, Verhagen H, Rompelberg C. Safe addition of vitamins and minerals to foods: setting maximum levels for fortification in the Netherlands. 2007; 46: 220-29. 10.3402/fnr.v56i0.5728
- Rasmussen SE, Andersen NL, Dragsted LO, Larsen JC. A safe strategy for addition of vitamins and minerals to foods. 2006; 45: 123-35. 10.3402/fnr.v56i0.5728
- Richardson DP. Risk management of vitamins and minerals: a risk categorisation model for the setting of maximum levels in food supplements and fortified foods. 2007; 4: 51-66. 10.3402/fnr.v56i0.5728
- Verhagen H, Vos E, Francl S, Heinonen M, van Loveren H. Status of nutrition and health claims in Europe. 2010; 501: 6-15. 10.3402/fnr.v56i0.5728