Abstract
Background: Social and environmental changes have accompanied the ongoing rapid urbanisation in a number of countries during recent decades. Understanding of its role in the health-risk transition is important for health policy development at national and local level. Thailand is one country facing many of the health challenges of urbanisation.
Objective: To identify potential associations between individual migration between rural and urban areas and exposure to specific social, economic, environmental and behavioural health determinants.
Design: Baseline data from a cohort of 87,134 Thai open university students surveyed in 2005 (mean age 31 years). Four urbanisation status groups were defined according to self-reported location of residence (rural: R or urban: U) in 2005 and when the respondent was 10–12 years old (yo).
Results: Fourty-four percent were living in rural areas in 2005 and when they were 10–12yo (Group RR: ruralites); 20% always lived in urban areas (UU: urbanites); 32% moved from rural to urban areas (RU: urbanisers); 4% moved in the other direction (UR: de-urbanisers). The ruralites and urbanites often were the two extremes, with the urbanisers maintaining some of the determinants patterns from ruralites and the de-urbanisers maintaining patterns from urbanites. There was a strong relationship between urbanisation status, from RR to RU to UR to UU, and personal income, availability of modern home appliances, car ownership, consumption of ‘junk food’ and physical inactivity. Urbanisers reported worse socio-environmental conditions and worse working conditions than the other groups. De-urbanisers had the highest rates of smoking and drinking.
Conclusions: An urbanisation measure derived from self-reported location of residence gave new insights into the health risk exposures of migrants relative to permanent rural and permanent urban dwellers. Living in urban areas is an important upstream determinant of health in Thailand and urbanisation is a key element of the Thai health-risk transition.**‘self-reported’ urbanisation
Introduction
The social and environmental changes that accompany urbanisation are important determinants of health in contemporary society Citation1Citation2. Modern cities can bring population health gains through physically safer jobs, dietary diversity, preventive health programmes and environmental improvements. Simultaneously, the added density of cities encourages health problems: hastily erected housing, stressed waste disposal systems and air pollution due to increasing use of automobiles Citation2. Cities provide the settings in which the consumption of novel commodities and behaviours are learned. As city dwellers become more affluent, they encounter new risks from their consumption-oriented activities, as distinct from earlier risks arising from their living and working conditions. New health risk activities include smoking, saturated fat consumption, excessive alcohol intake, physical inactivity and hazardous motor vehicle use. Despite the various urban health risks, rural people are attracted to cities due to opportunities for a better life through employment and upward economic mobility Citation3. Worldwide, urbanisation has reached the point where more than half of the world's population live in urban areas, with much of this growth being due to migration from rural areas Citation4.
Rapid urbanisation is particularly apparent in developing countries Citation5Citation6. Although still primarily a rural country Citation7, Thailand has been through a major urbanisation process during recent decades Citation8. The transition of much of Thailand from a predominantly rural and agricultural country to an increasingly urban country with an industrial and service economy must have a profound impact on social conditions and other health determinants that are part of the Thai health-risk transitionFootnote1 Citation9. There is documentary evidence for a range of health-damaging consumption practices in Thailand today, including food, alcohol and drug consumption Citation10.
Urbanisation is recognised as a driver for the globally changing health hazard panorama with specific proximate social, economic, environmental and behavioural health risks developing in the wake of urbanisation Citation11Citation12. A fundamental challenge in urbanisation studies is the absence of an accepted standard for the classification of urban environments Citation5. These difficulties extend to assessing the impact of urbanicity (how urban a place is) which itself is not well defined Citation13Citation14. Urbanisation studies can be categorised into those that: Citation1 focus on urban–rural comparisons; Citation2 consider rural to urban migration; and Citation3 consider particular population groups within the city (urban inequalities) Citation15. In rapidly urbanising countries that are opening up to Western market influences, urbanisation studies of the role of rural–urban migration on health-related behaviours are urgently needed Citation15.
Here we report on a large national cohort of 87,134 adults in the Thai Cohort Study (TCS), first surveyed in 2005, to examine the role of urbanisation in the Thai health-risk transition. The 20-page baseline questionnaire covered seven domains: (A) socio-economic status and domestic environment in the present and past; (B) income and work; (C) self-reported health, injuries and health service use; (D) social networks and well-being; (E) food and physical activity; (F) tobacco, alcohol and transport; and (G) family Citation16. Questions about present and past location of residence provided a unique four-level measure of individual migration between rural and urban areas (‘urbanisation’).
The aim of this paper is to describe the associations between urbanisation and exposure to the entire hierarchy of health determinants, from distal socio-environmental conditions to mid level determinants and proximate lifestyle and behavioural factors as well as health outcomes.
2 Methods
A large national cohort study of the health-risk transition in Thailand began in 2005 with a questionnaire survey of Thai residents aged 15–87 years enrolled as students at the Sukhothai Thammathirat Open UniversityFootnote2 (STOU) Citation16. About 200,000 students were approached and 87,134 replies were received. The personal characteristics of STOU students was well represented by the cohort respondents. Age, sex, marital status and geographical location were all reported for the whole student body in 2005 and proportions in each category were very similar to those noted for the cohort. Further details about the methods of questionnaire data collection are given in Sleigh et al. (2007) Citation16.
2.1 The urbanisation variable
Respondents were asked to report whether their present location of residence was rural (R) or urban (U) and also on the location of their residence when they were 10–12 years old (yo) (again, R or U). We defined four urbanisation status groups by classifying individuals according to the four possible U and R combinations: RR (n=37, 735), RU (n=27, 422), UR (n=3, 706) and UU (n=17, 145). From hereon, we refer to the RR group as ‘ruralites’, the RU group as ‘urbanising’, the UR group as ‘de-urbanising’ and the UU group as ‘urbanites’.
2.2 Health determinants and outcomes
shows the hierarchy of determinants that may be influenced by urbanisation. These were chosen to represent high, mid and proximate level health determinants in a conceptual ‘cause-effect’ framework similar to those developed by WHO in recent years Citation17Citation18. The table also shows the indicators examined at each determinant level, selected from the variables in the TCS baseline questionnaire.
Table 1. Conceptual framework for health determinants at different levels in relation to health outcomes with potential links to urbanisation
The high-level (socio-economic) health determinants in the questionnaire were primary education, income and employment, and the housing conditions and the possession of household appliances that are closely associated with a person's economic status. The mid-level (environmental) determinants included aspects of the neighbourhood physical and social environment, and hazards in the workplace. The most proximate (behavioural) health determinants were diet, physical activity and health-damaging practices. As indicators of potential health outcomes, we included three types of self-reported health status variables: metabolic health states, general and mental health and injuries.
For all these indicators the exact questions asked and the criteria used are given in conjunction with the description of figures given in the ‘Results’ section. In converting the variables to binary indicators, cutpoints were chosen by balancing various considerations, including standard practice, common sense and the cutpoint to best highlight the point being made.
2.3 Statistical analyses
Subjects with missing information on age, sex, location of residence now or when 10–12yo were excluded, leaving 86,008 subjects in the analysis sample. The results comprise analyses of 36 (binary) variables, the selected indicators of health determinants and outcomes. The core results are presented graphically in Figs. as prevalences of each indicator by sex, age group and urbanisation status. Confidence intervals are not shown in the figures because they are very small due to the large sample size (all sample sizes were over 75,000). To illustrate the precision achieved, confidence intervals for the analyses with the smallest sample size (‘working extended hours’) are shown in the text. Chi-squared tests were used to test for differences between groups and to ascertain the existence of linear trends. For clarity of presentation, p-values have not been reported as all tests were highly significant (p<0.001). When we describe a pattern as ‘increasing’, ‘decreasing’, ‘higher’ or similar, the relevant statistical test had been performed and found to be statistically significant.
Figure 1. High-level socio-economic determinants. Graphs show the percent of males (![]()
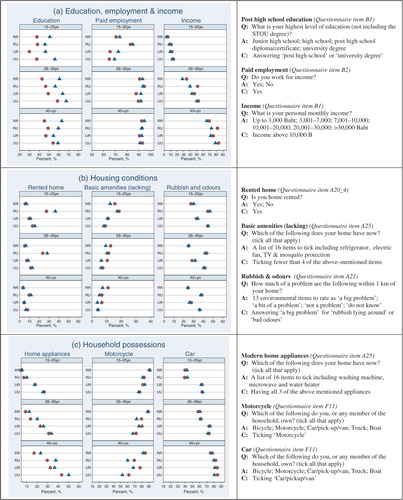
Figure 2. Mid-level environmental determinants. Graphs show the percent of males (![]()
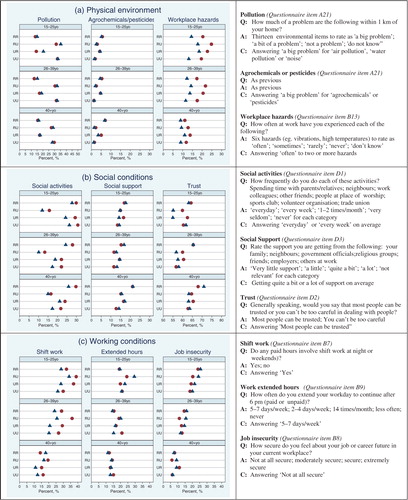
Figure 3. Proximate-level behavioural determinants. Graphs show the percent of males (![]()
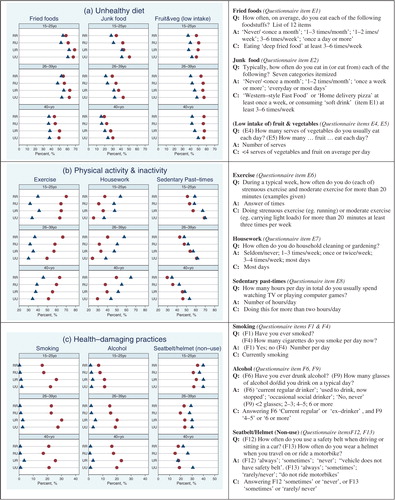
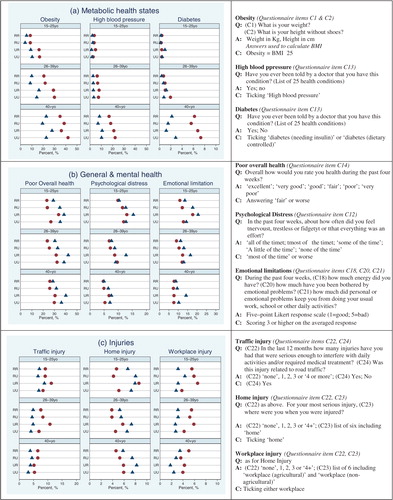
Figure 4. Health outcomes. Graphs show the percent of males (![]()
2.4 Age groups
Three age groups were chosen to represent approximate life stages: 33% of respondents fell in the 15–25yo range which captured the majority of full-time university students (mean age 22 years); 52% were in the 26–39yo range which captured the majority of respondents with dependent children (mean age 31 years); the mean age of the remainder was 44 years and comprised 15% of respondents. To test whether the older and younger age group results were influenced by the inclusion of age ‘outliers’, the above analyses were repeated without the respondents below age 20 (n=839) and above age 60 (n=255). The results for all variables were virtually the same as those reported here.
3 Results
3.1 Migration to urban areas
Just over half (52%) of the sample were living in urban areas in 2005 compared to only a quarter (24%) when they were 10–12yo (). One-fifth of the sample was permanent urban dwellers (urbanites, UU), with 33% living in Bangkok. The younger group was more likely to live currently in rural areas; among the 15–25yo, 50% were ruralites compared to 43% in the 26–39yo and 35% in the 40 + yo groups. One-third (33%) of respondents from Bangkok were urbanites, with over a quarter (27%) being urbanisers. In North, North-east and South Thailand, the majority (58, 58 and 54%, respectively) were ruralites and a quarter or less were urbanisers.
Table 2. Distribution of urbanisation status by age, sex and region
3.2 Socio-economic conditions (high-level health determinants)
The graphs in show, by age group, the proportion of males and females on a range of socio-economic indicators against their urbanisation status. In this population of open university students, significantly lower proportion of males than females had post high-school education (a). In the two older age groups, education level increased in males with urbanisation and the trends for females were not so clear. Males and females had similar rates of paid employment. The proportion of individuals with personal income greater than 10,000 baht increased with urbanisation status.
In all age groups, a significantly higher proportion of urbanisers lived in rented homes (b) (15–25yo: RU 33% vs others 9%; 26–39yo: 26% vs 8%; 40+: 10% vs 5%). Urbanisers in the 15–25yo age group were also less likely to have basic home amenities including a refrigerator, fan, TV and mosquito protection (b). A significantly higher proportion of urban dwellers (RU and UU) reported rubbish and bad odours being a major problem in the neighbourhood (b). The possession of modern appliances in the home (washing machines, microwaves and water heaters) and car ownership increased with increasing urbanisation status, while motorcycle ownership decreased (c).
3.3 Environmental conditions (mid-level health determinants)
In all age groups, air, water or noise pollution was reported as ‘big problems’ by significantly higher proportion of urban (UU and RU) than rural (RR and UR) dwellers (a) (urban 32% vs rural 15%). Problems with agrochemicals and pesticides were more common among rural dwellers (a). However, the actual prevalence was low, less than 10% in all groups. The frequency of experiencing hazards in the workplace, such as uncomfortably high temperatures and handling dangerous products, was higher for males and for urbanisers and de-urbanisers in all age groups (a).
The urbanisers, particularly in the younger age groups, stood out as having a significantly lower proportion who spend time on social activities (b) (15–25yo: RU 13% vs others 28%; 26–39yo: 12% vs 24%; 40 + yo: 16% vs 25%). They also reported lower levels of trust. Urbanites in the older age groups spent less time on social activities, had less social support and lower levels of trust than ruralites.
Among employed individuals, especially in the younger age groups, significantly higher proportion of urbanisers did shift work and worked extended hours (males: RU 24% (95% CI 23–26%) vs others 20% (19–21%; females: 29% (28–31%) vs 20% (19–21%)) (c). However, the trends varied between the age groups, and in the younger age groups, there was a pronounced trend of decreasing job insecurity with urbanisation status (c).
3.4 Behavioural hazards (proximate level health determinants)
The proportion of individuals with unhealthy diets increased with increasing urbanisation status, the trend being most apparent in the consumption of ‘junk’ food (a). The proportion of individuals engaging in regular physical activity decreased with increasing urbanisation status, while the proportions who spend two or more hours everyday watching TV or playing computer games increased (b). Formal exercise was much more common among males, while daily housework was more common among females and reduced considerably with urbanisation (b).
Although smoking and drinking rates were marginally higher among urbanites compared to ruralites in the younger age groups, there was no strong trend with urbanisation (c). Almost no females smoked and only 10% drank, while 20–30% of males smoked or drank. Smoking among males increased slightly with age, while drinking habits increased considerably with age (c). The rates of smoking were significantly higher among de-urbanising males compared to males in the other urbanisation status categories (males: UR 28% vs others 21%), and also higher among UR females (females: 2% vs others 0.9%). Similar results were seen with drinking. There was a slight trend towards greater non-use of car seatbelts and motorbike helmets in urban compared to rural dwellers among the 40 + yo males (c), while this group on average reported the lowest non-use rates, particularly among males.
3.5 Health outcomes
Males had much higher self-reported rates of obesity, high blood -pressure and diabetes than females (a). In the youngest age group, obesity was more strongly associated with location of residence when 10–12yo than with present location of residence, with urban residents reporting more obesity for both sexes (a). In the 40+ age group, the patterns were opposite for males and females: males now living in urban areas (RU and UU) were associated with higher rates of obesity than rural male, whereas urban females showed lower rates of obesity than rural females. Obesity patterns in the 26–39yo group were intermediate between the 15–29yo and 40 + yo groups.
Rates of high blood pressure were very low and did not show any clear patterns in the two younger age groups (a). Among 40 + yo males, there was a significant trend towards higher rates of high blood pressure with increasing urbanisation. Diabetes was also strongly age-related with much higher rates among males than females in the 40 + yo group but there was no strong trend with urbanisation (a). It should be noted that these are self-reported health conditions, consequently the results are influenced by access to health services.
The general overall health variable deteriorated with urbanisation (b). The two mental health variables (psychological distress and emotional limitation) declined with increasing urbanisation status in the two younger age groups (b). An unexpected, though striking feature was the significantly higher rates of diminished mental health among UR individuals (particularly females) compared to the others (overall health: UR 37% vs others 29%; distress: 11% vs 8%; emotional limitation: 15% vs 11%). Among the 15–25yo, the effect was more pronounced among males than females, while in the older age groups it was more pronounced in females.
Traffic and workplace injuries were more frequent among males than females (c), but the urbanisation gradients were not strong. Home injuries were more common among females and increased with urbanisation in the oldest age group (c).
4 Discussion
This is a descriptive study, in which we assumed a ‘hierarchy of risks’ with urbanisation being an overarching driving force behind changes in exposures to social and environmental determinants of health risks and health-related behaviours. We described, in a specific country context and using individual data from a large cohort, the associations between individual urbanisation status and self-reported exposures to health determinants and health outcomes. The potential importance of the determinants examined here are highlighted in a review of health developments during the last 50 years in Thailand which documented the components of the Thai health-risk transition Citation9.
Our sample of open university students represents a group of emerging educated Thais who are socio-economically and geographically similar to the general Thai population Citation16. Arguably the sample comprises those first affected by the health-risk transition underway in Thailand, who might serve as sentinels of emerging health risk patterns during the country's continued economic and social development. Thailand is not particularly urbanised compared to other middle-income countries, but urbanisation has steadily progressed since 1950, and the expectation is that this process will continue Citation7. The nature of our cohort is such that they will conceivably be working primarily in urban areas in the future. This trend towards urbanisation of the cohort is also evidenced by the fact that 32% of them have moved from rural to urban areas since childhood, while only 4% moved in the opposite direction.
A central strength of this study is the large cohort size of over 87,000 adults who had responded to a wide-ranging survey of health-risk determinants and health outcomes. Other urbanisation studies were of two types: community-based with relatively small sample sizes from a few hundred Citation19Citation20 to a few thousand subjects Citation21Citation22Citation23, or large studies utilising routinely collected national surveillance databases Citation24Citation25Citation26. The range of health determinants available for analysis was generally limited in these larger studies. The TCS database with its large size and wide range of available information created a unique opportunity to examine urbanisation across the entire health risk hierarchy. The large number of variables presented here has however limited this study to a descriptive examination without multivariate results.
4.1 Methodologic issues
Measuring and comparing the degree of urbanisation between different areas and times can be challenging because there is no well-defined measure of urbanisation Citation14Citation27. Many urbanisation studies adopted the classic rural–urban dichotomy Citation19Citation20Citation24Citation28 or used an urbanisation measure derived specially for the study. For example, Monda et al. Citation32 used a complex time-varying measure of urbanisation and the Transition and Health during Urbanisation of South Africans (THUSA) study used a five-level urbanisation grouping based on location of residence and occupation.
With our measure of urbanisation, urbanicity of residence was nominated subjectively by the respondent. Using self-reported ‘urban or rural’ residence at the time of the survey and at a past occasion, the four-level urbanisation variable captures perceived urbanisation, and is unique in allowing comparison of ruralites to urbanites as well as comparison to urbanisers and de-urbanisers. The health risk differentials between ruralites and urbanites were consistent with expected differences between rural and urban dwellers (urbanites had higher personal income, car ownership, consumption of ‘junk food’, physical inactivity, obesity and high blood pressure than ruralites) suggesting that the ‘self-reported’ urbanisation variable provides a valid measure of urbanisation.
There are however some issues of interpretation. The younger subjects have only lived approximately 10 years since the age of 10–12 years, while the mid and older age groups have lived approximately 20 and 30 years beyond that age, respectively. On the other hand, the ages at which any moves took place from rural to urban and vice versa were not recorded, so the exact periods of rural and urban exposure are not known. Nevertheless, the trends of health determinants and health status we document are so strong it is unlikely that the type of urban/rural definition used would significantly alter the findings.
4.2 Health risk gradient with urbanisation
New insights about the relative health risk differentials between urbanites (UU), ruralites (RR) and the two migrant groups, urbanisers (RU) and de-urbanisers (UR), were possible because of the four-level structure of the urbanisation variable. It was interesting to note that ruralites and urbanites often were the two extremes. Urbanisers appeared to have maintained some of the health risk patterns experienced by the ruralites, while the de-urbanisers maintained patterns from the urbanites, so that for several variables we observed continuous trends from RR to RU to UR to UU. The strongest trends between urbanisation and health determinants appeared for income, job insecurity and the life-style and behavioural factors. The trend of increasing income with urbanisation is not surprising and is consistent with a recent analysis Citation29. Clear trends were also seen for several other income-dependent variables, specifically ownership of basic home amenities, modern appliances, motorcycles and cars. The trend in perception of job insecurity in our sample could be due to the decreasing proportions of persons on fixed-term employment contracts and in casual employment with increasing urbanisation (percentage in fixed term or casual employment: RR 32%, RU 22%, UR 22%, UU 20%). Junk food consumption and sedentary life-style showed strong increasing trends with urbanisation, while physical activity showed decreasing trends. Studies that analyse dietary patterns in general indicate that junk food is a feature of the urban diet Citation30. Novel practices and forms of consumption are a defining feature of cities and it is these that sociologists and ‘diffusion of innovation theorists’ argue spread from cities to rural areas Citation31. A study in Cameroon Citation28 showed similar differences in physical activity levels between rural and urban dwellers, and another found that females migrating to urban areas in Guatemala Citation19 experienced increased sedentary life-style and unhealthy eating habits in addition to increased obesity and unhealthy lipid profiles. Interestingly, the reductions in physical activity associated with the move from rural to urban areas in China are found primarily in occupational physical activity Citation32. In the USA, studies of physical activity have focused on non-occupational physical activity, and such activity is reported to increase with urbanisation Citation33. It is likely that this pattern is related to the increasing use of gyms and other exercise facilities in affluent societies.
4.3 Urbanisers: rural to urban migrants
The urbanisers were the most ‘hard-working’, having the highest proportion who are working and highest rates of working extended hours. They are worst off overall in terms of socio-environmental conditions – housing, social networks, environment and workplace hazards. But there may be some indirect or future benefits that we have not asked about, such as the health value of remittances to rural relatives or the improved educational opportunities for their children. The extended working hours and other challenging working environment conditions found in the urbanisers have been reported also among rural-to-urban migrants in China Citation22Citation34. In one study migrants were more likely to experience unstable living arrangements, substandard employment conditions and suboptimal health status Citation22. In another study, migrants were found not to be especially vulnerable to poor mental health in spite of long working hours and substandard living conditions, concluded that this may be associated with a sense of wellbeing from improved personal economic conditions Citation34. Another plausible explanation is that only healthy migrant workers are selected into and remain in work (the Healthy Worker Effect) Citation35. Another Chinese study described an association of increasing smoking habits with rural-to-urban migration Citation21. However, our cohort did not show this pattern, possibly because Thailand and China are on different health transition paths due to cultural, historical, economic and ecological differences.
4.4 De-urbanisers: urban to rural migrants
The relatively small group of de-urbanisers had the highest rates of overall health, mental health problems and injuries, as well as smoking and drinking risks. This may be related to circumstances that led to their moving from urban to rural against a general trend to urbanise. They may have moved to join family members because of their own health problems or to care for elderly parents. A tendency for ‘return migration’ due to illness or retirement was identified in a recent South African study Citation36. European studies have demonstrated that higher levels of smoking and alcohol consumption are associated with depression and other mental health conditions Citation37Citation38. The de-urbanisers’ drug consumption patterns may reflect a poorer mental health status as well as their exposure to urban ways of life.
4.5 Further work
The observations in this study have highlighted directions for further work. With the baseline data, research issues include: studying the mental health effects of rural-urban migration; investigating whether the significantly higher non-use of seatbelts and motorcycle helmets among older female urbanites are associated with higher rates of disabling traffic injuries; and examining whether the higher reported exposure to environmental hazards are associated with higher risks of adverse health conditions.
In a recent review of future directions for urbanisation research in developing countries, Harpham Citation15 had stressed ‘the need for longitudinal research that can address the causal links between risk factors in the urban environment and health outcomes’. A follow-up questionnaire in 2008–2009 to all TCS participants will start the generation of data for longitudinal research. This study has highlighted several pertinent research questions for prospective analyses of the 2008–2009 and later surveys: assessing the contribution that the increasing trend of junk food consumption and physical inactivity with urbanisation makes to the pattern of increasing risk of obesity, hypertension and diabetes with urbanisation; examining whether the apparent work-related and financial stress experienced by younger urbanisers put them at increased risk of diminished health in the longer term; investigating whether the higher rates of smoking, drinking, emotional stress and injuries among de-urbanisers and persist beyond the 2005 baseline and if so, identifying the factors associated with it.
5 Conclusions
The ‘self-reported’ urbanisation measure was found to be a valid measure of urbanisation which led to new insights on the health risk exposures of migrants relative to permanent rural and permanent urban dwellers. There are distinct differences between participants classifying their residence as rural or urban within our cohort of more than 87,000 adults in Thailand. Urbanisation is a key element of the Thai health-risk transition.
Acknowledgements
Funds for this research were provided by the Wellcome Trust Citation1 and the National Health and Medical Research Council of Australia (NHMRC). The universities (STOU and ANU) provided facilities and support services. We are grateful to more than 87,000 STOU students who volunteered to take part in the study. We also appreciate valuable comments and input into the development and implementation of this study from other members of the research team in Thailand and Australia.
Notes
1. By health-risk transition we mean the change from a health determinants mix dominated by ‘traditional’ hazards, such as water and sanitation, malnutrition and vector-borne diseases, to the ‘modern’ hazards of urban pollution, tobacco smoking, road accidents, mass-produced high calorific foods, etc.
2. Like other open universities, STOU is a distance learning university which aims to bring higher education to people unable to study at a conventional university and caters for people with jobs, children, disabilities or commitments that make it hard to go to a fixed place.
Related Research Data
References
- Eberhardt MS, Pamuk ER. The importance of place of residence: examining health in rural and nonrural areas. Am J Public Health. 2004; 94: 1682–6.
- Vlahov D, Freudenberg N, Proietti F, Ompad D, Quinn A, Nandi V, et al.. Urban as a determinant of health. J Urban Health. 2007; 84: i16–26.
- Tannerfeldt G, Ljung P. More urban less poor: an introduction to urban development and management. Sida/Earthscan Publications. London, 2006
- UNDP. Human development report. 2006. Beyond scarcity: power, poverty and the global water crisis.. New York: United Nations Development Program. 2006.
- Cohen B. Urbanization in developing countries: current trends, future projections, and key challenges for sustainability. Technology in Society. 2006; 28: 63–80.
- Godfrey R, Julien M. Urbanisation and health. Clin Med. 2005; 5: 137–41.
- Mundial B. World development indicators 2006.. WashingtonDC: The World Bank. 2006.
- Viravaidya M, Sacks RG. Health and rural-to-urban migration in Thailand. The Population and Community Development Association's experience in rural development. Med J Aust. 1997; 166: 152–5.
- Seubsman S, Vilainerun D, Khamman S, Somboonsook B, Prapamontol T. Look back study on the Thai health-risk transition (in Thai with English summary). Sukhothai Thammathirat Open University Press. Nonthaburi, 2007
- Kosulwat V. The nutrition and health transition in Thailand. Public Health Nutr. 2002; 5: 183–9.
- Kjellstrom T, Friel S, Dixon J, Corvalan C, Rehfuess E, Campbell-Lendrum D, et al.. Urban environmental health hazards and health equity. J Urban Health. 2007; 84: i86–97.
- Ompad DC, Galea S, Caiaffa WT, Vlahov D. Social determinants of the health of urban populations: methodologic considerations. J Urban Health. 2007; 84: i42–53.
- Satterthwaite D. Outside the large cities; the demographic importance of small urban centres and large villages in Africa, Asia and Latin America. IIED Publications. London, 2006
- Vlahov D, Galea S. Urbanization, urbanicity, and health. J Urban Health. 2002; 79: S1–12.
- Harpham T. Urban health in developing countries: what do we know and where do we go?. Health Place. 2009; 15: 107–16.
- Sleigh AC, Seubsman SA, Bain C. Cohort profile: the Thai cohort of 87 134 Open University students. Int J Epidemiol. 2008; 37: 266–272.
- Corvalan C, Kjellstrom T. Health and environment analysis for decision making. World Health Stat Q. 1995; 48: 71–7.
- WHO. The world health report 2002 – reducing risks, promoting healthy life.. Geneva: World Health Organization. 2002.
- Torun B, Stein AD, Schroeder D, Grajeda R, Conlisk A, Rodriguez M, et al.. Rural-to-urban migration and cardiovascular disease risk factors in young Guatemalan adults. Int J Epidemiol. 2002; 31: 218–26.
- Weng X, Liu Y, Ma J, Wang W, Yang G, Caballero B. An urban–rural comparison of the prevalence of the metabolic syndrome in Eastern China. Public Health Nutr. 2007; 10: 131–6.
- Chen X, Li X, Stanton B, Fang X, Lin D, Cole M, et al.. Cigarette smoking among rural-to-urban migrants in Beijing, China. Prev Med. 2004; 39: 666–73.
- Li X, Stanton B, Chen X, Hong Y, Fang X, Lin D, et al.. Health indicators and geographic mobility among young rural-to-urban migrants in China. World Health Popul. 2006; 8: 5–21.
- Vorster HH, Venter CS, Wissing MP, Margetts BM. The nutrition and health transition in the North West Province of South Africa: a review of the THUSA (Transition and Health during Urbanisation of South Africans) study. Public Health Nutr. 2005; 8: 480–90.
- Aekplakorn W, Hogan MC, Chongsuvivatwong V, Tatsanavivat P, Chariyalertsak S, Boonthum A, et al.. Trends in obesity and associations with education and urban or rural residence in Thailand. Obesity (Silver Spring). 2007; 15: 3113–21.
- Martin SL, Kirkner GJ, Mayo K, Matthews CE, Durstine JL, Hebert JR. Urban, rural, and regional variations in physical activity. J Rural Health. 2005; 21: 239–44.
- Sundquist K, Frank G, Sundquist J. Urbanisation and incidence of psychosis and depression: follow-up study of 4.4 million women and men in Sweden. Br J Psychiatry. 2004; 184: 293–8.
- Dahly DL, Adair LS. Quantifying the urban environment: a scale measure of urbanicity outperforms the urban–rural dichotomy. Soc Sci Med. 2007; 64: 1407–19.
- Sobngwi E, Mbanya JC, Unwin NC, Kengne AP, Fezeu L, Minkoulou EM, et al.. Physical activity and its relationship with obesity, hypertension and diabetes in urban and rural Cameroon. Int J Obes Relat Metab Disord. 2002; 26: 1009–16.
- WHO. Our cities, our health, our future: acting on social determinants for health equity in urban settings.. Japan: World Health Organization Kobe Centre. 2008. Available from: http://www.who.int/social_determinants/resources/knus_final_report_052008.pdf [cited 27 April 2009]..
- Dixon J, Omwega AM, Friel S, Burns C, Donati K, Carlisle R. The health equity dimensions of urban food systems. J Urban Health. 2007; 84: i118–29.
- Ferrence R. Diffusion theory and drug use. Addiction. 2001; 96: 165–73.
- Monda KL, Gordon-Larsen P, Stevens J, Popkin BM. China's transition: the effect of rapid urbanization on adult occupational physical activity. Soc Sci Med. 2007; 64: 858–70.
- Reis JP, Bowles HR, Ainsworth BE, Dubose KD, Smith S, Laditka JN. Nonoccupational physical activity by degree of urbanization and U. S. geographic region. Med Sci Sports Exerc. 2004; 36: 2093–8.
- Li L, Wang HM, Ye XJ, Jiang MM, Lou QY, Hesketh T. The mental health status of Chinese rural–urban migrant workers: comparison with permanent urban and rural dwellers. Soc Psychiatry Psychiatr Epidemiol. 2007; 42: 716–22.
- Li CY, Sung FC. A review of the healthy worker effect in occupational epidemiology. Occup Med (London). 1999; 49: 225–9.
- Collinson MA, Tollman SM, Kahn K. Migration, settlement change and health in post-apartheid South Africa: triangulating health and demographic surveillance with national census data. Scand J Public Health Suppl. 2007; 69: 77–84.
- Lasser K, Boyd JW, Woolhandler S, Himmelstein DU, McCormick D, Bor DH. Smoking and mental illness: a population-based prevalence study. JAMA. 2000; 284: 2606–10.
- Ross HE. DSM-III-R alcohol abuse and dependence and psychiatric comorbidity in Ontario: results from the Mental Health Supplement to the Ontario Health Survey. Drug Alcohol Depend. 1995; 39: 111–28.