Abstract
Introduction: Dengue is currently a major public health burden in Asia Pacific Region. This study aims to establish an association between dengue incidence, mean temperature and precipitation, and further discuss how weather predictors influence the increase in intensity and magnitude of dengue in Singapore during the period 2000–2007.
Materials and methods: Weekly dengue incidence data, daily mean temperature and precipitation, and the midyear population data in Singapore during 2000–2007 were retrieved and analyzed. We employed a time series Poisson regression model including time factors such as time trends, lagged terms of weather predictors, considered autocorrelation, and accounted for changes in population size by offsetting.
Results: The weekly mean temperature and cumulative precipitation were statistically significant related to the increases of dengue incidence in Singapore. Our findings showed that dengue incidence increased linearly at time lag of 5–16 and 5–20 weeks succeeding elevated temperature and precipitation, respectively. However, negative association occurred at lag week 17–20 with low weekly mean temperature as well as lag week 1–4 and 17–20 with low cumulative precipitation.
Discussion: As Singapore experienced higher weekly mean temperature and cumulative precipitation in the years 2004–2007, our results signified hazardous impacts of climate factors on the increase in intensity and magnitude of dengue cases. The ongoing global climate change might potentially increase the burden of dengue fever infection in near future.
Introduction
Dengue is currently a major epidemiological threat for over 100 countries with about 70% of the 2.5 billion populations at risk living in Asia Pacific region Citation1 Citation2. Exact reasons for the re-emergence are not fully comprehended; nevertheless, the US Centers for Disease Control and Prevention has identified factors such as accelerated urbanization and population growth, weakened public health infrastructure, increased international travel, and lack of effective vector control system as main determinants for global emergence of dengue Citation3.
Dengue is caused by four serotypes of viruses (DENV-1–4) transmitted by female Aedes aegypti (principal vector) and Aedes albopictus. A. aegypti is highly domestic, feeds in the day, and lays eggs in artificial containers in and around residential areas. A. aegypti may feed on several individuals in order to complete a single blood meal; thus, increase number of infected hosts in a short period (Citation4). Upon being bitten by a dengue infective mosquito, a host may be infected with dengue virus after 3–14 days of intrinsic incubation period. The host then goes through 2–10 days of viraemic period, during which a female mosquito becomes infected by feeding blood meal on the infective host. The transmission cycle continues after extrinsic incubation period (8–12 days) takes place in the female mosquito and dengue virus is transmitted to other uninfected hosts through the bites of an infective mosquito (Citation4). A patient infected with one serotype of dengue virus will be immune for that serotype, but can be infected again with other serotypes and face higher risk of haemorrhagic symptoms which could lead to systemic failure or death Citation4.
Studies have shown that ambient temperature could have impact on population size, maturation period, feeding characteristics, and survival rate of Aedes mosquitoes Citation5 Citation6. Mortality rate of larvae, pupae, and adult female mosquitoes as a function of temperature between 10 and 40°C can be represented by a wide-base ‘U’ graphical shape. At temperature ranging from 15to 30°C, Aedes mosquitoes experience lower mortality rate Citation5. A recent study in French Guiana indicated that Aedes mosquitoes could survive up to 76 days with favorable environment condition Citation7. Simultaneously, Aedes mosquitoes experience shorter reproductive cycle at higher temperature of 32°C and increase feeding frequency more than twofold as compared to temperature at 24°C; pupae development period may reduce from four days at 22°C to less than one day as temperature increases to 32–34°C; thus, mosquito population multiplies swiftly as temperature increases Citation6. According to a study by Tun-Lin et al., female and male ratio of mosquito offspring could be 4:3 at 30°C Citation8. Additionally, the extrinsic incubation period of dengue viruses shortens from 12 days at 30°C to seven days as temperature rises to 32–35°C Citation9. Conversely, heavy precipitation destroys larvae and reduces survival rate of female mosquitoes in the short period but creates abundant breeding sources in long term Citation7 Citation10; whereas extremely low precipitation increases ambient temperature, usage of water and air-coolers, and water storage that may serve as breeding habitats.
Dengue is endemic in Singapore with all four serotypes of dengue viruses. It was first reported in Singapore in the early 1960s Citation11, but was curbed through effective vector surveillance and control programmes, public education, and law enforcement since 1970s. Dengue re-emerged in the 1990s with increasing incidence rate though overall house index was less than 2% Citation12. In 2003, dengue cases increased more than tenfold with 108.5 cases per 100,000 populations as compared to 9.3 cases per 100,000 populations in 1988. The surge continued and Singapore experienced the worst historical outbreak of dengue incidence in year 2005 with 326.5 cases per 100,000 populations Citation13 Citation14. Besides marked increase in cases, geographical expansion of dengue incidence from the east and southeast zones to west and north zones was also noted since 2004 Citation14. A study in 2006 revealed that increasing outdoor dengue transmission, lower herd immunity, and shift of vector control emphasis were some possible reasons for the upsurge of dengue Citation12.
Singapore had implemented aggressive vector control programmes since early 1970s. However, there was a change in emphasis from vector surveillance to case detection in the 1990s Citation12. Upon case detection, National Environment Agency (NEA) would immediately deploy dengue control team(s) to perform source reduction, adulticidal fogging, and various prevention activities according to the standard operation procedure. In 2003, Geographical Information System was added to enhance analysis of distribution of dengue cases, Aedes mosquitoes, and weather data. Since the 2005 outbreak, NEA had revised its strategy and put in place integrated dengue surveillance and control programme (Citation15, Citation16). The programme involved active vector surveillance; vector control; public education and community involvement; as well as research and development. In late 2005, NEA rolled out nationwide ‘carpet combing’ operations to eliminate breeding sources in all constituencies, and established an inter-agency dengue task force to enhance communication and corporation between government agencies and private organizations. National vector surveillance and control system were further strengthened in December 2005 to combat the upsurge in dengue incidence Citation15 Citation16.
In view of global climate change projections, the future climate may be favorable for greater dengue outbreaks; especially in subtropical and temperate countries. It was estimated that global mean surface temperature would be rising approximately by 1.4–5.8°C in current century; whilst temperature for Asia Pacific region would be increasing around 0.5–2°C by 2030 and 1–7°C by 2070 Citation17 Citation18. Furthermore, small island state such as Singapore could be more inclined to experience extreme temperature and changes in rainfall which in turn had additional impact on increase of infectious diseases Citation19. Nevertheless, the burden of climate change regarding dengue incidence in Singapore is so far uncertain.
Though association between weather and dengue incidence in Singapore is well documented Citation20 Citation21, the study on how the association influences the increasing intensity and magnitude of dengue incidence in recent years, especially years 2004–2007, is yet to be established. In this study we apply time series model to establish association between dengue incidence and weather predictors while taking into account the delayed effects of exposure and further discuss how these predictors are associated with increasing intensity and magnitude of dengue cases in Singapore in years 2000–2007.
2 Materials and method
2.1 Study area
Singapore is a highly urbanized small tropical island with approximately 710.2 km2 land area. The island has population size of about 4.8 millions and population density of 6,814 persons per km2 Citation22. Average daily minimum and maximum temperature in Singapore ranged from 23.2 to 31.7°C with daily mean temperature around 27°C; however, daily minimum temperature could drop to 20.2°C or rise to maximum 36°C in an extreme cold or hot day. The average annual rainfall was around 2,346 mm Citation23.
2.2 Data collection
Weekly dengue data was collected from the Communicable Diseases Division, Ministry of Health Singapore and MOH weekly epidemiological publications for year 2000–2007. Dengue fever (DF) or dengue hemorrhagic fever (DHF) was defined as clinical dengue cases with confirmed laboratory blood tests of dengue viral infection of any serotypes. Under the Infectious Diseases Act in Singapore, it is mandatory for all medical practitioners to notify all diagnosed or confirmed dengue cases to the Ministry of Health within 24 hours Citation24. Laboratories are also required to report all patients with positive blood test for dengue viral infection to the Ministry of Health.
Weather data were obtained from World Data Center for Meteorology, Asheville. Daily mean temperature and precipitation reported by Changi meteorological station was extracted from the World Meteorological Organization (WMO) and NOAA National Climatic Data Center Citation25. The meteorological data was provided by the Meteorological Services Division of NEA of Singapore through Exchange of Regional Weather Data by the use of Global Telecommunication System (GTS) of WMO. Weekly mean temperature and cumulative precipitation were aggregated from daily weather data. Midyear population during the period 2000–2007 was obtained from Statistics Singapore's website Citation26.
2.3 Statistical analysis
We established a time series Poisson regression model that simultaneously included time factors such as time trend, lagged terms of weather predictors, lags of dengue cases as auto regressive terms, and we accounted for changes in size of the population by offsetting midyear population. We modeled the predictors as smooth cubic spline functions given 3 degrees of freedom (df) each, with exception for the smooth function of trend that was allowed 6 df. We tested the sensitivity of the df of the trend by doubling it. In the Poisson regression models we allowed for over-dispersion.
where β = parameter estimates; t=time series in weeks; log(pop) = offset midyear population; AR(den) = auto regressive term of dengue cases; S=cubic spline smoothing function with corresponding degree of freedom (df); temp
i
=weekly mean temperature at specific lag strata, i; prep
i
=weekly cumulative precipitation at specific lag strata, i; where i corresponds to 1–5 lag strata = week 1–4, 5–8, 9–12, 13–16, 17–20; trend corresponds to week number starting from the first week in year 2000.
Midyear population was included as an offset to adjust for annual population growth or decay in the modeled relative risk. Whereas auto regressive terms ranging from 1 to 8 weeks were estimated by summing average duration of incubation period in infected person, infectious period of host, and survival period of female Aedes mosquitoes Citation4 Citation7. Concurrently, lag terms ranging from 1 to 20 weeks for temperature and precipitation were created to analyze relative risks between weather predictors and dengue with effect of different time lag. Cross-correlation coefficients of each weather variable and dengue cases as well as literature reports were examined to estimate maximum lag terms Citation21 Citation27. Trend and seasonality pattern in collected data were identified by using time series plot of dengue cases and to be controlled as an unmeasured confounders by the smooth function of time trend.
Model fit was evaluated by Akaike's Information Criterion (AIC) and further validated by plotting predicted residuals against observed data, observing residual sequence plot, and analyzing normality tests. Furthermore, Autocorrelation (ACF) and partial autocorrelation (PACF) were evaluated to avoid confounding of the risk estimates by unknown sources and shrinking of the variance associated with parameter estimates. To account for this, we modeled auto regressive terms. PACF was also examined to avoid over fitting (which could occur if allowing the trend too much flexibility) signaled by extremely high proportion of negative PACF. Data were analyzed using R2.8.1 Citation28.
3 Results
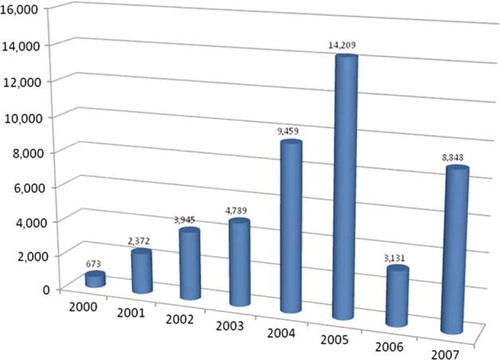
During the study period, dengue cases () increased from 673 cases in year 2000 to 4,789 cases in 2003, after which, annual dengue cases increased with greater magnitude and intensity with record of 9,459 cases in year 2004 and peaked in year 2005 with 14,209 cases. The incidence then decreased to 3,131 cases in 2006 and resurged in 2007 with 8,848 cases. The highest dengue cases in the study period were reported in week 38 of year 2005 with 714 cases.
Figure 1. Annual dengue cases in years 2000–2007.
reveals time series of weekly weather predictors and dengue cases. Singapore experienced the highest weekly mean temperature of 30.4°C in year 2005 followed by 30.3°C in year 2002. The highest weekly mean temperature in the study period was recorded in week 17 of year 2005 with zero weekly cumulative precipitation. While the longest dry spell of 40 days occurred in the first two months of 2005, highest weekly cumulative precipitation was recorded as 388 mm in week 51 of year 2006. Overall, weekly mean temperature for year 2000–2003 ranged from 25.7 to 30.3°C; while the range was 25.5–30.4°C for 2004–2007. Concurrently, weekly cumulative precipitation in years 2000–2003 ranged from 0 to 260 mm with average 42 mm and the range was 0–388 mm with average 44.5 mm for years 2004–2007.
Figure 2. Weekly dengue cases, mean temperature and cumulative precipitation in 2000–2007.

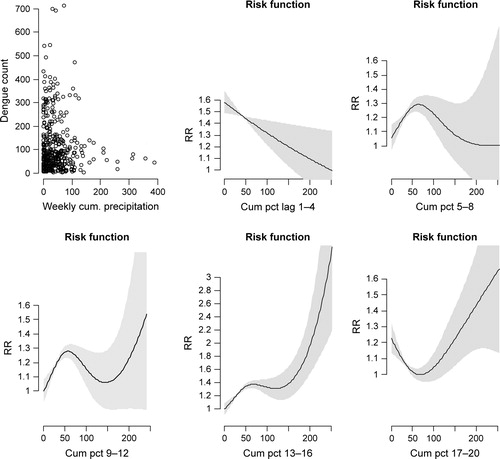
As shown in , dengue incidence increased linearly with weekly mean temperature at lag strata 5–8, 9–12, and 13–16; during which the highest increases in relative risk occurred at time lag of 9–12 weeks. Our results showed that decreasing mean temperature below 27.8°C produced opposite effect by increasing relative risk of dengue incidence significantly at lag strata 17–20; while relative risk of dengue increased minimally when mean temperature was above 27.8°C at the same strata. Simultaneously, dengue incidence was associated with weekly cumulative precipitation except with precipitation above 125 mm at lag strata 1–4, 5–8, and 9–12 (). The impact of cumulative precipitation on dengue incidence was negative at lag strata 1–4 as decreasing precipitation corresponded to increasing relative risk with maximum effect at zero weekly cumulative precipitation. Nevertheless, relative risk of dengue increased linearly with weekly cumulative precipitation at lag strata 5–8 and 9–12 and peaked at about 75 mm before declining. Increase in cumulative precipitation showed highest relative risk of dengue incidence at lag strata 13–16 with a plateau effect when cumulative precipitation was between 75 and 150 mm. Risk function of dengue and cumulative precipitation was shown as a ‘U’ shape at lag strata 17–20. The relative risk of dengue increased linearly when cumulative precipitation was above 75 mm; nevertheless, the risk function indicated opposite effect as cumulative precipitation was below 75 mm.
Figure 3. Relative risks of dengue incidence with weekly mean temperature (Tmp) at various lagged strata.
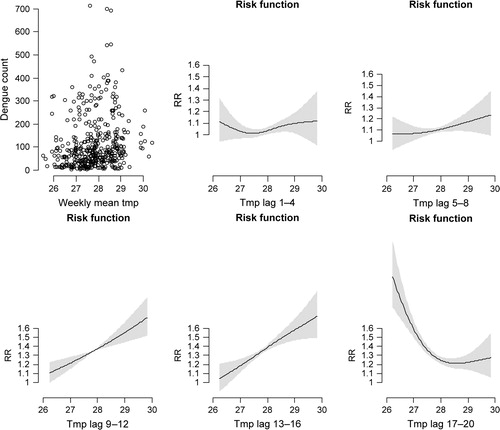
Figure 4. Relative risks of dengue incidence with weekly cumulative precipitation (Cum pct) at various lagged strata.
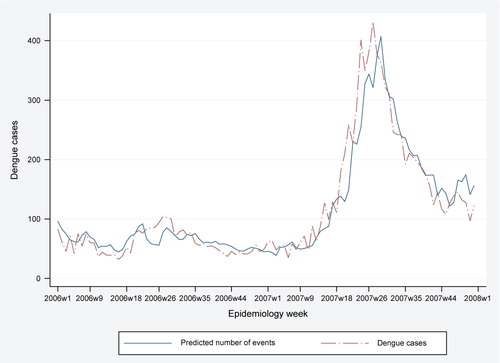
Post estimation plots indicated good fit of Poisson regression model for the analysis. The model explained 89.9% of the variance in weekly dengue cases and produced good fit of predicted cases when plotted against observed data ( and ). Residuals sequence plot indicated constant location and scale between observed and predicted values; while histogram of residuals showed approximately normal distribution. Concurrently, ACF and PACF indicated independent residuals. Thus the graphs indicated appropriate choice of model. Furthermore, sensitivity test of df for trend changed little of our results.
Figure 5. Predicted cases vs. observed dengue cases in 2000–2007.
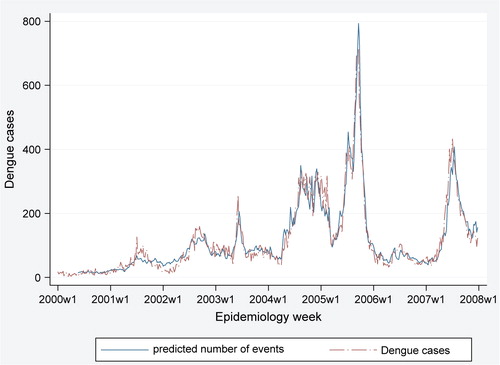
Figure 6. Predicted cases vs. observed dengue cases in 2006–2007.
4 Discussion
Though elevated weekly mean temperature preceded dengue incidence at lag of 5–16 weeks, temperature decreasing below 27.8°C exerted increasing risks on dengue incidence at longer time lag of 17–20 weeks. On the other hand, weekly cumulative precipitation was associated with dengue incidence at lag of 1–20 weeks. Decreasing weekly cumulative precipitation posed increasing risk on dengue outbreak at time lag of 1–4 and 17–20 weeks; whereas highest relative risk occurred at 13–20 weeks subsequent to cumulative precipitation above 150 mm.
As Singapore experienced higher weekly mean temperature and cumulative precipitation in year 2004–2007, the results signified positive impact of climate factors on the increase in intensity and magnitude of dengue cases; since the levels of temperature and precipitation were more conducive in these years according to the exposure response relationship estimated. Additionally, high cumulative precipitation during the study period possibly explained a fraction of dengue endemic in Singapore as heavy precipitation created abundant outdoor breeding sources. A previous study by Ooi et al. Citation12 suggested viral transmission outside homes as one of the reasons for resurgence of dengue in Singapore; while Koh et al. (2008) also stated that 50% of all mosquito breeding habitats, which included discarded receptacles, choked drains, water pump rooms, were located outdoor Citation20. However, field surveillance data showed that A. albopictus was the main species which bred in habitats located outdoor; while the primary vector, A. aegypti, which was responsible for majority outbreaks in Singapore, still preferred to breed inside homes. Literature also indicated that A. albopictus probably served as a vector maintaining the dengue virus in South-east Asia and Pacific Islands Citation29. Nevertheless, Singapore has put in place control measures targeting at both types of breeding habitats to minimize transmission by both species.
The long time lag of 17–20 weeks was consistent with a study by Koh et al. that dengue incidence in year 2005 was highly associated with weekly mean temperature at a lag time of 18 weeks as well as study by Heng et al. that dengue incidence occurred at a lag time of 8–20 weeks following elevated temperature Citation20 Citation21. The lagged effect of dengue incidence could be reasoned by incubation periods in host–vector–pathogen transmissions cycle plus reproduction, maturation and survival rate of vector.
This study adopted an approach that allowed the effect of weather to act non-linearly as exposure response function; thus enhanced the flexibility to model risks with time on a weekly resolution. In the analysis we assumed there was no strong seasonal confounding that needs to be controlled, except time trend. This judgment was based on deduction that no further confounder was identified and that PACF suggested over fitting when adjusting for seasonality. Furthermore, auto regressive terms included in the model explained some of such variation. The examination of ACF indicated serial correlation for consecutive lags of dengue cases; thus, dengue lag terms were used as auto regressive term in the model. The seasonality of the mosquito population was likely to be driven by temperature and precipitation and the high level of explained variation of the model supported this.
Instead of modeling the mosquito population, we addressed the incidence directly and estimated dengue cases caused by the size of the vector population related to climate factors such as temperature and precipitation. Elements not explained by weather predictors were explained by the trend function. Determinants of the trend function had not been addressed in this study, but were likely attribute to multiple factors such as vector control capacity, surveillance emphasis, herd immunity, socioeconomic, environment, change of dengue serotypes, etc. According to a previous study, non-climate factors such as changes of dengue serotypes partly contributed to the increase in dengue cases during the period 2004–2007 Citation20. The high cases in 2004 and 2005 were due partly to a change in dengue serotype from DENV-2 to DENV-1; while the change from DENV-1 to DENV-2 in 2007 was also one of the reasons for resurgence of dengue incidence in the year Citation20. Another factor accounted for in the trend function was the enhancement of pre-emptive vector surveillance during the inter-epidemic periods and inter-sectoral collaborations to conduct systematic source reduction. Since 2006, the NEA (Singapore) has introduced Intensive Source Reduction Exercises over a period of 12 weeks before the expected peak in cases in accordance to the temperature trend. These measures might, to certain extend, contribute to the reduction of dengue cases in year 2006 and help to curb 2007 dengue cases from escalating into a huge outbreak.
Climate variability between years may have direct impact on dengue incidence in current and subsequent year Citation30 Citation31 Citation32 . Inter-annual climate variability can be influenced by local weather and irregular warming of sea surface temperature (El Nino Southern Oscillation or ENSO phenomenon). During the study period, average weekly mean temperature was higher in years 2002, 2004, and 2005; simultaneously, ENSO phenomenon was recorded in May 2002–Mar 2003, Jun 2004–Feb 2005, and Aug 2006–Jan 2007 Citation33. This inter-annual climate variability could have increased relative risk of dengue incidence in Singapore as record showed larger dengue outbreak in years 2004, 2005, and 2007.
In order to avoid camouflage of temporal variations of weather, it is also essential to interpret our findings by analyzing both short and long-term weather variations. For instance, year 2005 experienced higher temperature and lower cumulative precipitation in the first 17 weeks as compared to subsequent weeks of the year; thus, relative risk for dengue incidence was higher in second and third quarter as compared to average relative risk for the year. Moreover, as a highly urbanised small island state, Singapore faces threat of urban heat island effect along with extreme temperature and precipitation events which may compound the exponential increase in dengue cases Citation19 Citation34 Citation35.
Limitations in the study of dengue incidence include asymptomatic and unreported cases that lead to under-reported dengue cases. In a survey on seroprevalence in Singapore (2007), it was estimated that asymptomatic cases could be approximately 19 times higher than reported cases Citation36. The under-reported cases could surge higher during peak tourism period(s) as tourists from regional countries with asymptomatic dengue infection may infect mosquitoes in Singapore ‘silently’ and cause greater threat of dengue outbreak in near future.
Climate variability in dissimilar geographical areas may have diverse local effects on dengue outbreak as both climate and non-climate variables influencing dengue transmission may be unique in different locations Citation37. For instance, a study in Southern Thailand showed relative importance of weather predictors varied with geographical areas. The study indicated mean temperature, rainfall, and relative humidity were associated with dengue haemorrhagic fever (DHF) in provinces along Andaman Sea border; while minimum temperature, number of rainy days, and relative humidity were associated with DHF in provinces along the Gulf of Thailand border Citation38. Thus, spatial and transmission heterogeneity secondary to unique local factors may limit generalisation of the study result from one city to another.
Given that temperature and precipitation in Singapore are conducive for increasing vector population size, biting, and infective rate and that silent transmission may occur in community, strong health policies that support active dengue surveillance and regular breeding source reduction exercises are vital for effectiveness and sustainability of dengue prevention efforts. As dengue outbreaks are surging in Asia Pacific and dengue viruses are spreading among nations in the region through international travel and trade, the risk of dengue outbreaks in Singapore will possibly be intensified. Therefore, further studies concerning impact of climate factors on both regional and local dengue incidence are essential for analysis of geographical dengue distribution and transmission patterns so as to facilitate formulation of regional adaptation and prevention strategies accordingly.
5 Conclusion
In view of global warming, efforts to strengthen dengue control programmes and public health interventions are inevitable in order to avert upsurge of dengue incidence which predictably increases national health burden and economic losses. The finding of this study reveals potential transmission of dengue disease as a result of climate variability with possible time lag up to 20 weeks. Currently NEA conducts intensive vector control measures 12 weeks before the anticipated rise in dengue cases based on temperature trending, during which public, government agencies, and other stakeholders will be alerted to participate in preventive measures. Nevertheless, the additional use of extreme low or high weekly cumulative precipitation will further enhance the predictive model of dengue transmission and improve the effectiveness of current vector control programmes. A key to eradicate dengue from community is commitment and participation from individual population; therefore, integrating climatic factors into national dengue prevention/education programmes will help to create public awareness and enable individuals to take necessary precaution.
6 Conflict of interest and funding
The authors have not received any funding or benefits from industry to conduct this study.
Acknowledgements
We thank Communicable Diseases Division, Ministry of Health Singapore for providing dengue data and granting us permission to access data on weekly Infectious Diseases Bulletin for research purposes; National Environment Agency for supplying dengue cases stratified by zones; Statistics Singapore for providing midyear population data online; and World Meteorological Organization, for making available online meteorological data (daily mean temperature and precipitation from Changi Station, Singapore) for research purposes.
Related Research Data
References
- World Health Organization. Dengue and dengue haemorrhagic fever. Fact sheet No. 117. WHO. Available from: http://www.who.int/mediacentre/factsheets/fs117/en/; 2009. [cited 22 March 2009].
- World Health Organization Regional Office for the Western Pacific. Dengue in the Western Pacific region. WHO/WPRO. Available from: http://www.wpro.who.int/health_topics/dengue/;2009. [cited 4 April 2009].
- Division of Vector-Borne Infectious Diseases. Dengue fever. Centers for Disease Control and Prevention. Available from: http://www.cdc.gov/ncidod/dvbid/dengue/index.htm;2008. [cited 21 March 2009].
- Gubler DJ. Dengue and dengue hemorrhagic fever. Clin Microbiol Rev. 1998; 11: 480–96.
- Yang HM, Macoris MLG, Galvani KC, Andrighetti MTM, Wanderley DMV. Assessing the effects of temperature on the population of Aedes aegypti, the vector of dengue. Epidemiol Infect. 2009; 137: 1188–202.
- Focks DA, Brenner RJ, Hayes J, Daniels E. Transmission thresholds for dengue in terms of Aedes aegypti pupae per person with discussion of their utility in source reduction efforts. Am J Trop Med Hyg. 2000; 62: 11–8.
- Fouque F, Carinci R, Gaborit P, Issaly J, Bicout DJ, Sabatier P. Aedes aegypti survival and dengue transmission patterns in French Guiana. J Vector Ecol. 2006; 31: 390–9.
- Tun-Lin W, Burkot TR, Kay BH. Effects of temperature and larval diet on development rates and survival of the dengue vector Aedes aegypti in north Queensland, Australia. Med Vet Entomol. 2000; 14: 31–7.
- Watts DM, Burke DS, Harrison BA, Whitmire RE, Nisalak A. Effect of temperature on the vector efficiency of Aedes aegypti for dengue 2 virus. Am J Trop Med Hyg. 1987; 36: 143–52.
- National Environment Agency. NEA: dengue control more successful when the community is involved. Singapore: National Environment Agency. 2004.
- Chew A, Ho Y, Lee YK. A haemorrhagic fever in Singapore. Lancet. 1961; 1: 307–10.
- Ooi E-E, Goh K-T, Gubler DJ. Dengue prevention and 35 years of vector control in Singapore. Emerg Infec Dis. 2006; 12: 887–93.
- Singapore Ministry of Health. Communicable diseases surveillance in Singapore 2006. Singapore: Ministry of Health. 2007.
- Singapore Ministry of Health. Report of the expert panel on dengue [monograph on the Internet]. Available from: http://www.moh.gov.sg/mohcorp/uploadedfiles/News/Current_Issues/2005/Oct/Final_Report-dengue_7_Oct_05.pdf; 2005. Oct 7 [cited 6 March 2009].
- Singapore Ministry of Health. Surveillance and control of dengue vectors in Singapore. Epidemiol News Bull. 2006; 32: 1–9.
- Singapore Ministry of Health. Dengue surveillance in Singapore, 2005. Epidemiol News Bull. 2006; 32: 9–14.
- Kovats S, Ebi KL, Menne B, Campbell-Lendrum D, Canziani OF, Githeko A, et al.Methods of assessing human health vulnerability and public health adaptation to climate change. Health and global environmental change. Series no. 1.CopenhagenDenmark: WHO/EURO. 2003.
- Preston BL, Suppiah R, Macadam I, Bathols J. Climate change in the Asia/Pacific region. A consultancy report prepared for the climate change and development roundtable. AspendaleAustralia: CSIRO Marine & Atmospheric Research. 2006.
- Ebi KL, Lewis ND, Corvalan C. Climate variability and change and their potential health effects in small island states: information for adaptation planning in the health sector. Climate change and human health: national assessments of impacts and adaptation. Environ Health Perspect. 2006; 114: 1957–63. (Mini-monograph).
- Koh KWB, Ng LC, Kita Y, Tang CS, Ang LW, Wong KY, et al.. The 2005 dengue epidemic in Singapore: epidemiology, prevention and control. Ann Acad Med Singapore. 2008; 37: 538–45.
- Heng BH, Goh KT, Neo KS. Environmental temperature, Aedes aegypti house index and rainfall as predictors of annual epidemics of dengue fever and dengue haemorrhagic fever in Singapore. In: Goh KTDengue in Singapore. Singapore: Institute of Environmental Epidemiology, Ministry of Environment. Technical Monograph Series No. 2. 1998, pp. 138–49.
- Key Annual Indicators. Singapore: Department of Statistics. Available from: http://www.singstat.gov.sg/stats/keyind.html; 2008. [cited 12 March 2009].
- Meteorological Services Division. Climatology of Singapore. Singapore: National Environment Agency. Available from: http://app2.nea.gov.sg/weather_statistics.aspx; 2009. [cited 10 August 2009].
- Infectious Diseases Act (Chapter 137).Singapore: Ministry of Health. 1977.
- NNDC Climate Data Online. National Climatic Data Center, NESDIS, NOAA, U.S. Department of Commerce. Available from: http://www7.ncdc.noaa.gov/CDO/dataproduct; 2008 [cited 20 July 2008].
- Monthly Digest of Statistics Singapore, March 2009: demography: population and growth rate. Singapore: Department of Statistics. 2009. Available from: http://www.singstat.gov.sg/pubn/reference/mdsmar09.pdf [cited 8 April 2009].
- Naumova EN, MacNeill IB. Time-distributed effect of exposure and infectious outbreaks. Environmetrics. 2009; 20: 235–48.
- R Development Core Team. R: a language and environment for statistical computing. ViennaAustria: R Foundation for Statistical Computing. 2008. Available from: http://www.R-project.org [cited April 2009].
- Gratz NG. Critical review of the vector status of Ae. albopictus. Med & Vet Entomol. 2004; 18: 215–27.
- Githeko AK, Lindsay SW, Confalonieri UE, Patz JA. Climate change and vector-borne diseases: a regional analysis. Bull World Health Organ. 2000; 78: 1136–47.
- Hurtado-Diaz M, Riojas-Rodriguez H, Rothenberg SJ, Gomez-Dantes H, Cifuentes E. Short communication: impact of climate variability on the incidence of dengue in Mexico. Trop Med Int Health. 2007; 12: 1327–37.
- Halstead SB. Dengue virus-mosquito interactions. Annu Rev Microbiol. 2008; 53: 273–91.
- Climate Prediction Center. Cold & warm episodes by season. National Weather Service. Available from: http://www.cpc.noaa.gov/products/analysis_monitoring/ensostuff/ensoyears.shtml; 2009. [cited 8 April 2009].
- Campbell-Lendrum D, Corvalan C. Climate change and developing-country cities: implications for environmental health and equity. J Urban Health. 2007; 84: i109–17.
- Aniello C, Morgan K, Busbey A, Newland L. Mapping micro-urban heat islands using Landsat TM and a GIS. Comput Geosci. 1995; 21: 965–9.
- Ye T, Ang LW, Chow A, Chew SK. Seroprevalence study on past and recent dengue virus infection in Singapore. Epidemiol News Bull (Singapore). 2007; 33: 36–41.
- Johansson MA, Dominici F, Glass GE. Local and global effects of climate on dengue transmission in Puerto Rico. PLoS Negl Top Dis. 2009; 3: e382.
- Promprou S, Jaroensutasinee M, Jaroensutasinee K. Climatic factors affecting dengue haemorrhagic fever incidence in Southern Thailand. Dengue Bull. 2005; 29: 41–8.