Background
The increase in tick-borne encephalitis (TBE) incidence is observed in recent decades in a number of subarctic countries. The reasons of it are widely discussed in scientific publications. The objective of this study was to understand if the climate change in Arkhangelsk Oblast (AO) situated in the north of European subarctic zone of Russia has real impact on the northward expansion of Ixodid ticks and stipulates the increase in TBE incidence.
Methods
This study analyzes: TBE incidence in AO and throughout Russia, the results of Ixodid ticks collecting in a number of sites in AO, and TBE virus prevalence in those ticks, the data on tick bite incidence in AO, and meteorological data on AO mean annual air temperatures and precipitations.
Results
It is established that in recent years TBE incidence in AO tended to increase contrary to its apparent decrease nationwide. In last 10 years, there was nearly 50-fold rise in TBE incidence in AO when compared with 1980–1989. Probably, the increase both in mean annual air temperatures and temperatures during tick active season resulted in the northward expansion of Ixodes Persulcatus, main TBE virus vector. The Ixodid ticks expansion is confirmed both by the results of ticks flagging from the surface vegetation and by the tick bite incidence in the population of AO locations earlier free from ticks. Our mathematical (correlation and regression) analysis of available data revealed a distinct correlation between TBE incidence and the growth of mean annual air temperatures in AO in 1990–2009.
Conclusion
Not ruling out other factors, we conclude that climate change contributed much to the TBE incidence increase in AO.
Tick-borne encephalitis (TBE) is an increasing burden for health protection in many Arctic countries Citation1–Citation3. The fatality rate of its focal forms exceeds 60%, e.g. in the Far East of Russia, Citation4. In most of 16 European countries where TBE is being monitored, an increase in its incidence was reported during recent decades notwithstanding the differences between criteria and standards used by different surveillance systems Citation5.
The source of this trend is still not understood although some factors that may influence it have been discussed already Citation6. Climate change is one of the factors that may alter the habitat of Ixodes ticks, the principal vector of TBE virus Citation7 Citation8.
We have investigated the hypothesis within the regions crossed by the limits of Ixodes ticks habitat and where both climate and TBE incidence underwent considerable recent changes. We considered Arkhangelsk Oblast (AO) in the subarctic zone of European Russia to determine if the climatic factors indeed influenced the distribution of Ixodes persulcatus and TBE incidence in AO.
Materials and methods
Geographical data
AO is situated in the north of Europe, within the subarctic zone of Russia and includes 306,300 km2 (excluding Nenets Autonomous Area and polar islands). AO consists of 19 administrative districts; for the purpose of this study they were divided into three groups according to physiographic regions: northern (A) – north taiga, central (B) – middle taiga, and southern (C) – middle taiga, south taiga border (see ).
Fig. 1. Arkhangelsk Oblast location and AO districts by groups. Districts where ticks were collected are in bold font (Designed in ArcGIS 9.3).
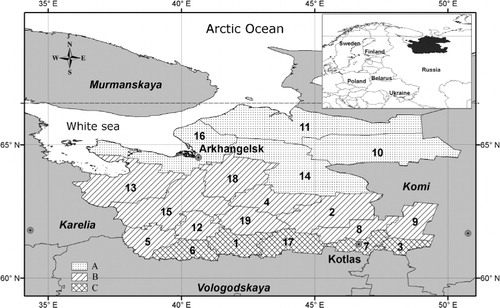
The AO forested area did not undergo considerable change in the past 20 years: it was 230,600 km2 in 1990 and 218,310 km2 in 2009.
Environmental and epidemiological data
Environmental and epidemiological data were provided by Rospotrebnadzor (Federal Service on Customers’ Rights Protection and Human Well-being Surveillance) and Center for Hygiene and Epidemiology for Arkhangelsk Oblast and included the following information:
Tick-borne encephalitis incidence rates (annual number of TBE cases per 100,000 of population) in 1980–2009 in AO, and in Russia as a whole.
TBE diagnosis is usually based on clinical data and confirmed (over 80% in AO) by serological studies with the help of hemagglutination-inhibition (HI) assay in 1980–1996; later enzyme-linked immunosorbent assay (ELISA) was applied, and (IgM + IgG) antibodies were determined using D-1156 test kits (JSC «Vector-Best», Novosibirsk, Russia) and following the enclosed manufacturer's recommendations. The results of HI assay and ELISA coincide Citation9.
Monthly tick abundance in 1992–2009.
TBE virus prevalence in ticks collected in 1996–1999 and 2002–2009.
A total of 1681 questing adult ticks were collected in Kotlassky district. The TBE virus antigens were detected by ELISA using D-1154 test kits (JSC «Vector-Best», Novosibirsk, Russia) according to the manufacturer's recommendations.
Tick bite incidence rate in AO districts in 1980–2009.
In the Russian Federation, mandatory reporting of all cases of tick bites is done by all health care providers to the local Rospotrebnadzor; the report involves the date, place, and circumstances of the incident. Here, we use ‘tick-bite incidence rate’ (BIR) that is the number of tick bites per 100,000 of local inhabitants during the year, and ‘decade-averaged tick-bite incidence rate’ (BIR10) that is the BIR averaged over a 10-year period.
Meteorological data
Meteorological data (temperatures in 1960–2009 and precipitations in 1970–2008, AO) collected by 28 meteorological stations in AO (see ) were obtained from the National Climatic Data Center (NCDC) (http://www.ncdc.noaa.gov/oa/ncdc.html).
Table 1. The list of meteorological stations in AO
The product ‘Surface Data: Daily – Global Summary of the Day (GSOD)’ was used for meteorological data extraction. Meteorological information represented in this product is daily mean, minimum, maximum air temperature, air humidity, precipitations, wind speed, and other data on the certain meteorological station.
Our own software was designed to extract air temperature and precipitations from raw data. On the first step, monthly mean air temperature was calculated for the selected meteorological station, and then annual mean air temperature was summarized. Annual mean air temperature for northern, central, southern groups of districts, and whole AO was estimated as a result of primary data processing.
Population data
The AO population decreased from about 1.6 million in 1990 to 1.2 on January 1, 2010 mainly due to exodus by migration (). Census data on the AO population were obtained from Federal State Statistics Service (ROSSTAT) site (http://www.gks.ru/).
Table 2. Census data on the AO population Citation6
Statistic analysis
Statistic analyses of mean values and standard deviations of annual air temperatures, precipitations, TBE incidence rates, and BIR were conducted to estimate the significance of climate changes. Pearson correlation analysis and regression analysis were done to assess correlations between temperature, TBE incidence rate, and BIR.
The adequate development of I. persulcatus during its activity season requires sufficient warmth that may be represented by the sum of effective temperatures according to the formula as follows:Here:
S – sum of annual effective temperatures for t min; ET n =(t n – t min) – effective temperature on day ‘n’; t min – mean temperature limit, °C (+10°C for I. persulcatus); t n – mean temperature on day ‘n’, °C (only t n >t min are taken into account); daily mean temperature was extracted from raw NCDC meteorological data (http://www.ncdc.noaa.gov/oa/ncdc.html); and n – number of days.
Results
Ixodid ticks habitat and active period
In 1992—2009, questing adult I. persulcatus ticks were regularly flagged from surface vegetation in seven districts of AO (see ), one site in each district; however, only in Kotlassky district (7, southern group), we had every year findings. In this district, the tick abundance varied considerably in different years. Typically, the findings began in April (11.9% of mean annual yield in 1992–2000; 25.3% in 2001–2009), peaked in May (48.8% in 1992–2000; 35.4% in 2001–2009), and dropped in June (27.1% in 1992–2000; 13.6% in 2001–2009). The recent July collections were much larger (25.3% in 2001–2009, compared to 9.3% in 1992–2000). Only a few tick specimens were ever collected in August.
In the six other districts [1, 2, 3, 8, 13, and 15] in 1992—1995, flagging covered 89 km totally but was fruitless. In districts 1, 2, 3, 8 for the first time, ticks were collected in 1996, in district 13 it occurred in 2000, and in district 15 it happened in 2002.
In district 15 (central group), no ticks were found between 1991 and 2001, when 30.7 km of road were flagged. The first ticks were collected in 2002, and then the number of ticks collected annually increased steadily during 2006–2009 seasons, when 20.0 km of road were flagged. Respectively, during the peak of tick activity (in June), 0.8 tick/km of road was collected in 2006, 1.4 tick/km in 2007, 4.3 tick/km of road in 2008, and 4.7 tick/km of road in 2009. An average, 87% of ticks was collected in May and June of each year.
Ixodes persulcatus P. Sch. represented 99.2% of all collected Ixodid ticks, whereas Ixodes ricinus represented 0.8%.
Geographical and seasonal distribution of AO inhabitants bitten by ticks
In AO, the average annual number of tick-bitten inhabitants was 284 in 1980–1989, 1,462 in 1990–1999, and 3,976 in 2000–2009. Respectively, the number of TBE cases increased 40-fold in 30 years: from 162 in 1980 to 6,450 in 2009.
After year 2000, tick bites were reported not only in southern but also in central and even in northern AO districts. In northern districts 14 and 16, BIR reached 10–100, whereas sporadic cases were reported in districts 10, 11.
Therefore, BIR10 was 18 in 1980–1989, and 309 in 2000–2009, i.e. there was 17-fold increase in the index between two decades compared.
BIR10 was zero or negligible (<10) in 1980–1989 in four northern and three central districts, in 1990–1999 it was so in four northern districts, but only in two northern districts in 2000–2009.
In 1990–1999 and in 2000–2009, the increase in BIR10 was not uniform in all areas: increased 2.5-fold in the southern group, whereas 4.8-fold increase was recorded in the central group, and 14-fold increase in the northern group of AO districts.
BIR10 for the period between 1980 and 2009 is shown in and .
Fig. 2. (A) BIR10 in AO averaged over each decade: 1 <10; 2 10–100; 3 100–1000; 4 >1,000. (B) TBE incidence rate in AO averaged over each decade: 1 0.0–0.1; 2 0.1–1; 3 1–10; 4 10–100.
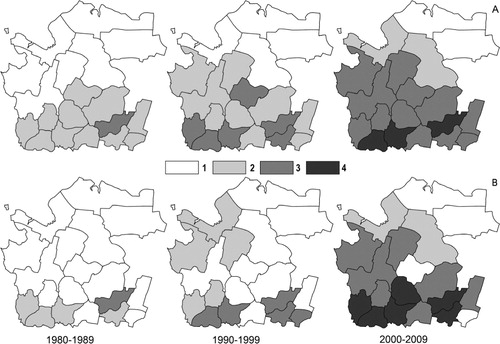
Table 3. BIR10and the length of tick bite reporting period for groups of AO districts
The length of tick bite reporting period in 2000–2009 expanded in comparison with 1980–1989 in 20-fold in the northern group, twofold in the central group, and 1.5-fold in the southern group ().
In 2001–2009, AO inhabitants were bitten by ticks during their vacation or recreational outdoor activities (66.9%), in their garden of summer cottages (20.6%), during their business activities (8.1%), or during land reclamation and development (4.4%).
TBE virus prevalence in ticks
In average, 1.6% of questing ticks collected from plants were infected with TBE virus. The maximum TBE virus prevalence (4.5%) was recorded in 1996 when 134 ticks were tested, and in 2002 (3.9%) when 78 ticks were tested. Thus, there is no uptrend in TBE virus prevalence in ticks.
TBE incidence rate
In 1980–2009, 920 TBE cases were reported officially in AO. Their temporal distribution evidences an increase in number of cases, despite continuous decrease in AO population. Thus, within the first decade under consideration (1980–1989), only 16 cases were diagnosed, and in some years (e.g. 1981 and 1982) there were none. Within the second decade (1990–1999), there were 207 cases, and 697 cases were reported during the third decade (2000–2009).
TBE mean annual incidence rate was 0.1 in 1980–1989 and 5.4 in 2000–2009. The maximum annual TBE incidence rate of 9.9 was recorded in 2009.
When TBE incidence in AO was compared with the national incidence of TBE in Russia, the following trends were observed’.
The incidence of TBE was increasing both in Russia and in AO during 1980–1999; national TBE incidence was significantly higher compared to that observed in AO.
The national TBE incidence plummeted between 2000 and 2008, whereas in AO the TBE incidence continued to increase during the same period. In 2009, TBE incidence in AO was three times higher than that nationally reported in Russia as a whole ( and ).
Fig. 3. TBE incidence in AO and in Russia as a whole in 1980—2009.
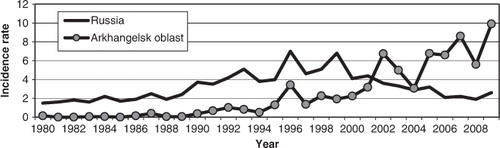
Table 4. Comparison of mean for decades TBE incidence rate in Russia and in AO
An increasing TBE incidence in AO parallels the change in geographical distribution of TBE cases. In 1980s, TBE cases occurred only in the southern group districts, but after 2000, cases occurred nearly all over AO territory. The most significant growth in TBE incidence was observed in the central group of districts, where it was <0.1 in 1980–1989, whereas in 2000—2009, it peaked to 1–10 or even 10–100 per 100,000 of inhabitants ().
It is likely that in most cases, patients acquired TBE virus through a tick bite, because a strong correlation was established between BIR and TBE incidence in AO (correlation coefficient is 0.97; p<0.0001). According to the epidemiological survey data, the prevalence of alimentary acquired infection was small and calculated to be 0% in 1980–1990, 5.2% in 1991–2000, and 1.3% in 2001–2009.
Climate change and CBE incidence
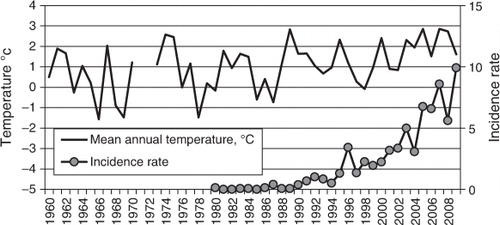
In AO, mean annual air temperature between 1960 and 1989 varied from –1.5 to +2.6°C, being +0.7°C in average.
In 1990s, a gradual ascent of AO annual mean temperature started that peaked at +3°C in 2007. In 2000—2009, the mean annual air temperature was + 2.0°C, which was +1.3°C above the level of 1960–1989, and TBE incidence increased synchronously with temperature ().
Fig. 4. Mean annual temperatures (1960–2009) and TBE incidence rates in AO (1980–2009).. Note: AO temperature data for 1971 and 1972 are not available.
In the southern group of AO districts within the same period, mean annual air temperatures increased from +1.7°C (in 1960–1989) to +3.0°C (in 2000–2009). During1980s in AO, the TBE incidence was stable and negligible but in early 1990s it began to grow and in 2009 it reached 27 per 100,000 of inhabitants ().
Fig. 5. Mean annual temperatures (1960–2009) and TBE incidence rates (1980–2009) in the (A) southern; (B) central; (C) northern group of AO districts. Note: AO temperature data for 1971 and 1972 are not available.
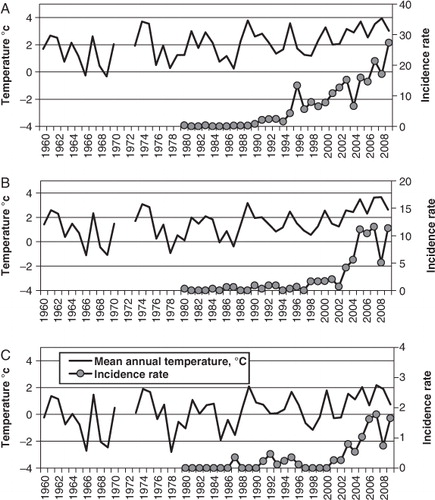
Within the same period in the central group of AO districts, mean annual temperature rose from +1.1 to +2.1°C (with a slightly cooler period in 1970s). Here, the steady growth in TBE incidence began at the end of 1990s; and in 2009 the local TBE incidence exceeded 11 per 100,000 of population ().
In the northern group of AO districts, mean annual air temperature was –0.2°C in 1960–1990, and increased to +1.2°C in 2000–2009. Some increase in TBE incidence was observed only after 2005, and still did not exceed two per 100,000 of population ().
During 1980–1990 in AO, the TBE incidence was stable and low with mean values (standard deviations) as follows: 0.03 (0.11) in the northern districts; 0.25 (0.33) in central districts, and 0.19 (0.24) in southern districts.
After 2000, the TBE incidence increased dramatically, and in 2009 it reached 1.65 in the north, 11.38 in the centre, and 27.37 in the south of AO.
The correlation analysis of AO mean annual air temperatures and TBE incidence in 1990–2009 resulted in .
Table 5. Correlation analysis of the mean annual AO air temperatures and TBE incidence in AO during 1990–2009
The regression analysis was performed to assess the correlation between the temperature and TBE incidence in AO. It was estimated that TBE incidence was <0.1 at mean annual temperature below +2°C; therefore, in our statistic calculations, those lower temperatures were excluded. The maximum correlation coefficient R=0.77 (0.74–0.80, p=0.0013) was obtained when this exclusion criteria applied ().
Fig. 6. The results of regression analysis of TBE incidence and mean annual air temperatures in AO in 1980–2009.
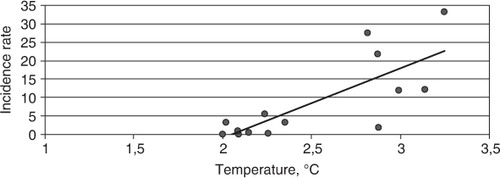
It is significant with probability 99.9%.
The complete development cycle of I. persulcatus requires that the sum of annual effective temperatures was at least 1,400°C within the period with daily average temperatures exceeding +10°C Citation10.
The calculation of the sums of annual effective temperatures averaged over the corresponding decades (see ) has shown that heat provision in all AO districts during the tick active season increased significantly in 2000–2009 compared with 1980–1989. Its increase was the most remarkable in central and southern districts of AO.
Fig. 7. Sums of annual effective temperatures exceeding 10°C averaged over decades for northern, central, and southern groups of AO districts.
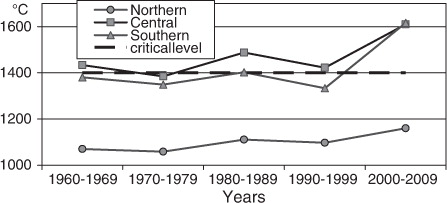
Therefore, the corresponding sums of annual effective temperatures in average were very close to the critical level required for I. persulcatus development both in southern and central districts in 1980–1999, and they significantly exceeded temperature requirements in 2000–2009.
The sum of annual effective temperatures was much below 1,400oC during the same periods in the northern districts. It was only during the recent 10 years that the critical level was reached in AO.
In AO, the period of effective temperatures increased certainly: from 82 (north), 102 (centre), and 108 (south) in 1960–1969 to 87, 112, and 121 accordingly in 2000–2009. It means that within 50 years, the increment of favorable period was 5 days in the north, 10 days in the centre, and 13 days in the south of AO.
Total atmospheric precipitations in AO increased not much: from 548 mm in 1970–1980 to 641 mm in 2001–2008. Such growth in total atmospheric precipitations is not significant for ticks’ ecology, as AO has humid climate where average annual precipitation exceeds average annual evapotranspiration.
Discussion
The climate change may impact directly on Ixodid ticks habitats because both temperature and humidity are of greatimportance for their life cycle Citation8 Citation10.
In 1960s, the northern distribution of I. persulcatus in AO was limited by 62nd parallel, and those ticks were found a little further northward only along Northern Dvina River Citation11. In 2000s, I. persulcatus started to be found every year in the central districts of AO; and the findings tended to increase. The tick invasion into AO central districts became possible due to considerable increase of both mean annual air temperatures and number of days with ‘effective’ temperatures (exceeding 10oC); the corresponding sums of effective temperatures increased as well.
Currently, the centre of AO has adequate temperature conditions for the establishment of I. Persulcatus, whereas the temperature regimen at AO northern districts is yet not optimal for the life cycle of I. persulcatus.
It should be mentioned that moisture regimen in AO was adequate and even favorable for I. persulcatus life cycle at least within recent 30 years.
The tick encroachment on the territory of AO central and northern districts is fortified by BIR figures estimated over last 30 years. The data on tick bite incidence are rarely found in international publications [see, however, Citation12 Citation13], as, in contrast to Russia, they do not trace it in most of other countries. Of course, BIR figures do not give the real number of tick bite victims, because considerable portion of tick-bitten population never seeks medical care. However, the many year surveillance of BIR in AO contributes significantly to our knowledge of the changes in Ixodid ticks habitats. Therefore, in 1980—1989, BIR was low both in the southern and central districts, and <0.1 in the northern zone. In contrast to that in 2000—2009, BIR was very high in the southern, and rather high in all central and even in some northern districts. Even having in mind that BIR uptrend to some extent may be attributed to the increased TBE awareness of AO population (and throughout Russia), and hence more frequent seeking of medical care, we cannot ignore considerable difference in BIR increments in different AO zones. We believe that during the 1980s, many AO districts were entirely free of I. persulcatus, and hence nobody suffered of tick bites. Subsequent invasion of Ixodid ticks resulted in significant BIR increase.
It was also established that the average tick aggression period expanded with the mean air temperatures in AO.
The similar situation was reported in Komi Republic adjacent to AO; in its northern districts, there was a dramatic growth both of BIR and TBE incidence after 2000 as to compare with the earlier period Citation14.
Those data on AO and Komi Republic support the assessments of the changes in I. persulcatus habitats based on simple empirical models that relate temperature regimen and precipitations with the establishment of Ixodid ticks habitats Citation15.
Northward invasion of I. ricinus related to the temperature increase was reported in Sweden. Several factors were responsible for higher TBE incidence: the growth of tick abundance, their longer life cycle, more frequent visiting of TBE-endemic forests by humans, and the growth in number of animal hosts Citation16 Citation17. A similar picture was observed in Czech Republic, where TBE virus-infected I. ricinus, started to be found much higher in mountains than in earlier period, and TBE in humans started to be registered correspondingly Citation18 Citation19. It should be noted that the aforementioned studies were inspired by TBE incidence increase due to I. ricinus bites.
The data from Estonia provide more evidence that the warming climate promotes the growth of vector population and prolongs the active period of the vectors. It provides favorable conditions for TBE virus circulation in their natural foci Citation20.
The present study differs from those cited earlier, because it was carried out in a region where Ixodes persulcatus dominates absolutely. Its biological properties are quite different from those of I. ricinus, because it is much more cold-resistant tick and hence its habitat may expand much further northward. In general, the TBE virus load in I. persulcatus exceeds significantly that in I. ricinus Citation10.
The vast majority of TBE cases in AO occurred due to tick bites, consequently considerable increase in TBE incidence might result from the expansion of I. persulcatus habitat. Strong correlation between BIR and TBE incidence was established in AO.
TBE virus prevalence in I. persulcatus should not be considered as a significant factor in AO as it remained actually unchanged within the period under consideration.
TBE incidence rates recorded in 2000–2009 in AO exceeded those in 1980–1989 more than by 50 times.
In the central group of AO districts, very high correlation coefficients between TBE incidence and mean annual air temperature are descriptive of strong and synchronous variations of air temperatures and TBE incidence.
The similar uptrend in TBE incidence was observed in Komi Republic that is an eastern neighbor of AO.
The climate warming may have impact on human behavior as it allows longer and more comfortable stay under the open sky. Variation in human activities may impact on both the enzootic cycles and the degree of human exposure to those cycles also providing explanations for TBE upsurges, e.g. in some European countries Citation21.
The vaccination against TBE is still not sufficient in Russia Citation22 (AO including); however, the number of vaccinated AO inhabitants increased from 204 in 1990 to 20,987 in 2009. It means that TBE incidence grew in spite of vaccination improvements (data by Rospotrebnadzor in AO). The effect of some other factors influencing TBE incidence in AO cannot be ruled out, and a separate publication should be devoted to them.
The northward expansion of Ixodid ticks necessitates the updating of preventive measures against tick-borne diseases. Earlier, it was already shown that taiga ticks collected in AO were commonly infected with the pathogens of tick-borne borreliosis Citation23 and by Anaplasma and Ehrlichia species Citation24. Those findings advocate the needs for further development of improved and sophisticated laboratory diagnosis tools, and, for continuous education of population about proper attitudes and prevention of tick bites and tick-borne infections, including TBE.
Conclusions
The pronounced northward expansion of I. persulcatus had occurred during 1980–2009 in AO, in the north of European Russia.
The expansion of ticks correlated with considerable increase of both the mean annual air temperatures and the sums of effective temperatures that determine compatible temperature conditions for I. persulcatus establishment at new territories.
The obvious uptrend in TBE incidence in AO is related considerably to the expansion of I. persulcatus habitat. The territory where TBE cases are reported enlarged significantly. Climate changes contribute much to the TBE incidence increase.
Conflict of interest and funding
The authors have not received any funding or benefits from industry to conduct this study.
Acknowledgements
This publication has been developed within the WHO/BMU project on protecting health from climate change in Europe, coordinated by Drs Menne and Nurse, WHO Regional Office for Europe. We are grateful for the financial support received from Germany. The authors heartily thank Drs M.E. Eremeeva and G.A. Dasch from CDC (USA) for reading the manuscript and stimulating comments and Dr B.A. Revich from the Institute of Economic forecasting, RAN (Russia) for useful consultations.
Related Research Data
References
- Zygutiene M. Tick-borne encephalitis-the most relevant to public health flavivirus infection in the EpiNorth region. EpiNorth. 2011; 12: 31–2.
- Jaaskelainen A, Korhonen T, Kuusi M, Vapalahti O. Tick-borne encephalitis in Finland. EpiNorth. 2011; 12: 40–3.
- Glushkova L, Galimov R. Ecological and epidemiological aspects of tick-borne encephalitis in the Republic of Komi and disease prevention. EpiNorth. 2011; 12: 44–50.
- Leonova GN, Belikov SI, Pavlenko EV, Kulakova NV, Krilova NV. Biological and molecular-genetic characteristics of TBE virus far-east population and its pathogenic meaning [Russian]. Probl Virol. 2007; 6: 13–17.
- Süss J. Tick-borne encephalitis in Europe and beyond – the epidemiological situation as of 2007. Euro Surveill. 2008; 13(26): 1–8. Available online: http://www.eurosurveillance.org/ViewArticle.aspx?Articicleld = 18916. [cited 12 October 2011].
- Gray JS, Dautel H, Estrada-Peña A, Kahl O, Lindgren E. Effects of climate change on ticks and tick-borne diseases in Europe. Interdiscip Perspect Infect Dis. 2009; 2009: 593232. Published online 2009January4. 10.3402/gha.v4i0.8448. Available online: http://www.pubmedcentral.nih.gov/articlerender.fcgi?tool = pubmed&pubmedid = 19277106. [cited 12 October 2011].
- Jaenson TGT, Tälleklint L, Lundqvist L, Olsen B, Chirico J, Mejlon H. Geographical distribution, host associations, and vector roles of ticks (Acari: Ixodidae, Argasidae) in Sweden. J Med Entomology. 1994; 31: 240–56.
- Goodman JL, Dennis TD, Sonenshine DE. Tick borne diseases of humans. New York: American Society of Microbiology Press. 2005.
- Vorobyeva MS, Rasshchepkina MN, Ladyzhenskaya IP. Vaccines, immunoglobulins, and test systems for the prevention and diagnosis of tick-borne encephalitis [Russian]. Probl Virol. 2007; 6: 30–6.
- Balashov YuS. Ixodid ticks-parasites and vectors of diseases [Russian]. Nauka. St. Petersburg, 1998; 287.
- Korenberg EI, Jukova VI, Shatkauskus AV, Bushueva LK. Distribution of the taiga tick (Ixodes persulcatus) in the USSR [Russian]. J Zoology. 1969; 48: 1003–14.
- Wahlberg P. Incidence of Tick-bite in man in Aland Islands: reference to the spread of Lyme Borreliosis. Scand J Infect Dis. 1990; 22: 59–62. 10.3402/gha.v4i0.8448.
- Karaban I, Vedenkov A, Yashkova S, Sebut N. Epidemiology of tick-borne encephalitis and Lyme disease in the Republic of Belarus, 1998–2007. EpiNorth. 10; 2009: 48–57.
- Gnativ BR. Epidemiological activity behavior of natural TBE focus in the territory of Komi republic. Development of research and surveillance over infection diseases. Materials of International conference [Russian]. Jebrun ABPasteur Institute. St. Petersburg, 2010; 26.
- Yasukevich VV, Kazakova EV, Popov IO, Semenov SM. Distribution of Ixodes ricinus L., 1758 and Ixodes persulcatus Shulze, 1930 sitiformes ixodidae in Russia and adjacent countries and observed climate changes [Russian]. Proc Acad Sci Geo. 2009; 427: 688–92.
- Lindgren ?, Talleklint L, Polfeldt T, Impact of climatic change on the northern latitude limit and population density of the disease-transmitting European tick Ixodes ricinus. Environ Health Perspect. 2000; 108: 119–23.
- Lindgren ?, Gustafson R. Tick-borne encephalitis in Sweden and climate change. Lancet. 2001; 9275: 16–18.
- Daniel M, Danielova V, Kriz B, Kott I. An attempt to elucidate the increased incidence of tick-borne encephalitis and its spread to higher altitudes in the Czech Republic. Int J Med Microbiol. 2004; 293: 55–62.
- Daniel M, Zitek K, Danielova V. Risk assessment and prediction of Ixodes ricinus tick questing activity and human tick-borne encephalitis infection in space and time in the Czech Republic. Int J Med Microbiol. 2006; 296: 41–7. 10.3402/gha.v4i0.8448.
- Epstein E, Kutsar K. Epidemiological trends of tick-borne encephalitis in Estonia. EpiNorth. 2009; 10: 58–62.
- Randolph SE. Human activities predominate in determining changing incidence of tick-borne encephalitis in Europe. Euro surveillance: bulletin europeen sur les maladies transmissibles. Eur Commun Dis Bull. 2010; 15: 24–31.
- Onishchenko GG, Fedorov YuM, Paskina ND. Organization of supervision of tick-borne virus encephalitis and ways of its prevention in the Russian Federation [Russian]. Probl Virol. 2007; 5: 8–10.
- Tokarevich N, Stoyanova N, Chaika N, Buzinov R. Lyme's disease in Arkhangelsk province of the Russian Federation. EpiNorth. 2002; 3: 35–7.
- Eremeeva M, Oliveira A, Moriarty J, Robinson J, Tokarevich N, Antyukova L, et al.. Detection and identification of bacterial agents in Ixodes persulcatus Schulze ticks from the north western region of Russia. Vector-borne Zoonotic Dis. 2007; 7: 426–36. 10.3402/gha.v4i0.8448.