Introduction
Population monitoring and screening of blood pressure is an important part of any population health strategy. Qualified health workers are expensive and often unavailable for screening. Non-health workers with electronic blood pressure monitors are increasingly used in community-based research. This approach is unvalidated. In a poor, urban community we compared blood pressure measurements taken by non-health workers using electronic devices against qualified health workers using mercury sphygmomanometers.
Method
Fifty-six adult volunteers participated in the research. Data were collected by five qualified health workers, and six non-health workers. Participants were randomly allocated to have their blood pressure measured on four consecutive occasions by alternating a qualified health worker with a non-health worker. Descriptive statistics and graphs, and mixed effects linear models to account for the repeated measurement were used in the analysis.
Results
Blood pressure readings by non-health workers were more reliable than those taken by qualified health workers. There was no significant difference between the readings taken by qualified health workers and those taken by non-health workers for systolic blood pressure. Non-health workers were, on average, 5–7 mmHg lower in their measures of blood pressure than the qualified health workers (95%HPD: −2.9 to −10.0) for diastolic blood pressure.
Conclusion
The results provide empirical evidence that supports the practice of non-health workers using electronic devices for BP measurement in community-based research and screening. Non-health workers recorded blood pressures that differed from qualified health workers by no more than 10 mmHg. The approach is promising, but more research is needed to establish the generalisability of the results.
The substantial and growing burden of non-communicable diseases Citation1, many of which are associated with hypertension, has necessitated population-based strategies for monitoring and screening blood pressure Citation2 Citation3. Population studies, such as the NHANES III and the Health Survey for England used health professionals to obtain blood pressure readings Citation4–Citation11; with some professionals using mercury sphygmomanometers Citation12 – the gold standard for the indirect, non-invasive, measurement of blood pressure Citation13 – and some using electronic devices Citation14. Health care professionals, however, add significantly to the cost of health research and screening programmes, and in many settings (particularly resource-poor communities) there simply are not the professionals available Citation15. Given the lack of capacity, it is important to explore the use of community-based, non-health workers as a replacement.
One possible impediment to non-health workers is that mercury sphygmomanometers require significant training, but electronic monitors do provide an obvious alternative Citation16. The use of electronic monitors by non-health workers is not new Citation17–Citation19, but the approach does not appear to have been validated. One recent study using non-health workers cited a systematic review of electronic blood pressure devices to underscore the validity of their approach Citation18. Significantly, however, the review was of clinical validation studies, or community-based studies using qualified health care professionals Citation20 Citation21. Several other studies that discuss validation in community settings also used qualified health staff, often in a clinical setting Citation22–Citation25.
The problem is that the sources of error in the measurement of blood pressure are attributable to both the device and the operator Citation16 Citation26. It is, thus, not sufficient to validate the device alone, one needs to validate the combination of the device and the operator, but this is almost never done Citation26–Citation31. If the reliability and validity of blood pressure measurement in a community setting using non-health workers can be established empirically, this will have significant implications for future population health research; if not, the results will throw into doubt a large number of existing studies.
The broad question motivating this research was whether, under the same conditions in a community setting, non-health workers using an electronic device would on average obtain a diastolic and a systolic blood pressure reading within 10 mmHg of a qualified health professional using a mercury sphygmomanometer. A variation of 10 mmHg may be unacceptable in a clinical setting Citation32, although such variations are probably quite common Citation33, but for the purposes of population health screening and research, this was regarded as adequate.
Methods
Devices
Blood pressure was measured using mercury sphygmomanometers (Spirit brand, model number CK-101C), and electronic, automatic blood pressure monitors (Omron brand model HEM-7203). The electronic devices used pulse wave oscillometry and a proprietary algorithm to estimate blood pressure.
Setting
The data collection occurred in an urban, low-income community, of the Klang Valley near Kuala Lumpur, Malaysia.
Data collectors
Five medical practitioners with regular, current clinical experience measuring blood pressure using mercury sphygmomanometers were used as the health professionals in this study.
A non-health worker was categorized as an individual with a minimum of a high school education and no formal qualification in a health related profession. The non-health workers in this study were five volunteer medical students, three weeks into their first semester of enrolment, and without any exposure to clinical practice. Four of the students had no previous experience of blood pressure monitoring; one had used an electronic blood pressure device at home. The non-health workers received 30 min training in the use of the electronic device. The training was significantly less than the two weeks ‘familiarisation’ typically allowed in clinical validation studies Citation34, but more realistic in terms of population health studies.
One of the non-health workers was called away part way through data collection. He was replaced by a research assistant who had no prior experience taking blood pressure, but had been present during the training of the non-health workers. He received a 10 min ‘refresher’ tutorial.
Participants
Participants were volunteers attending a local community health event. Following the NHANES III protocol, the exclusion criteria were rash, plaster casts, oedema, paralysis, open sores or wounds, blood drawn from arm within the last week, a withered arm, or physical obstructions (such as tubes) Citation35. Seventy adults volunteered; 14 were excluded because their arm circumferences were greater than the upper limit for the electronic devices’ cuff size. Of the remaining 56 participants, there were 15 males ranging in age from 23 to 59, and 41 females ranging in age from 18 to 74.
Procedure
Data collection occurred over a 4-hour period starting at 11 am on a single day. Individual blood pressure measurement commenced after the person had given informed consent, the inclusion criteria were satisfied, and personal information was obtained. Data were recorded on age, sex, whether the participant was pregnant (for women), had a known history of diabetes or a known history of hypertension.
Each participant had their blood pressure measured eight times in total. The order of measurement was always twice by a randomly allocated medical practitioner with their own allocated mercury sphygmomanometer (T1), twice by a randomly allocated non-health worker with their own allocated electronic device (T2), twice by a second randomly allocated medical practitioner with their own allocated mercury sphygmomanometer (T3), and finally twice by a randomly allocated non-health worker with their own allocated electronic device (T4). Because data collectors were randomly allocated to each participant ID prior to the commencement of the study, by chance, some data collectors conducted more blood pressure measures than others.
Diastolic and systolic blood pressures were recorded twice by each data collector, on the left arm only. Between 30 seconds and 1 min elapsed between repeated measurements to minimize venous congestion. Participants were seated to wait for the next allocated data collector on the participant's card, until he or she had seen all four data collectors in the allocated order.
Each data collector was allocated their own device (mercury or electronic) for the entire data collection period, and was blind to the readings of the other data collectors. Participants were blind to all readings.
Data analysis
Data collectors recorded two systolic and two diastolic readings for each participant. For the purposes of analysis, a data collector's diastolic readings were averaged, as were the systolic readings. The distribution of blood pressure readings were examined for normality. The distribution of systolic blood pressure was significantly non-normal, and log transformed for the purposes of statistical modelling.
The data were initially examined using graphical techniques including Bland–Altman plots to contrast two measurement instruments Citation36. The statistical modelling employed two-level, linear mixed effects models in which the blood pressure readings were treated as a repeated measure (level-1), within participant (level-2) Citation37. The order in which the testing occurred (which also subsumed the type of device used, and the qualification of the data collector) was included as a fixed factor (having discounted the value of including it as a crossed random factor). The models were ‘random intercepts’ models. Effects of age, sex, and clinical history (hypertension or diabetes) were included as fixed covariates in the modelling. Age was centred on the median (49 years).
For the diastolic and the (log) systolic blood pressures, three models were fitted:
A null (unconditional means) model with no fixed effects, and participant as a random effect.
A full model with the order of measurement and age, sex, hypertension and diabetes history as fixed effects, and participant as a random effect.
A reduced model with the order of measurement and any significant covariates from the full model included as fixed effects, and participant as a random effect.
Maximum likelihoods estimation was used for the model development, the appropriateness of the reduced model selection was based on the Akaike Information Criterion (AIC), a goodness of fit statistic that takes account of the change in the deviance and penalises the model fit for the inclusion of extra parameters Citation38. Markov Chain Monte Carlo (MCMC) methods were used to estimate the posterior density based on the fitted model, and hence the significance of the fixed effects Citation39. The 95% highest probability densities (95%HPD) and the test of significance were both estimated using this approach.
All analyses and graphs were created within the R statistical environment Citation40. The lme4 package was used for the linear mixed modelling Citation41.
Ethics
The study protocol was reviewed and approved by the Monash University Human Research Ethics Committee (approval number: CF11/0583 – 2011000263). All participants provided informed consent.
Results
Summary results for the diastolic and (untransformed) systolic readings are shown in .
Table 1. Summary statistic for systolic and diastolic blood pressure in mmHg, measured with mercury and electronic devices at four different times (T1–T4)
The average systolic blood pressure of the participants (∼127 mmHg) was consistent with the classification of prehypertensive in a clinical setting, and the average diastolic blood pressure, depending on the timing and the device/operator used, was generally consistent with a classification of blood pressure in the desirable range Citation42.
There were broad points of similarity and difference between the measures. With respect to the systolic maximum and minimum values, the mercury devices (i.e. operated by qualified health workers) have lower values than the electronic devices (i.e. operated by non-health workers), but all have similar means and medians. With respect to the diastolic values, the electronic devices record lower mean and median values than the mercury devices (around 5 mmHg), and also recorded lower maximum values.
Bland–Altman plots show the difference between two measures against the average value of the two measures (a and b) Citation36. ‘Agreement’ is related to both the mean difference between the readings on the two devices, and the amount of variation in the differences.
Fig. 1. Bland–Altman plots of the blood pressure differences between each possible pair of device-operator combination: (a) diastolic pressure and (b) systolic pressure. The solid horizontal line indicates the mean difference between the measures, the dashed horizontal lines indicate the 95% limits of agreement.
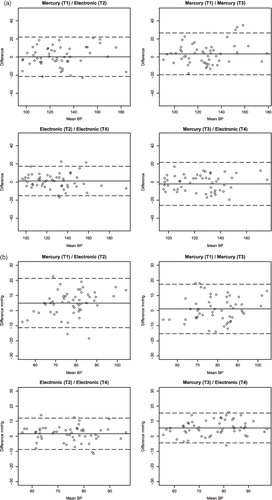
a shows four Bland–Altman plots for the measures of systolic blood pressure: the mercury device (Time 1) against the electronic device (Time 2) and against the mercury device (Time 3), as well as the electronic device (Time 2) against the electronic device (Time 4). There are, thus, comparisons of similar devices with each other, and comparisons of different devices at adjacent times. The solid horizontal line indicates the mean difference between the blood pressure readings for the two comparison devices. The dashed horizontal lines show the 95% limits of agreement around the mean difference.
It is immediately apparent the mean differences between the devices were all close to zero; i.e. on average, the difference between the readings of the two devices was close to zero. The 95% limits of agreement (i.e. the variation in the differences) were narrowest for the comparison of the two electronic devices (95%LA: 1.1±16 mmHg), and the widest limits of agreement occurred for the comparison of the mercury device (T3) and the electronic device (T4) (95%LA: –2.1±24 mmHg).
b shows the equivalent plots for diastolic blood pressure. The mean differences were closest when comparing identical types of device (1.7 and 1.1 mmHg) than comparing across device type (5 and 5.6 mmHg). The two electronic devices showed the strongest agreement (95%LA: 1.7±10 mmHg). The comparison of the two mercury devices showed a marginally lower mean difference, but wider 95% limits of agreement (95%LA: 1.1±16 mmHg). The comparison of the mercury device (T3) and the electronic device (T4) had a comparatively large mean difference but relatively narrow limits of agreement (95%LA: 5.6±10 mmHg). The comparison of the mercury device (T1) and the electronic device (T2) showed a similar mean difference but much wider limits of agreement (95%LA: 5±16 mmHg).
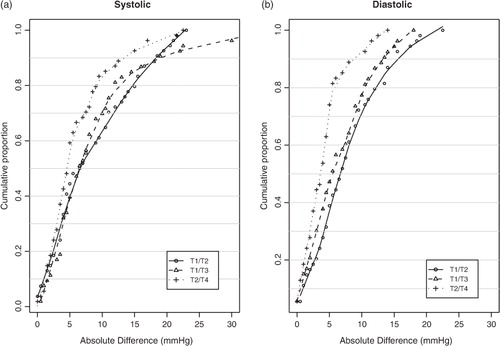
By examining the cumulative proportion of blood pressure measurements that differ by no more than a given amount, one can gain a clearer sense of the reliability (though not the validity) of the measures. shows an ogive of the absolute differences in blood pressure measurements between: the mercury device (Time 1) and the electronic device (Time 2), the two mercury devices (Time 1 and Time 3), and the two electronic devices (Time 2 and Time 4), for both systolic and diastolic blood pressure. A Lowess curve was used to smooth out the point-to-point variation and provide a visual interpolation of the ogives. For almost any proportion of blood pressure measurements, the variation was less between the two electronic devices (Time 2 and Time 4) than for any other combination of device. Ninety percent of the electronic devices systolic blood pressure readings had a difference of no more than 13 mmHg (Time 2 and Time 4), while the two mercury devices measured systolic blood pressure had a difference of no more than 18 mmHg (Time 1 and Time 3) – almost exactly the same as for the difference between the first mercury device and the first electronic device (Time 1 and Time 3). A similar pattern was observed for diastolic blood pressure readings, except that the absolute differences were consistently higher for the first mercury device and the first electronic device (Time 1 and Time 3) than for the two mercury devices (Time 1 and Time 3).
Fig. 2. Ogives showing the proportion (y-axis) of blood pressure measures with an absolute difference of no more than a certain pressure (x-axis) for three of the four possible pairs of device-operator combinations.
The repeated blood pressure measures within individual participants, the order of measurement, and the possible effects of covariates such as participants’ age and sex make it difficult to obtain a complete picture of the relationship between the readings obtained from the mercury and electronic devices. A linear, mixed effects model was used to manage the repeated measurements, the order of measurement (type of device operator combination), and the individual participants’ covariates. The analysis of systolic blood pressure used log-transformed data.
Unsurprisingly, there was substantial clustering of the blood pressure readings among participants (systolic ICC = 0.86; diastolic ICC = 0.76). shows the results for the null (unconditional means), full (order of measurement and covariates) and reduced (order of measurement, and significant covariates) models. The parameter estimates for the fixed effects, the AIC, and the variance components are shown.
Table 2. The null, full and reduced, mixed-effects linear models of blood pressure measurement
For the (log) systolic model, there was little difference between the fixed effects estimates in the full and the reduced models; however, the reduced model provided a better fit to the data than the full model: AIC of –441 in the full model versus –446 in the reduced model. The only significant covariate was age. The order of testing, and by extension the type of device, showed no significant difference in the readings obtained by non-health workers using electronic devices and health workers using mercury devices. The average systolic reading for the base participant (male, aged 49, at Time 1) was around 122 mmHg (i.e. e 4.8 mmHg). Keeping the base participant in mind, the greatest likely variation in BP reading (i.e. at the limit of the 95%HPD) associated with a non-health worker using an electronic device (Time 4) was 6 mmHg (e 4.8–0.047 mmHg), which was slightly less than the greatest likely variation associated with the second reading by a health professional using a mercury device (Time 3).
The pattern was somewhat different for the diastolic, reduced, model. Like the systolic model, age was the only significant covariate. On the other hand, electronic devices operated by non-health workers resulted in, on average, a significantly lower average diastolic reading than the mercury devices operated by medical practitioners: between 5 (Time 2) and 7 (Time 4) mmHg lower. The reduced model provided a better fit to the data than the full model: AIC of 1480 in the full model versus 1477 in the reduced model. The average diastolic reading for the base participant (male, aged 49, at Time 1) was around 80 mmHg. Keeping the base participant in mind, the greatest likely variation in blood pressure reading (i.e. at the limit of the 95%HPD) associated with a non-health worker using an electronic device (Time 4) was 10 mmHg.
Discussion
Community based, population research and screening that involves blood pressure monitoring will be an increasingly important part of any non-communicable diseases strategy, and valid, reliable and cost-effective methods of measurement will be required. The results from this study, the first to validate blood pressure measurement by non-health workers in a community setting, suggest that with an electronic blood pressure measurement device and a little training, non-health workers may provide a suitable alternative to qualified health workers. Although, the diastolic blood pressure measurements taken by non-health workers using electronic devices were on average lower (7 mmHg) than measurements taken by health workers, the difference was within reasonable bounds. Furthermore, independent readings by two different non-health workers showed less variation, that is greater agreement, than did two independent readings by the qualified health workers. There was no significant difference in systolic blood pressure taken by non-health workers using an electronic device and health workers using a mercury sphygmomanometer; and, again, independent readings by two different non-health workers showed greater agreement, than did two independent readings by health workers.
The findings are, broadly consistent with the validation literature on the use of electronic blood pressure devices in clinical settings, and should reassure readers of the validity (although untested at the time) of those earlier studies that used non-health workers taking blood pressure measurements in community settings Citation20–Citation25. One should bear in mind, however, that the kind of agreement in clinical validation studies that is achievable with the simultaneous measurement of blood pressure at a single point in time will always outperform the levels of agreement achievable with serial measurements.
There are, nonetheless, some issues with the findings, and they need to be interpreted within context. In community-based research and screening, there is no opportunity to obtain a gold standard (invasive) measure of blood pressure, and we are currently reliant on the gold standard for the indirect, non-invasive, measurement of blood pressure – a health worker with a mercury sphygmomanometer Citation13. Given the variability in the measurements by the medical practitioners, however, the extent to which this is a reasonable gold standard in a community-based setting is moot. It is also known, for instance that individual blood pressure can vary substantially, and clinical measurements (where the gold standard is applied) correlate poorly with measurements taken in the community Citation33 Citation43. The difference, however, is not simply an artefact of mis-measurement; it is also an artefact of genuine variation in individual blood pressure across settings. This is one of the challenges of implementation research, where one is moving out of clinical environments into ‘real world’ settings which necessarily involve a loss of experimental and/or clinical control Citation44.
This study was relatively small; it relied on a handful of non-health workers, a handful of health practitioners, and only one model of electronic sphygmomanometer. The study was also community-based and not home-based. Replication studies in different populations and different field settings with different devices are warranted. Notwithstanding this, given the cost of the devices and the relatively cheap labour costs associated with non-health workers, the evidence would appear to support the adoption for community-based, population health research. Cost effectiveness studies would be particularly useful in determining this.
Conflict of interest and funding
The authors received a donation of five electronic blood pressure monitors from Omron Healthcare to conduct this study.
Acknowledgements
We would like to thank the staff of Global Public Health for their logistical support, and the community participants for their patience. The electronic blood pressure monitors were donated by Omron Healthcare.
References
- Beaglehole R, Bonita R, Horton R, Adams C, Alleyne G, Asaria P, et al.. Priority actions for the non-communicable disease crisis. Lancet. 2011; 377: 1438–47. 10.3402/gha.v5i0.14876.
- Bovet P, Hirsiger P, Emery F, De Bernardini J, Rossier C, Trebeljahr J, et al.. Impact and cost of a 2-week community-based screening and awareness program for diabetes and cardiovascular risk factors in a Swiss canton. Diabetes Metab Syndr Obes. 2011; 4: 213–23.
- Sorof JM, Turner J, Martin DS, Garcia K, Garami Z, Alexandrov AV, et al.. Cardiovascular risk factors and sequelae in hypertensive children identified by referral versus school-based screening. Hypertension. 2004; 43: 214–8. 10.3402/gha.v5i0.14876.
- Burt VL, Whelton P, Roccella EJ, Brown C, Cutler JA, Higgins M, et al.. Prevalence of hypertension in the US adult population. Results from the Third National Health and Nutrition Examination Survey, 1988–1991. Hypertension. 1995; 25: 305–13. 10.3402/gha.v5i0.14876.
- Cornoni-Huntley J, Harlan WR, Leaverton PE. Blood pressure in adolescence. The United States Health Examination survey. Hypertension. 1979; 1: 566–71. 10.3402/gha.v5i0.14876.
- Falaschetti E, Chaudhury M, Mindell J, Poulter N. Continued improvement in hypertension management in England: results from the Health Survey for England 2006. Hypertension. 2009; 53: 480–6. 10.3402/gha.v5i0.14876.
- Harlan WR, Cornoni-Huntley J, Leaverton PE. Blood pressure in childhood. The National Health Examination Survey. Hypertension. 1979; 1: 559–65. 10.3402/gha.v5i0.14876.
- Harlan WR, Hull AL, Schmouder RL, Landis JR, Larkin FA, Thompson FE. High blood pressure in older Americans. The First National Health and Nutrition Examination Survey. Hypertension. 1984; 6(6 Pt 1):802–9. 10.3402/gha.v5i0.14876.
- Poirier P, Lemieux I, Mauriège P, Dewailly E, Blanchet C, Bergeron J, et al.. Impact of waist circumference on the relationship between blood pressure and insulin: the Quebec Health Survey. Hypertension. 2005; 45: 363–7. 10.3402/gha.v5i0.14876.
- Primatesta P, Brookes M, Poulter NR. Improved hypertension management and control: results from the health survey for England 1998. Hypertension. 2001; 38: 827–32.
- Redmond N, Baer HJ, Hicks LS. Health behaviors and racial disparity in blood pressure control in the national health and nutrition examination survey. Hypertension. 2011; 57: 383–9. 10.3402/gha.v5i0.14876.
- Westat inc. National Health and Nutrition Survey III: cycle 2: blood pressure quality control program [Internet]. ; 1991. Available from: http://www.cdc.gov/nchs/data/nhanes/nhanes3/cdrom/nchs/manuals/bpqc.pdf [cited 20 June 2011].
- Jones DW, Frohlich ED, Grim CM, Grim CE, Taubert KA. Mercury sphygmomanometers should not be abandoned: an advisory statement from the Council for High Blood Pressure Research, American Heart Association. Hypertension. 2001; 37: 185–6. 10.3402/gha.v5i0.14876.
- Primatesta P, Poulter NR. Improvement in hypertension management in England: results from the Health Survey for England 2003. J Hypertens. 2006; 24(6):1187–92. 10.3402/gha.v5i0.14876.
- World Health Organization. Task shifting : rational redistribution of tasks among health workforce teams: global recommendations and guidelines. Geneva: World Health Organization. 2008.
- Gillman MW, Cook NR. Blood pressure measurement in childhood epidemiological studies. Circulation. 1995; 92: 1049–57. 10.3402/gha.v5i0.14876.
- Van Minh H, Soonthornthada K, Ng N, Juvekar S, Razzaque A, Ashraf A, et al.. Blood pressure in adult rural INDEPTH population in Asia. Glob Health Action. 2009; 2: 60–7.
- Msyamboza KP, Ngwira B, Dzowela T, Mvula C, Kathyola D, Harries AD, et al.. The burden of selected chronic non-communicable diseases and their risk factors in Malawi: Nationwide STEPS Survey. PLoS ONE. 2011; 6: e20316.10.3402/gha.v5i0.14876.
- Minh HV, Byass P, Huong DL, Chuc NTK, Wall S. Risk factors for chronic disease among rural Vietnamese adults and the association of these factors with sociodemographic variables: findings from the WHO STEPS Survey in Rural Vietnam. Prev Chronic Dis. 2005; 4: A22.
- Wan Y, Heneghan C, Stevens R, McManus RJ, Ward A, Perera R, et al.. Determining which automatic digital blood pressure device performs adequately: a systematic review. J Hum Hypertens. 2010; 24: 431–8. 10.3402/gha.v5i0.14876.
- Lewis JE, Boyle E, Magharious L, Myers MG. Evaluation of a community-based automated blood pressure measuring device. CMAJ. 2002; 166: 1145–8.
- Shuler CL, Allison N, Holcomb S, Harlan M, McNeill J, Robinett G, et al.. Accuracy of an automated blood pressure device in stable inpatients: optimum vs routine use. Arch Intern Med. 1998; 158: 714–21. 10.3402/gha.v5i0.14876.
- Cartwright C, Unwin N, Stephenson P. Agreement between the Takeda UA-731 automatic blood pressure measuring device and the manual mercury sphygmomanometer: an assessment under field conditions in Newcastle upon Tyne, UK. J Epidemiol Community Health. 1996; 50: 218–22. 10.3402/gha.v5i0.14876.
- Gallacher JE, Yarnell JW, Rogers S, Sweetnam P. Automatic measurement of blood pressure: evaluation of the Copal UA-231 automatic sphygmomanometer. J Epidemiol Community Health. 1985; 39: 220–3. 10.3402/gha.v5i0.14876.
- Rogers S, Smith GD, Doyle W. Field evaluation of the Copal UA-231 automatic sphygmomanometer. J Epidemiol Community Health. 1988; 42: 321–4. 10.3402/gha.v5i0.14876.
- Nolly H, Osso P, Nolly A, Silva M, Nolly M, Romero M. Self-measurement of blood pressure: validation of the Braun BP VitalScan Plus 1650 monitor according to the European Society of Hypertension International Protocol. Blood Press Monit. 2008; 13: 101–6. 10.3402/gha.v5i0.14876.
- Yi J, Wan Y, Pan F, Yu X, Zhao H, Shang F, et al.. Validation of the Medipro MediCare 100f upper arm blood pressure monitor, for self-measurement, according to the European Society of Hypertension International Protocol revision 2010. Blood Press Monit. 2011; 16: 197–9. 10.3402/gha.v5i0.14876.
- Erdem E, Aydogdu T, Akpolat T. Validation of the Medisana MTP Plus upper arm blood pressure monitor, for self-measurement, according to the European Society of Hypertension International Protocol revision 2010. Blood Press Monit. 2011; 16: 43–6. 10.3402/gha.v5i0.14876.
- Zeng W-F, Huang Q-F, Sheng C-S, Li Y, Wang J-G. Validation of the Kingyield BP101H blood pressure monitor for home blood pressure monitoring according to the European Society of Hypertension International Protocol. Blood Press Monit. 2010; 15: 329–31. 10.3402/gha.v5i0.14876.
- Chen H-E, Cui Y, Sheng C-S, Li L-H, Li Y, Wang J-G. Validation of the Health & Life HL868BA blood pressure monitor for home blood pressure monitoring according to the European Society of Hypertension International Protocol. Blood Press Monit. 2008; 13: 305–8. 10.3402/gha.v5i0.14876.
- Cotte UV, Faltenbacher VH, von Willich W, Bogner JR. Trial of validation of two devices for self-measurement of blood pressure according to the European Society of Hypertension International Protocol: the Citizen CH-432B and the Citizen CH-656C. Blood Press Monit. 2008; 13: 55–62. 10.3402/gha.v5i0.14876.
- O'Brien E, Atkins N, Stergiou G, Karpettas N, Parati G, Asmar R, et al.. European Society of Hypertension International Protocol revision for the validation of blood pressure measuring devices in adults. Blood Press Monit. 2010; 15: 23–38. 10.3402/gha.v5i0.14876.
- Powers BJ, Olsen MK, Smith VA, Woolson RF, Bosworth HB, Oddone EZ. Measuring blood pressure for decision making and quality reporting: where and how many measures?. Ann Intern Med. 2011; 154: 781–8.
- Asmar R, Khabouth J, Mattar J, Pecchioli V, Germano G. Validation of three professional devices measuring office blood pressure according to three different methods: the Omron BP10, the Omron HBP T105 and the Pic Indolor Professional. J Hypertens. 2010; 28: 452–8. 10.3402/gha.v5i0.14876.
- Westat inc. National Health and Nutrition Survey III: cycle 2: physician examiner's training manual [Internet]. ; 1991. Available from: http://www.cdc.gov/nchs/data/nhanes/nhanes3/cdrom/nchs/manuals/phys.pdf [cited 20 June 2011].
- Bland JM, Altman DG. Statistical methods for assessing agreement between two methods of clinical measurement. Lancet. 1986; 1: 307–10. 10.3402/gha.v5i0.14876.
- Snijders T, Bosker R. Multilevel analysis: an Introduction to basic and advanced multilevel modeling. Sage Publishers. London, 1999
- Pinheiro JC, Bates DM. Mixed-effects models in S and S-PLUS. Springer. New York NY, 2000
- Baayen RH, Davidson DJ, Bates DM. Mixed-effects modeling with crossed random effects for subjects and items. J Mem Lang. 2008; 59: 390–412. 10.3402/gha.v5i0.14876.
- R Development Core Team. R: a language and environment for statistical computing [Internet]. ViennaAustria: R Foundation for Statistical Computing. 2011. Available from: http://www.R-project.org.
- Bates D, Maechler M, Bolker B. lme4: linear mixed-effects models using S4 classes [Internet]. 2011. Available from: http://CRAN.R-project.org/package = lme4.
- Chobanian AV, Bakris GL, Black HR, Cushman WC, Green LA, Izzo JL Jr, et al.. The seventh report of the Joint National Committee on prevention, detection, evaluation, and treatment of high blood pressure: the JNC 7 report. JAMA. 2003; 289: 2560–72. 10.3402/gha.v5i0.14876.
- Pickering TG, Hall JE, Appel LJ, Falkner BE, Graves J, Hill MN, et al.. Recommendations for blood pressure measurement in humans and experimental animals. Circulation. 2005; 111: 697–716. 10.3402/gha.v5i0.14876.
- Allotey P, Reidpath D, Ghalib H, Pagnoni F, Skelly W. Efficacious, effective, and embedded interventions: implementation research in infectious disease control. BMC Public Health. 2008; 8: 343.10.3402/gha.v5i0.14876.